11email: Wing-Fai.Thi@obs.ujf-grenoble.fr 22institutetext: Dep. de Física Teórica, Fac. de Ciencias, UAM Campus Cantoblanco, 28049 Madrid, Spain 33institutetext: University of Vienna, Dept. of Astronomy, Türkenschanzstr. 17, A-1180 Vienna, Austria 44institutetext: School of Physics & Astronomy, University of St. Andrews, North Haugh, St. Andrews KY16 9SS, UK 55institutetext: UK Astronomy Technology Centre, Royal Observatory, Edinburgh, Blackford Hill, Edinburgh EH9 3HJ, UK 66institutetext: Max Planck Institute for Astronomy, Königstuhl 17 D-69117, Heidelberg, Germnay 77institutetext: Kapteyn Astronomical Institute, P.O. Box 800, 9700 AV Groningen, The Netherlands 88institutetext: Space Telescope Science Institute, 3700 San Martin Drive, Baltimore, MD 21218, USA 99institutetext: Eureka Scientific and Exoplanets and Stellar Astrophysics Lab, NASA Goddard Space Flight Center, Code 667, Greenbelt, MD, 20771, USA 1010institutetext: Clemson University, Clemson, SC, USA 1111institutetext: Department of Physics & Astronomy, The Open University, Milton Keynes MK7 6AA, UK 1212institutetext: The Rutherford Appleton Laboratory, Chilton, Didcot, OX11 OQL, UK 1313institutetext: SOFIA-USRA, NASA Ames Research Center, Mailstop 211-3 Moffett Field CA 94035 USA
Detection of CH+ emission from the disc around HD~100546††thanks: Herschel is an ESA space observatory with science instruments provided by Principal Investigator consortia. It is open for proposals for observing time from the worldwide astronomical community.
Despite its importance in the thermal balance of the gas and in the determination of primeval planetary atmospheres, the chemistry in protoplanetary discs remains poorly constrained with only a handful of detected species. We observed the emission from the disc around the Herbig Be star HD~100546 with the PACS instrument in the spectroscopic mode on board the Herschel Space Telescope as part of the GaS in Protoplanetary Systems (GASPS) programme and used archival data from the DIGIT programme to search for the rotational emission of CH+. We detected in both datasets an emission line centred at 72.16 m that most likely corresponds to the =5-4 rotational emission of CH+. The =3-2 and 6-5 transitions are also detected albeit with lower confidence. Other CH+ rotational lines in the PACS observations are blended with water lines. A rotational diagram analysis shows that the CH+ gas is warm at 323 K with a mass of 3 10-14-5 10-12 M⊙. We modelled the CH+ chemistry with the chemo-physical code ProDiMo using a disc density structure and grain parameters that match continuum observations and near- and mid-infrared interferometric data. The model suggests that CH+ is most abundant at the location of the disc rim at 10-13 AU from the star where the gas is warm, which is consistent with previous observations of hot CO gas emission.
Key Words.:
Circumstellar discs, Astrochemistry1 Introduction
Planets are formed in discs around young stars. The building of
planets is intimately linked to the grain-growth process and the
disc’s chemical evolution (Bergin et al., 2007). The
chemical and temperature profiles of discs determine the chemical
composition of the gas that will eventually be incorporated into a
planet’s atmosphere, once a solid 10 Earth mass core is formed
(Armitage, 2010). Millimetre observations of molecules in discs
probe the outer cold part
(Dutrey et al. 1997, e.g.; van Zadelhoff et al. 2001, e.g.; Thi et al. 2004, e.g.; Semenov et al. 2005, e.g.; Henning et al. 2010, e.g.; Öberg et al. 2010, e.g.). Minor
species located in the inner disc, such as C2H2 and HCN, were
observed with the Spitzer Space Telescope
(Carr & Najita, 2008; Pascucci & Sterzik, 2009; Lahuis et al., 2006; Pontoppidan et al., 2010). Gas-phase
carbon is believed to be locked into C+, C, and CO. However, a
significant fraction of the carbon can be locked into CH and CH+,
which are observed in the optical in diffuse clouds.
The Herschel Space Telescope permits observations of
hydrides and their ions (OH, OH+, CH, CH+, …), and warm light
molecular gas (e.g., H2O), which all emit in the
far-infrared. Rotational lines of CH+ at 300-500 K in the far-IR
have been observed by ISO towards the NGC7027 PDR
(Cernicharo et al., 1997). The isotopologue 13CH+
=1-0 was detected in absorption in the diffuse medium by
Falgarone et al. (2005). The lowest rotational transition
was detected in emission in the Orion Bar
(Naylor et al., 2010; Habart et al., 2010) and in
absorption towards DR 21 (Falgarone et al., 2010)
with Herschel. The neutral counterpart CH has also been detected
in the diffuse medium by Herschel
(Qin et al., 2010; Gerin et al., 2010). In this
letter, we discuss the detection of emission lines with Herschel that
we assign to the rotational transition of CH+ from the disc around
the 10 Myrs old Herbig Be star HD~100546
(= 2.2 M⊙, = 27 L⊙, = 10500 K) located at 103 pc
(van den Ancker et al., 1997). HD~100546 shows a
very rich gas and a solid spectrum in the infrared and millimetre
ranges
(Brittain et al., 2009; Sturm et al., 2010; Panić et al., 2010; Malfait et al., 1998).

2 Herschel observations and rotational diagram
We observed HD~100546 with PACS (Poglitsch et al., 2010)
on board the Herschel Space Telescope (Pilbratt et al., 2010) in
the 72-73 m spectroscopic scan range (= 163 km
s-1), as part of the open-time key programme GASPS (GaS in
Protoplanetary Systems, obsid 1342188437), which aims at a systematic
study of gas and dust in discs around stars aged between 0.5 and 30
Myrs. The observations were reduced using the standard pipeline in
HIPE 4.2. We detected a line at 72.14 m that we assign to
the rotational =5-4 emission of CH+ (see Fig. 1). We also detected the same line in
the science demonstration data spectrum taken by the DIGIT team
(Sturm et al., 2010), together with the =6-5
(60.24 m) and =3-2 (119.68 m) lines but with a lower
signal-to-noise ratio. It was not possible to strengthen our analysis
with detection of either the lowest rotational transition =1-0,
which lies in the SPIRE/HIFI range, or the =2-1 and =4-3
lines in the DIGIT dataset, which are blended with water
emission lines at the PACS resolution. The ortho H2O
212-101 emission at 179.52 m is blended with the CH+
=2-1 line at 179.61 m, and the para-H2O 322-211
at 89.98 m is blended with the CH+ =4-3 line at
90.02 m. The flux calibration accuracy of the Herschel-PACS
instrument is currently 30% in addition to the statistical noise. In
addition, flux uncertainties are introduced by difficulties in
determining the continuum level in the DIGIT spectra. A new
reduction with HIPE 7.0.822, which includes division by the spectral
response function and flatfielding, does not improve the noise level
in the continuum. The line ratio
63 m/CH+ =5-4 is 80. We fitted a Gaussian profile to each
line. The observed CH+, , (Sturm et al., 2010), and CO 3–2
(Panić et al., 2010) fluxes are all reported in
Table 1.
We constructed a rotational diagram by assuming LTE population
and optically thin emission (see lower right panel of
Fig. 1). The level energies, line
frequencies, and Einstein spontaneous emission coefficients were
computed by Müller (2010) based on the
spectroscopic analysis of Amano (2010) . We
analysed the diagram using censored data regression and bootstrapping
methods. We derived an excitation temperature of
323 K, a disc-averaged CH+ column density of
4.3 1012 cm-2, consistent with the
upper limit found in observing CH+ at 4232.7 Å (Martin-Zaïdi
et al., submitted), and a lower limit to the CH+ mass of
3.3 10-13 M⊙. The CH+
emitting gas is warm, which suggests that CH+ is located within
100 AU of the star. The CH+ abundance is
3.9 10-9 relative to an upper limit of warm
molecular gas from the VISIR H2 (1) 17 m observation of
M(=300 K) 8.4 10-5 M⊙
(Martin-Zaïdi et al., 2010).
| Transition | obs.1 | model 1 | model 2 | |
|---|---|---|---|---|
| (m) | (10-17 W m-2) | |||
| 3PP2 | 63.19 | 554.37 167a | 785 | 763 |
| 3PP1 | 145.54 | 35.70 11.4 | 35.7 | 42.7 |
| 2PP1/2 | 157.75 | 31.87 10.0 | 12.7 | 17.2 |
| p-H2O | 89.90 | 14.32 5.6b | 4.6 | 7.4 |
| CH+ | 90.02 | 14.32 5.6b | 3.7 | 6.3 |
| CH+ | 60.25 | 10.32 5.7 | 4.2 | 8.9 |
| CH+ | 72.14 | 6.86 3.4 | 3.3 | 6.7 |
| CH+ | 119.87 | 2.16 1.1 | 1.8 | 2.9 |
| CO | 866.96 | 0.10 0.03 | 0.08 | 0.24 |
| MCFOSTa | |||
|---|---|---|---|
| inner disc | surf. layer | outer disc | |
| Inner radius (AU) | 0.24 | 13 | 13 |
| Outer radius (AU) | 4 | 50 | 500 |
| Surf. density exponent | 1 | 0.5 | 1.125 |
| Scale height (AU) | 6 | 14a | 14a |
| Scale height exponent | 1.0 | 1.0 | 1.0 |
| Total dust mass (M⊙) | 1.75(-10)b | 3(-7) | 4.3(-4) |
| Dust mass ( 1mm, M⊙) | 1.75(-10) | 3(-7) | 1.3(-4) |
| Min. grain radius (m) | 0.1 | 0.05 | 1 |
| Max. grain radius (m) | 5 | 1 | 104 |
| Grain power law index | 3.5 | 3.5 | 3.5 |
| Silicate grain density (g cm-3) | 3.0 | 3.0 | 3.0 |
| ProDiMoc | |||
| ISM UV field (, Habing) | 1.0 | ||
| viscosity () | 0.0 | ||
| Non-thermal speed (km s-1) | 0.15 | ||
| Disc inclination (°) | 42 | ||
| UV excess | 0.013 | ||
| UV power-law index | 6.5 | ||
| Cosmic ray flux (s-1) | 1(-17) | ||
| PAH C150H30 mass (M⊙) | 1.8(-7) | ||
| Gas mass (M⊙) | 5(-4) (model 1) | ||
| Gas mass (M⊙) | 1(-3) (model 2) | ||
a Values taken from Benisty et al. (2010) and Tatulli et al. (2011) except for the scale height at 100 AU. b means 10-β. c This work.
3 Modelling the physics and chemistry of CH+
We first fitted the spectral energy distribution (SED) and infrared
interferometric VLT-AMBER and MIDI data to constrain the
dust properties and the disc structure with a hydrostatic disc using
the MCFOST radiative transfer code
(Pinte et al., 2006, 2009). The details
of the fit are discussed in Benisty et al. (2010) and
Tatulli et al. (2011, submitted). The disc is composed of three
parts: the inner disc, the outer disc, and an upper layer on the top
of the outer disc (see Table 2,
Fig. 3, and the sketch in
Benisty et al. 2010). The inner and outer discs are
separated by a gap
(Bouwman et al., 2003; Grady et al., 2005). The fit
to the SED in Tatulli et al. (2011) suggests a scale height value of
10 AU at 100 AU, which is consistent with the scattered-light images,
but equally good fits can also be obtained with other values.
Therefore we tried several disc structures by varying the scale height
. Using the disc structures derived from the fit
to the SED, we modelled the gas chemistry and radiative transfer in the
HD~100546 disc with the ProDiMo code
(Woitke et al., 2009; Kamp et al., 2010). The ProDiMo code computes the chemistry and heating-cooling balance of
the gas self-consistently. We assumed a non-viscous gas (=0)
and a PAH mass (C150H30) that is consistent with the strong
PAH emissions in the IR (Keller et al., 2008). Large PAHs
( 100 carbon atoms) exhibit a strong feature between 10.9 and
11.3 m (Bauschlicher et al., 2009) as seen in the
spectrum of HD~100546. The amount of PAH influences both the
thermal state of the disc and the ionisation state of the upper
layers. The non-thermal line width is constrained by the resolved CO
3-2 profile. We used a dereddened FUSE and IUE UV spectrum as input to
the gas modelling (Martin-Zaïdi et al., 2008). We also ran a
ProDiMo model where the disc vertical structure is calculated
according to the gas
pressure and found that the height of the rim at 13 AU is consistent with the fixed three-part structure.
The main CH+ formation reaction C+ + H2 CH+
+ H (reaction 1) is endothermic by 0.398 eV (4537K). The reaction is
efficient only at a few 100 K found in shocked or turbulent regions or
when H2 is vibrationally excited
(Hierl et al., 1997; Agúndez et al., 2010). The rate
for reaction 1 in Herbst & Knudson (1981) underestimates the
experimental data by a factor of 2-3, and the UMIST 2006 rate
(Woodall et al., 2007) is a factor 7–8 lower than the
experimental values. Initial models with a low rate for reaction 1
underpredict the CH+ abundance by more than a factor 10. We adopted
the value suggested by Hierl et al. (1997): .
We also take the enhanced rate for vibrationally-excited molecular
hydrogen into account by assuming that the rate is equal to the
Langevin collision value of 1.6 10-9 cm3 s-1
(Agúndez et al., 2010). The alternative radiative
association reaction has an extremely low rate of
10-16-10-17 cm-3 s-1
(Barinovs & van Hemert, 2006). The warm and UV-excited gas at
the disc atmosphere around a Herbig AeBe star renders reaction 1
fast. CH+ reacts with H2 to form CH, which in turn reacts
with H2 to form CH. As both exothermic reactions are fast, an
enhanced abundance of CH+ is accompanied by a high abundance of
CH and CH, which have not been detected yet. CH+ can
also dissociatively recombine with an electron into C+ and H or
exchange its charge with PAHs. CH+ is also destroyed upon
absorption of UV photons. The absorption cross-section peaks at
950 Å. Therefore, the photodissociation around a B9.5V star
without strong UV excess due to accretion is not as fast as with an
interstellar UV field. The photodissociation and photoionisation rates
are computed inside the disc using cross-sections taken from
van Dishoeck et al. (2006). The steady-state chemistry
includes 188 gas and solid species.
We ran several models with disc gas mass between 10-4 and
10-2 M⊙ and H100AU between 10 and 20 AU
(Fig. 4). In
Table 1 we show the three detected line fluxes
for CH+ out of the 15 rotational transitions in the model, the OI
and CII fine-structure lines, and the CO 3–2 transition for our
preferred models, which have a disc mass of (0.5–1) 10-3
M⊙ and H AU, for the outer disc. All the
modelled lines agree within a factor 2 with the observations. In
particular, the sum of the p-H2O and CH+
fluxes is consistent with the observed value. The collision rates of
CH+ with electrons were computed by
Lim et al. (1999). In the absence of published collision
rates with H2, we scaled the collision rates with He by 1.39 for
transitions
(Hammami et al., 2009; Turpin et al., 2010).
4 Discussion
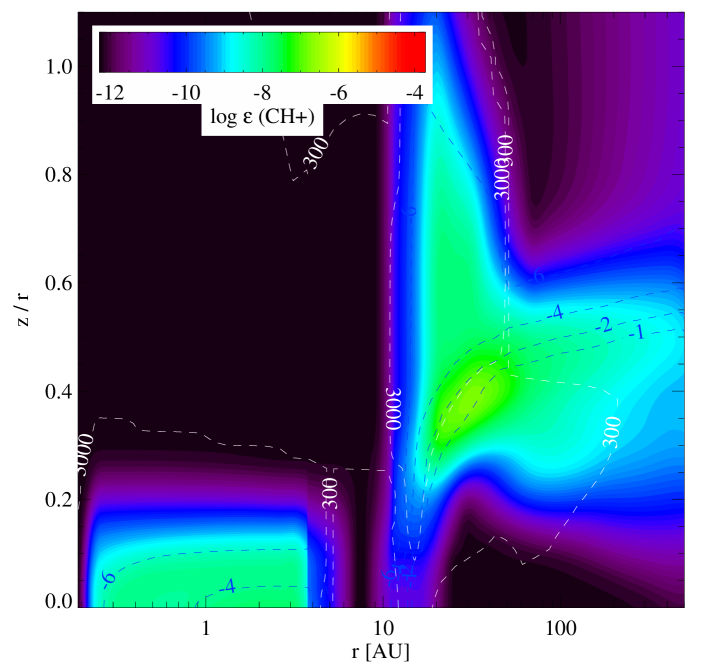
The models suggest that CH+ is mostly located on the rim (10-13 AU)
of the outer disc and at the disc surface
(Fig. 2). Although CH+ is
abundant in the tenuous inner disc, its amount is insufficient to
contribute to the 72.14 m emission. CH+ is located where the
gas is mostly heated by collisional de-excitations of nascent and
UV-pumped H. Part of the CH+ is formed by the reaction with
excited H, but the main fraction comes from the reaction of
C+ with thermal H2 at 400 K. CH+ reaches
a maximum abundance of 10-7 just behind the rim and has a
total mass of 10-13-10-12 M⊙. The disc average CH+
abundance is (0.7-7) 10-9 relative to H-nuclei,
consistent with the simple analysis in
Sect. 2. The high CH+ abundance in the rim
region and upper disc layers where hydrogen is in atomic form does not
affect the C+ abundance much, which reaches 10-4. However
below the disc atmosphere, H2 self-shielding is efficient, and
C+ is converted rapidly into CH+. The formation reaction of
CH+ (C++H2) competes with the recombination reaction of C+
to form neutral carbon.
Warm OH (Sturm et al., 2010) and fluorescent
ro-vibrational CO emission
(Brittain et al., 2009; van der Plas et al., 2009) have
also been detected in HD~100546 . OH is mostly formed by the
reaction of atomic oxygen O with thermally hot H2 and vibrationally
excited H. The presence of hot CO, CH+ and OH supports the
idea that hot and excited gas chemical reactions occur on disc
surfaces and at the inner rim.
5 Conclusions
We detected the =5-4 rotational transition of CH+ at 72.16 m in two Herschel datasets. We also tentatively detected other lines from CH+ at 60.25 and 119.87 m. Other CH+ lines are blended with water lines. We modelled the CH+ line fluxes using the most recent chemical and collisional rates. Searches for CH+ in other Herbig AeBe discs are warranted to test whether the presence of CH+ is unique to HD~100546 or if it is related to the presence of a high temperature rim of gas, or both.
Acknowledgements.
The Grenoble group acknowledges PNPS, CNES, and ANR (contract ANR-07-BLAN-0221). C. Eiroa and G. Meeus are partly supported by the Spanish grant AYA 2008-01727. C. Pinte acknowledges the funding from the EC 7th Framework Programme (PIEF-GA-2008-220891, PERG06-GA-2009-256513). I. Pascucci, M. Grady, S. Brittain, C. Howard, and G. Sandell acknowledge NASA/JPL.References
- Agúndez et al. (2010) Agúndez, M., Goicoechea, J. R., Cernicharo, J., Faure, A., & Roueff, E. 2010, ApJ, 713, 662
- Amano (2010) Amano, T. 2010, ApJ, 716, L1
- Armitage (2010) Armitage, P. J. 2010, Astrophysics of Planet Formation, ed. Armitage, P. J.
- Barinovs & van Hemert (2006) Barinovs, Ğ. & van Hemert, M. C. 2006, ApJ, 636, 923
- Bauschlicher et al. (2009) Bauschlicher, C. W., Peeters, E., & Allamandola, L. J. 2009, ApJ, 697, 311
- Benisty et al. (2010) Benisty, M., Tatulli, E., Ménard, F., & Swain, M. R. 2010, A&A, 511, A75+
- Bergin et al. (2007) Bergin, E. A., Aikawa, Y., Blake, G. A., & van Dishoeck, E. F. 2007, Protostars and Planets V, 751
- Bouwman et al. (2003) Bouwman, J., de Koter, A., Dominik, C., & Waters, L. B. F. M. 2003, A&A, 401, 577
- Brittain et al. (2009) Brittain, S. D., Najita, J. R., & Carr, J. S. 2009, ApJ, 702, 85
- Carr & Najita (2008) Carr, J. S. & Najita, J. R. 2008, Science, 319, 1504
- Cernicharo et al. (1997) Cernicharo, J., Liu, X., Gonzalez-Alfonso, E., et al. 1997, ApJ, 483, L65+
- Dutrey et al. (1997) Dutrey, A., Guilloteau, S., & Guelin, M. 1997, A&A, 317, L55
- Falgarone et al. (2010) Falgarone, E., Ossenkopf, V., Gerin, M., et al. 2010, A&A, 518, L118+
- Falgarone et al. (2005) Falgarone, E., Phillips, T. G., & Pearson, J. C. 2005, ApJ, 634, L149
- Gerin et al. (2010) Gerin, M., de Luca, M., Goicoechea, J. R., et al. 2010, A&A, 521, L16+
- Grady et al. (2005) Grady, C. A., Woodgate, B., Heap, S. R., et al. 2005, ApJ, 620, 470
- Habart et al. (2010) Habart, E., Dartois, E., Abergel, A., et al. 2010, A&A, 518, L116+
- Hammami et al. (2009) Hammami, K., Owono Owono, L. C., & Stäuber, P. 2009, A&A, 507, 1083
- Henning et al. (2010) Henning, T., Semenov, D., Guilloteau, S., et al. 2010, ApJ, 714, 1511
- Herbst & Knudson (1981) Herbst, E. & Knudson, S. 1981, ApJ, 245, 529
- Hierl et al. (1997) Hierl, P. M., Morris, R. A., & Viggiano, A. A. 1997, J. Chem. Phys., 106, 10145
- Kamp et al. (2010) Kamp, I., Tilling, I., Woitke, P., Thi, W., & Hogerheijde, M. 2010, A&A, 510, A18+
- Keller et al. (2008) Keller, L. D., Sloan, G. C., Forrest, W. J., et al. 2008, ApJ, 684, 411
- Lahuis et al. (2006) Lahuis, F., van Dishoeck, E. F., Boogert, A. C. A., et al. 2006, ApJ, 636, L145
- Lim et al. (1999) Lim, A. J., Rabadán, I., & Tennyson, J. 1999, MNRAS, 306, 473
- Malfait et al. (1998) Malfait, K., Waelkens, C., Waters, L. B. F. M., et al. 1998, A&A, 332, L25
- Martin-Zaïdi et al. (2010) Martin-Zaïdi, C., Augereau, J., Ménard, F., et al. 2010, A&A, 516, A110+
- Martin-Zaïdi et al. (2008) Martin-Zaïdi, C., Deleuil, M., Le Bourlot, J., et al. 2008, A&A, 484, 225
- Müller (2010) Müller, H. S. P. 2010, A&A, 514, L6+
- Naylor et al. (2010) Naylor, D. A., Dartois, E., Habart, E., et al. 2010, A&A, 518, L117+
- Öberg et al. (2010) Öberg, K. I., Qi, C., Fogel, J. K. J., et al. 2010, ApJ, 720, 480
- Panić et al. (2010) Panić, O., van Dishoeck, E. F., Hogerheijde, M. R., et al. 2010, A&A, 519, A110+
- Pascucci & Sterzik (2009) Pascucci, I. & Sterzik, M. 2009, ApJ, 702, 724
- Pilbratt et al. (2010) Pilbratt, G. L., Riedinger, J. R., Passvogel, T., et al. 2010, A&A, 518, L1+
- Pinte et al. (2009) Pinte, C., Harries, T. J., Min, M., et al. 2009, A&A, 498, 967
- Pinte et al. (2006) Pinte, C., Ménard, F., Duchêne, G., & Bastien, P. 2006, A&A, 459, 797
- Poglitsch et al. (2010) Poglitsch, A., Waelkens, C., Geis, N., et al. 2010, A&A, 518, L2+
- Pontoppidan et al. (2010) Pontoppidan, K. M., Salyk, C., Blake, G. A., et al. 2010, ApJ, 720, 887
- Qin et al. (2010) Qin, S., Schilke, P., Comito, C., et al. 2010, A&A, 521, L14+
- Semenov et al. (2005) Semenov, D., Pavlyuchenkov, Y., Schreyer, K., et al. 2005, ApJ, 621, 853
- Sturm et al. (2010) Sturm, B., Bouwman, J., Henning, T., et al. 2010, A&A, 518, L129+
- Thi et al. (2004) Thi, W., van Zadelhoff, G., & van Dishoeck, E. F. 2004, A&A, 425, 955
- Turpin et al. (2010) Turpin, F., Stoecklin, T., & Voronin, A. 2010, A&A, 511, A28+
- van den Ancker et al. (1997) van den Ancker, M. E., The, P. S., Tjin A Djie, H. R. E., et al. 1997, A&A, 324, L33
- van der Plas et al. (2009) van der Plas, G., van den Ancker, M. E., Acke, B., et al. 2009, A&A, 500, 1137
- van Dishoeck et al. (2006) van Dishoeck, E. F., Jonkheid, B., & van Hemert, M. C. 2006, Faraday Discussions, 133, 231
- van Zadelhoff et al. (2001) van Zadelhoff, G.-J., van Dishoeck, E. F., Thi, W.-F., & Blake, G. A. 2001, A&A, 377, 566
- Woitke et al. (2009) Woitke, P., Kamp, I., & Thi, W. 2009, A&A, 501, 383
- Woodall et al. (2007) Woodall, J., Agúndez, M., Markwick-Kemper, A. J., & Millar, T. J. 2007, A&A, 466, 1197
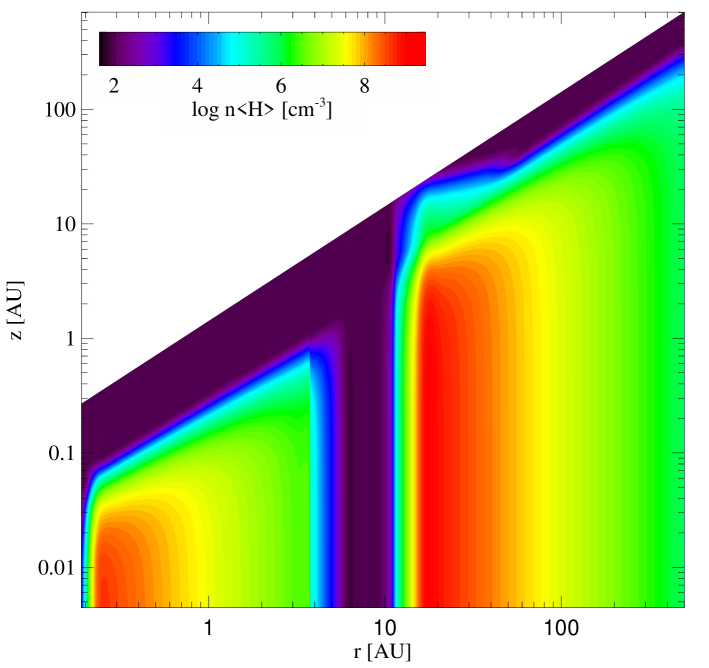
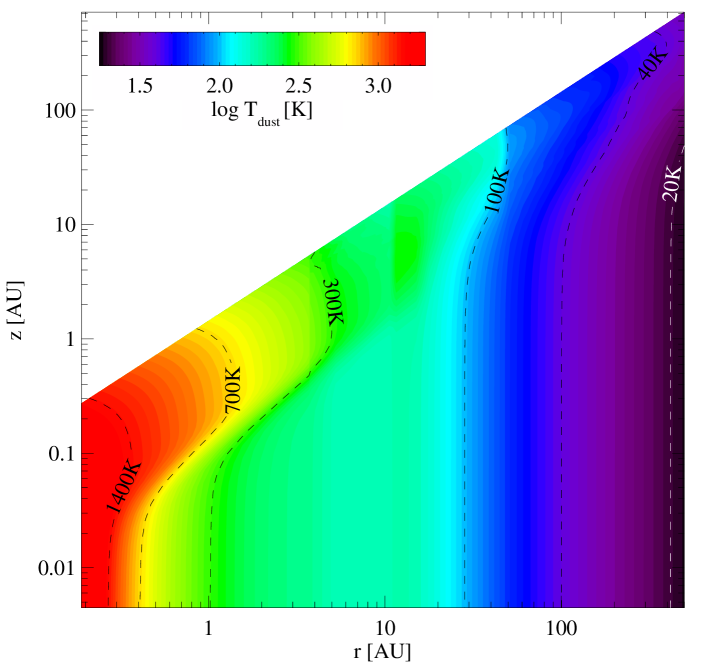
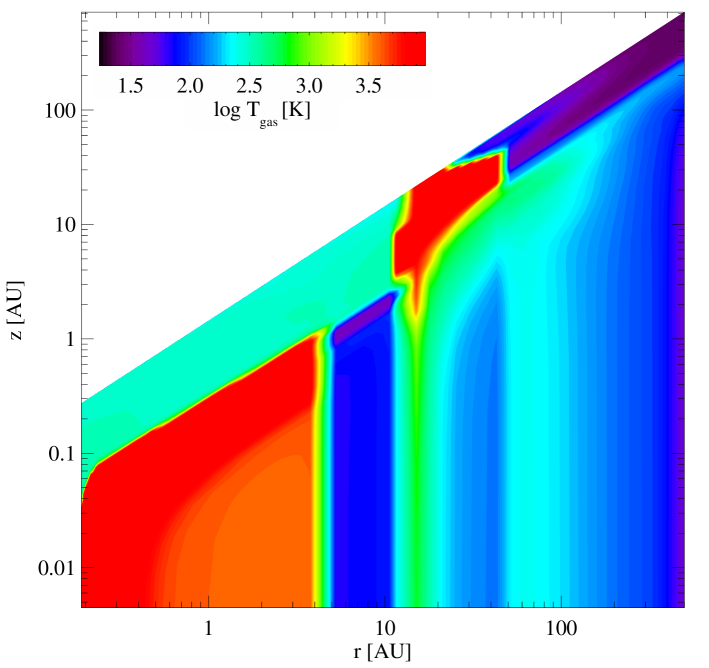
Appendix A Disc density and gas temperature structure
We provide for completeness the disc density and the dust and gas temperature structures for model 2 (Fig. 3, 4, and 5).