11email: els.vanaarle@ster.kuleuven.be 22institutetext: SUPA, School of Physics & Astronomy, University of St Andrews, North Haugh, St Andrews KY16 9SS, Scotland, UK 33institutetext: Department of Physics and Astronomy, University of Denver, 2112 E. Wesley, Denver, CO 80208, USA 44institutetext: Mount Stromlo Observatory, Cotter Road, Weston Creek, ACT 2611, Australia 55institutetext: Department of Astrophysical and Planetary Sciences, University of Colorado, Boulder, CO 80309, USA
The optically bright post-AGB population of the LMC
Abstract
Context. The detected variety in chemistry and circumstellar shell morphology of the limited sample of Galactic post-Asymptotic Giant Branch (AGB) stars is so large that there is no consensus yet on how the different objects are linked by evolutionary channels. The evaluation is complicated by the fact that their distances and hence luminosities remain largely unknown.
Aims. We construct a catalogue of the optically bright post-AGB stars in the Large Magellanic Cloud (LMC). The sample forms an ideal testbed for stellar evolution theory predictions of the final phase of low- and intermediate-mass stars, because the distance and hence luminosity and also the current and initial mass of these objects is well constrained.
Methods. Via cross-correlation of the Spitzer SAGE catalogue with optical catalogues we selected a sample of LMC post-AGB candidates based on their colour index and estimated luminosity. We determined the fundamental properties of the central stars of 105 of these objects using low-resolution, optical spectra that we obtained at Siding Spring Observatory and SAAO.
Results. We constructed a catalogue of 70 high probability and 1337 candidate post-AGB stars that is available at the CDS††thanks: via anonymous ftp to cdsarc.u-strasbg.fr (130.79.128.5) or via http://cdsweb.u-strasbg.fr/cgi-bin/qcat?J/A+A/. About half of the objects in our sample of post-AGB candidates show a spectral energy distribution (SED) that is indicative of a disc rather than an expanding and cooling AGB remnant. Like in the Galaxy, the disc sources are likely associated with binary evolution. Important side products of this research are catalogues of candidate young stellar objects, candidate supergiants with circumstellar dust, and discarded objects for which a spectrum was obtained. These too are available at the CDS.
Key Words.:
Stars: AGB and post-AGB – Stars: evolution – (Galaxies:) Magellanic Clouds – (Stars:) circumstellar matter1 Introduction
During their final evolution, stars of low- and intermediate-mass transit rapidly from the asymptotic giant branch (AGB) along the post-AGB passage towards the planetary nebula (PN) phase, before the stellar remnant cools down as a white dwarf (WD). In these late phases, it is the external mass-loss that governs stellar evolution and it is well known that the accumulated mass-loss of lower-mass stars is one of the major contributions to the interstellar medium (ISM) enrichment in gas and dust. This recycling of gas and dust between the ISM and stars is one of the strong evolutionary drivers of a galaxy’s visible matter and its chemical and spectral characteristics (e.g., Meixner et al. 2006).
Although this scheme of the late phases of stellar evolution may be generally acknowledged, there is no understanding from first principles of several important physical processes that govern these evolutionary phases. The main shortcomings are related to the lack of understanding of the mass-loss mechanisms and mass-loss rate along the AGB ascent (e.g., Höfner 2009), the subsequent shaping processes of the circumstellar shells (e.g., de Marco 2009), and the lack of fundamental understanding of the internal chemical evolution of these stars (e.g., Herwig 2005).
During the last few years it has been repeatedly shown that research on post-AGB stars can lead to surprising results regarding chemical evolution. Post-AGB stars are chemically much more diverse than previously thought. Some objects are the most s-process-enriched objects known to date (e.g., Reyniers et al. 2004, and references therein) while others are not enriched at all (e.g., Luck et al. 1990; Takeda et al. 2007). In addition, the photospheric composition of some post-AGB stars shows some degree of depletion of refractory elements: elements with a high dust condensation temperature are systematically underabundant (e.g., Giridhar et al. 2005; Maas et al. 2005; Hinkle et al. 2007). In almost all depleted post-AGB objects, there is observational evidence of a stable Keplerian circumbinary disc, which resembles protoplanetary discs around young stellar objects (YSOs) (De Ruyter et al. 2006). The discs are spatially resolved, but this is only detectable using interferometric techniques (Deroo et al. 2006, 2007), and they typically have a radius of only 50 AU at 10 m. The high dust-grain processing is an observational indication that the compact discs are stable (De Ruyter et al. 2005; Gielen et al. 2008, 2009). Since the discovery of the binary nature of a small sample of the most depleted objects (Van Winckel et al. 1995), this binary nature of the disc sources has been further confirmed (Van Winckel et al. 2009). The orbital elements imply a phase of strong interaction when the evolved star was at giant dimensions. It is postulated that the disc was formed during this phase (Waters et al. 1992).
Another key question in stellar evolution is the understanding of the physical processes driving and shaping the whole circumstellar environment (CSE). This is in part because of the high spatial and dynamical complexity of many of these structures, as illustrated abundantly by the optical images of PNe in scattered light and in nebular optical emission lines (e.g., Balick & Frank 2002, and references therein). A major discussion topic in the PNe community is the growing evidence that PN physics is in fact largely determined by processes only found in binary stars (e.g., de Marco 2009).
The terms ’proto-planetary nebula’ (PPN) and ’post-AGB star’ are often used as synonyms, but in this contribution we restrict the use of ’PPN’ to objects with a resolved circumstellar shell. The PPNe display a surprisingly wide variety in shape and structure in thermal emission and in scattered light (e.g., Meixner et al. 1999; Ueta et al. 2000; Sahai et al. 2007; Siódmiak et al. 2008; Verhoelst et al. 2009, and references therein), which allows direct probing of the shells. They are better suited to study the AGB mass-loss process than are PNe because their structures are not yet affected by the ionisation front. In PNe, this front has swept through the bulk of the optically bright regions, and therefore the density structure in these regions does not necessarily reflect the history of AGB mass-loss and the shell structure shaping processes that might have occurred before the sweeping by the ionisation front. Most PPNe have axisymmetric structures with a wide range of pole-to-equator density gradients (Meixner et al. 2002; Ueta & Meixner 2003). Moreover, in many objects, molecular collimated outflows are present very early after the AGB evolution. These winds carry a linear momentum that is too big to be driven by the radiation pressure on the dust particles (Bujarrabal et al. 2001). Symmetry breaking of the spherical winds must hence occur at the end of the AGB phase, but the primary driving forces remain unclear.
In addition to gaining insight into their own evolutionary phase (e.g., Van Winckel 2003), post-AGB star studies can also help us to better understand the AGB-evolution of which they are the final product. Thanks to the broad spectral range of their electromagnetic spectrum, a simultaneous study of the stellar photosphere and the circumstellar environment is possible: the central star is responsible for the UV and optical emission while the cool circumstellar envelope radiates in the infrared (IR).
Post-AGB stars evolve on a very fast track (Vassiliadis & Wood 1993; Blöcker 1995) and they are rare as a consequence. In the web catalogue of Torún (Szczerba et al. 2007) only 326 Galactic objects are listed as good candidate post-AGB stars. One of the biggest problems in confronting the wide variety in observational characteristics of well-studied individual objects with stellar evolution theory is that distances and hence intrinsic luminosities are largely unknown. Therefore, there is no clear consensus on how the many detailed studies of individual objects might be linked by evolutionary channels. Thanks to the recent IR surveys we can now overcome this Galactic limitation by studying the post-AGB population in other galaxies. In this paper we focus on the Large Magellanic Cloud (LMC). Because of its proximity (50 kpc, Feast 1999) and favourable angle (, van der Marel & Cioni 2001), all LMC stars can be considered to have a similar distance from the Sun, hence, their luminosities and associated masses are directly measurable.
The paper is organised as follows: In Sect. 2 we explain our selection criteria to obtain a catalogue of post-AGB candidates inspired by the spectral energy distributions (SEDs) of Galactic sources. The diversity of Galactic post-AGB stars is so large that IR colour selection alone, even when combined with a luminosity criterion, does not allow us to unambiguously identify post-AGB stars without spectroscopic confirmation. We therefore obtained a large number of low-resolution, optical spectra to investigate the central objects of the brightest post-AGB candidates. The results of this survey are discussed in Sect. 3.2. In Sect. 4 we analyse different characteristics of the entire sample. We subsequently evaluate our endeavour in Sect. 5. The catalogue of post-AGB candidates is available at the CDS.
2 Sample selection
2.1 SAGE dataproducts
Post-AGB stars are expected to be bright IR emitters because the relic of the mass-loss on the AGB is still able to convert the photospheric radiation efficiently into warm, thermal emission. Hence, systematic searches to identify post-AGB stars became possible only when mid- to far-IR experiments were started in the mid 80’s (e.g., Kwok 1993). The IRAS mission launched in 1983 was most successful in enabling systematic identification of post-AGB candidates, and the (, ) colour-colour diagram has been used extensively as a basis for ground-based follow-up to identify objects between the locus of the PNe and the late-type AGB stars (e.g., Kwok et al. 1987; Volk & Kwok 1989; van der Veen et al. 1989; Manchado et al. 1989; Hu et al. 1993; Garcia-Lario et al. 1997; Van de Steene et al. 2000). Some of these objects are optically fairly faint because the selection criteria focus on the expected properties of the expanding dust shell. Other systematic searches focused on cross-correlating optical catalogues with the IRAS point-source catalogue in search of luminous objects with an IR excess due to thermal radiation of the circumstellar dust (e.g., Hrivnak et al. 1989; Pottasch & Parthasarathy 1988; Trams et al. 1991; Oudmaijer et al. 1992). These objects display a wider variety of IR-colours and are scattered over the IRAS colour-colour diagram as a consequence.
These large-scale mid-IR surveys were, however, only useful for Galactic post-AGB stars because the resolution and sensitivity remained too limited to study objects in the LMC. The Spitzer (Werner et al. 2004) Surveying the Agents of a Galaxy’s Evolution (SAGE) project for the first time allows a global study of the LMC at high enough spatial resolution and sensitivity to resolve individual objects at a range of mid-IR wavelengths. SAGE mapped a region of the LMC using the IRAC camera at wavelengths of 3.6, 4.5, 5.8 and 8.0 m (Fazio et al. 2004) and the MIPS camera at 24, 70 and 160 m (Rieke et al. 2004). The survey was performed over two epochs in 2005 separated by three months, to diminish the instrumental artefacts and trace the source variability. The details of the survey are described in Meixner et al. (2006). In total, over 6.9 million sources were detected with IRAC and about 40 000 with MIPS. In this paper, we use the SAGE second release data products (September 2009) that combines both visits of the survey. The Spitzer IRAC sources are band-merged with the Two Micron All Sky Survey (2MASS) in filters , and (1.24, 1.66, and 2.16 m) (Skrutskie et al. 2006) and can be found at the websites of the Spitzer Science Centre (SSC) and NASA/IPAC 111http://irsa.ipac.caltech.edu/data/SPITZER/SAGE/.
2.2 Colour criteria: optically bright post-AGB stars.
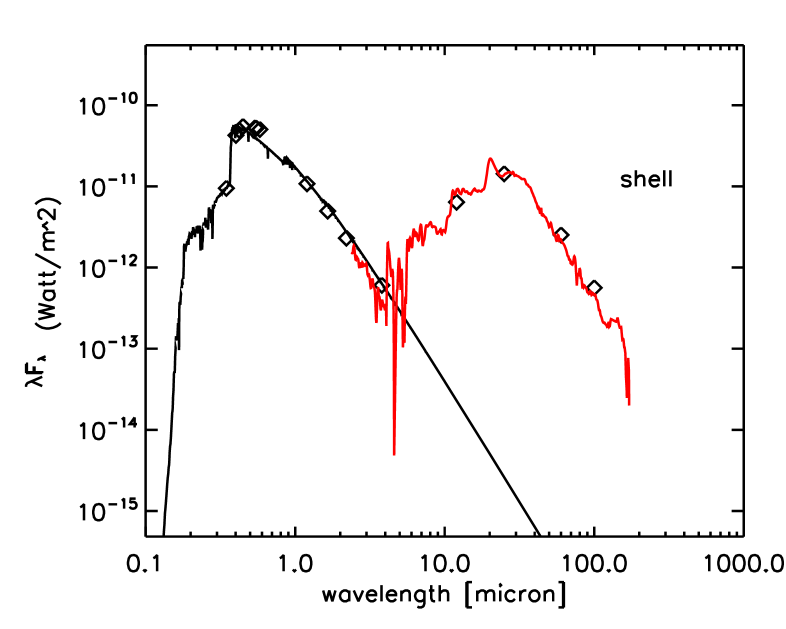
Based on the shape of their SED and more specifically on their behaviour in the near-IR, we can roughly divide the Galactic post-AGB stars into two distinct classes. The first one consists of objects with a double-peaked SED of which the peak at longer wavelengths corresponds to the emission of an expanding, detached shell of cooling dust and gas. This shell is the remnant of the AGB mass-loss. Depending on the strength of the circumstellar reddening, the central star is directly detectable at shorter wavelengths or obscured by the circumstellar material. Some Galactic post-AGB stars are strongly extincted by a strong equatorial density enhancement, or torus, in the CSE (e.g., Meixner et al. 1999; Ueta et al. 2000). These objects lack a direct photospheric contribution, and the SED is completely dominated by thermal emission of dust.
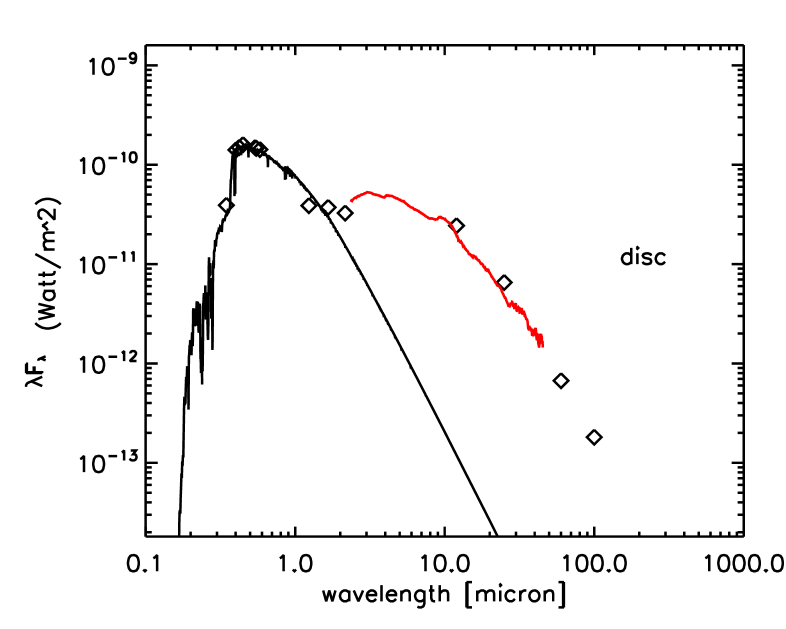
The SEDs of the second type of object show a broad excess with an onset in the near-IR, which indicates that there is still hot dust in the system. These SEDs are indicative of a disc rather than an expanding envelope (De Ruyter et al. 2006). Because these objects turned out not to be rare at all in our Galaxy (Van Winckel 2007), we incorporate their typical IR colours in our initial selection criteria.
In Fig. 1 we show some illustrative examples of Galactic post-AGB stars. In the upper panel, the SED of HD 56126, a carbon-rich post-AGB star (Van Winckel & Reyniers 2000) with a dust excess typical of a carbon-rich, expanding shell is displayed (Hony et al. 2003). The lower panel shows the SED of 89 Her, an optically bright post-AGB star surrounded by a compact disc. Around this object, an hourglass-shaped nebula has been detected in CO emission (Bujarrabal et al. 2007).
To select the candidate post-AGB stars in the SAGE catalogue, we adopted the following strategy. First we cross-correlated the epoch 1 and epoch 2 MIPS 24 m catalogues with a maximal position shift of 3″, and we only retained those objects that were detected in both epochs. For these sources, the average of both flux measurements was taken with the error corresponding to the standard deviation of both values with respect to this mean. We then selected all those objects with a valid 8 m detection from the IRAC archive catalogue and subsequently cross-matched the IRAC sources with the MIPS selection, again allowing a maximal shift of 3″ between the IRAC position and either MIPS position. When multiple matches were found, we only retained the closest one. At this stage we had 25 194 sources.
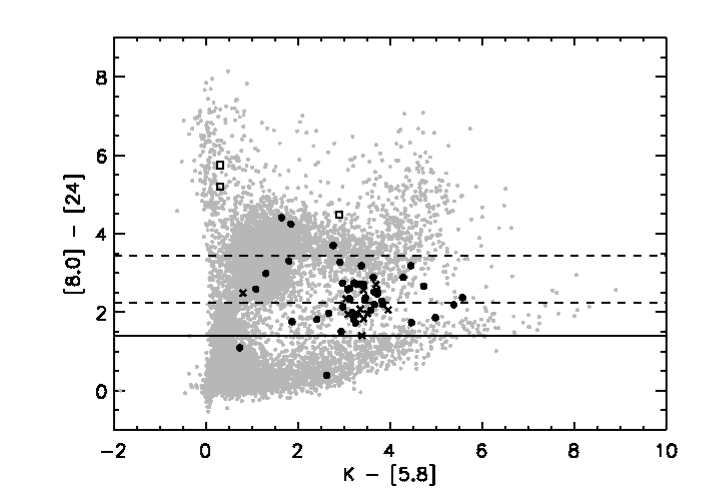
Next, we narrowed our sample by applying a colour selection inspired by what is known from Galactic sources. We transformed the SEDs of the known Galactic disc sources (De Ruyter et al. 2006) onto the filters of the IRAC and MIPS cameras and displayed them in a versus colour-colour plot (see Fig. 2). Evidently, the background SAGE data points bifurcate into two populations at 3 to 5 and 0 to 2. According to Blum et al. (2006), the former corresponds to mainly background galaxies while the latter consists of extreme AGB stars and red supergiants. The bulk of the known Galactic disc sources lies above this second branch, but overlaps with the first. Based on this figure, we impose that , with the flux at 24 m in mJy, or as a further selection criterion (the solid black line in Fig. 2). This way we select suspected shell sources, which have typically colder dust with , as well as disc sources and discard the branch at 0 to 2 which consists of extreme AGB stars and red supergiants. This colour criterion is deliberately meant not to be very restrictive, and 16 570 objects in our constructed SAGE catalogue fulfil these criteria.
The sample was subsequently cross-correlated with three optical catalogues using a search radius of 1.5″ from the IRAC position, and only retaining the objects of which an optical magnitude in the , , , or -filter was listed in at least one of the catalogues. We used Massey’s CCD survey of the Magellanic Clouds (Massey 2002), which covers a 14.5 deg2 region of the LMC, is complete to , and has a magnitude limit of 18 in . This cross-correlation brought forth 566 matches. The LMC stellar catalogue of Zaritsky et al. (2004) is more extensive than Massey’s: it covers the central 64 deg2 area of the LMC and is complete to with a magnitude limit of 23 in this filter. This database contained 6767 mutual sources with our selection. The third and final catalogue we used is the Guide Star Catalogue Version 2.3.2 (GSC2.3.2) (STScI, 2006) (Lasker et al. 2008), which is an all-sky database that is complete to magnitudes of with a magnitude limit of 20.5 in . The correlation with this catalogue resulted in 4759 common objects.
There are 7568 objects of our initial IR sample that are not cross-identified in the optical catalogues. The general trend in their SEDs suggests that this is mainly because they are too faint at optical wavelengths. Another 376 objects do occur in the optical catalogues, but have no listing of a , , , , or magnitude; most of these are found in the Guide Star Catalogue. After the removal of all objects without a listing of at least one of the required magnitudes, our total sample contains 8626 stars.
2.3 Luminosity-cut
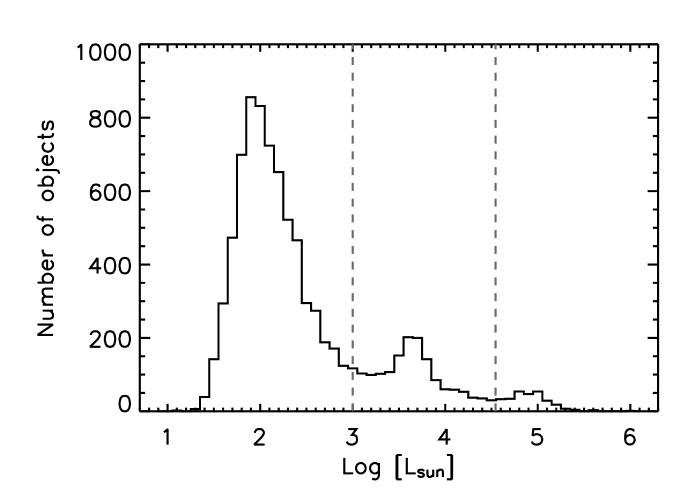
So far, all objects with an IR excess fulfilling the colour criteria and with optical photometry in one of the above three catalogues are selected. Obvious intruders in the sample are supergiants and YSOs, because these objects can also have a large IR excess. To refine our selection further we therefore imposed a luminosity criterion. Because we have no information on the spectral types of the different central objects, we simply integrated all flux in the system by fitting up to three black bodies (BB) to all available photometry without applying dereddening. To compute the luminosity from this total flux, we made use of a distance modulus of 18.54 (e.g., Keller & Wood 2006). The black-body curves were fitted using a minimisation and by imposing that the flux up to the J-band belongs to the photospheric emission represented by the first BB. When a single BB fails to reproduce the IR part of the SED as well, a second and eventually third component is added with ever decreasing temperature. To account for the lack of photometry at wavelengths lower than 3600 Å and to avoid fitting the Rayleigh-Jeans tail of the SED, we imposed an upper limit of 15000 K for the temperature of the hottest black body. This integral is a rough approximation of the true luminosity because it assumes spherical symmetry, the absence of ISM reddening, and an optically thin shell and imposes an upper limit to the photospheric temperature. A histogram of the results is given in Fig. 3.
The histogram of the calculated luminosities displays three clearly distinct peaks of which the luminosity values of the middle one agree with what we expect for the luminosity range of post-AGB stars based on the evolutionary tracks of Blöcker (1995): they range from 1000 to 35 000 (see Fig. 13). The peak at lower values corresponds to luminosities typical of bright YSOs, and we removed the bulk of them from the sample by introducing a luminosity-cut at 1000 . This is not a strictly exclusive condition: as can be seen in Fig. 3 we kept the tail of the first peak, and may consequently expect that some luminous YSOs are still present in our sample. Yet we attempt to construct a catalogue of optically bright post-AGB stars that is as complete as possible, so instead of removing practically all bright YSOs by introducing a higher lower-limit for the luminosity, we will eventually discard the remaining ones based on their spectra. The third peak at the highest luminosities corresponds to typical luminosities of supergiants. We disposed of the bulk of them by using a luminosity-cut at 35 000 . This corresponds to a of about 4.5 and is hence an upper limit for the luminosity of a 7 post-AGB star as has been computed by Vassiliadis & Wood (1993) and Blöcker (1995). After rejection of the objects of which the estimated luminosity does not fall within the predicted range for post-AGB stars, our sample still contains 1517 objects.
We list the candidate YSOs and supergiants in two catalogues that are available at the CDS and contain the following information. For each catalogue, Column 1 gives the name of the source, Columns 2 and 3 contain the right ascension and declination, Columns 4-7 list the magnitude and its error from respectively Zaritsky et al. (2004) and Massey (2002), the magnitudes and errors from these two catalogues and the Guide Star Catalogue (Lasker et al. 2008) can be found in Columns 8-13 and the magnitudes and errors in Columns 14-19. Columns 20-23 give the magnitude from Massey (2002) and the magnitude from (Lasker et al. 2008) with their errors, Columns 24 and 25 contain the magnitude and error from Zaritsky et al. (2004), and Columns 26-31 list the 2MASS , and magnitudes and errors. The 3.6, 4.5, 5.8 and 8.0 m IRAC fluxes and errors are given in columns 32-39 and the MIPS 24, 70 and 160 m fluxes and errors can be found in Columns 40-45. Column 46 lists the black-body-based luminosity.
2.4 MIPS 70 and 160 m data
A cross-correlation with the MIPS 70 and 160 m catalogues, SAGELMCfullMIPS70 and SAGELMCfullMIPS160, with a search radius of 3″ reveals that 220 objects in our sample have a detection at 70 m of which four are also listed in the 160 m catalogue. With these extra data points, it can be seen that the SED of six of these sources is monotonically increasing towards wavelengths redder than 70 m, which suggests that the bulk of the energy is radiated beyond this point. This is not typically seen in Galactic post-AGB stars, regardless of whether they have a disc or a shell SED. These objects are therefore probably either background galaxies or heavily obscured stars of another type, like YSOs with very cool optically thick dust. After their removal, our sample contains 1511 optically bright post-AGB candidates.
2.5 Subsamples
To assess the number of objects with a disc and those with a shell in our final sample, we introduced an upper limit of for the flux at 24 m for the former (see Fig. 2). This implies that the star emits more flux at 8 m than it does at 24 m, and hence the dust will be closer to the photosphere of the central star. A lower limit of for objects with a shell was already introduced in Sect. 2.2. We find that according to this extra cut, 665 objects are suspected to have a disc, 608 to have a shell and 238 objects fall in the grey zone where and no conclusion on their circumstellar geometry is possible based on these colour criteria. This shows that disc sources indeed form a significant fraction of the optically bright post-AGB stars with an IR excess. Note that we focus on objects detected in the optical, which means that heavily obscured post-AGB stars will be missing in our sample.
3 Spectral information
The colour and luminosity criteria we used are not very restrictive, so obviously not only post-AGB stars will occupy the sample. Similar IR colours can be detected from, amongst others, background galaxies, compact H II regions, PNe, luminous YSOs and some remaining supergiants, as well as foreground stars.
We therefore cross-correlated our sample of post-AGB candidates with catalogues of other known types of objects and obtained low-resolution, optical spectra of the brighter stars. This allowed us to eliminate these objects and to make an initial study of those which appear to be post-AGB stars.
3.1 Other known types of objects
Some objects in our sample have been studied before and are known not to be post-AGB stars. Many catalogues of other types of objects in the LMC exist, based on either colour criteria, the presence of certain features on photometric plates, or spectra in the infrared or the optical. We scanned the literature for publications that give spectral types of LMC objects that agree with the spectra taken by us (see Sect. 3.2) if these exist for some of the objects both catalogues have in common. Some other catalogues we could find are referenced in our final catalogue of post-AGB candidates (see Sect. 5.1 and Appendix A).
Only three catalogues of LMC objects fulfilled these strict criteria: the list of massive stars of Bonanos et al. (2009), the catalogue of cool carbon stars from Kontizas et al. (2001), and the list of AGB stars classified by Trams et al. (1999). Kontizas et al. (2001) detected 7760 carbon stars based on their strong Swan bands, the presence of which indicates that the stars are too cool to be post-AGB stars and hence must be still on the AGB. We unknowingly obtained spectra for two of these and a comparison of this type of carbon star with two genuine post-AGB carbon stars can be found in Sect. 3.2.1. Our sample contains 43 cool carbon stars, which are discarded.
Of the 57 objects classified as AGB stars by Trams et al. (1999), seven are part of our sample. For only three of these, the AGB status is confirmed by optical spectra: we found two additional cool carbon stars and an AGB star with spectral type M5e. These three objects were removed from our sample.
Twenty-four post-AGB candidates are listed in the catalogue of 1750 massive stars of Bonanos et al. (2009), of which 23 are reconcilable with a post-AGB star. Nineteen of these belong to the subclass of O and early B stars, three are B[e] or Be stars and the last source has a spectrum similar to an Of/Of?p object. The remaining object is a possible X-ray binary and is removed from our sample of post-AGB candidates. No luminous blue variables, Wolf-Rayet stars, or red supergiants were found. Our sample now contains 1464 optically bright post-AGB candidates.
3.2 Low-resolution optical spectra
In addition to this literature study, we obtained low-resolution, optical spectra of the brighter stars in our sample. So far, we have spectra for 105 of the brightest objects. The bulk of these spectra were obtained with the ANU 2.3 m telescope at the Siding Spring Observatory (SSO) in Australia during the fall of 2007 and the spring and fall of 2008. The spectra were obtained using the Dual Beam Spectrograph at a resolution of 4 Å from 3300 - 9500 Å. In some cases only the red arm of the spectrograph was used at resolution of 8 Å from 5300 - 10 000 Å. These 87 spectra of 86 objects were reduced following the standard recipes for long-slit spectral reduction.
An additional 28 spectra of 24 objects were observed at SAAO with the 1.9 m Radcliffe telescope in late 2007, using the grating spectrograph with grating 8 in the red (6400 - 9200 Å) with resolution 4 Å or with grating 7 in the blue (3200 - 7200 Å) with resolution 5 Å. Most stars were only observed in one region. The spectra were reduced with IRAF, again according to the standard recipes.
The spectra were classified on the MK system, using the published spectra of Jacoby et al. (1984) as templates. For the objects observed at SAAO, we had a library of standard stars that were observed with the same instrumentation. The red SAAO spectra have fairly even sensitivity with wavelength, and the strengths of the classification features were measured. The dependence of these strengths on spectral type and luminosity class was established from the spectral type standards observed with the same instrument, and hence this subset of our LMC spectra were classified in a semi-quantitative way as well as by direct comparison with standards. The S/N of the blue SAAO spectra declines severely towards shorter wavelengths in the case of stars of type G and later, so that some features were of very low S/N or even missing. Classification of the blue SAAO spectra, as well as of the SSO spectra for which we did not have a set of standard stars taken with the same instrumental setup, was by visual comparison of the spectra with those of the standard stars. For galaxies, non-membership of the LMC was confirmed by a too high radial velocity.
The low-resolution, optical spectra allow us to eliminate certain objects from the sample and enhance the probability that the remaining objects are indeed post-AGB stars. Of the 105 observed objects in our final sample, only 13 are rejected because they clearly cannot be post-AGB stars. We identified nine galaxies, two PN-like objects and two WC-like objects. These objects are discribed in Appendix C. The remaining 92 objects are good post-AGB candidates and their spectra are discussed here.
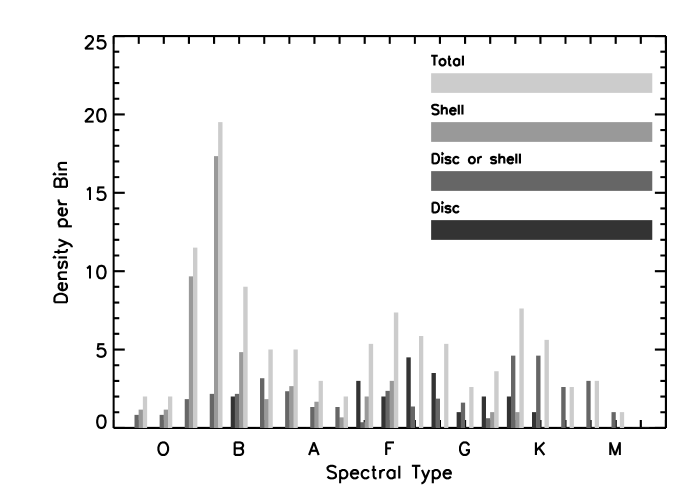
The 92 spectral types determined by us together with the 23 additional spectral types from Bonanos et al. (2009) (see Sect. 3.1) cover a range conforming to what we expect from post-AGB stars. We detect all spectral types from late O to mid M, with number density peaks at B, F and K that correspond to shell sources, disc sources, and the group of objects in between (see Fig. 4). The spectral types of the disc sources range from F to mid K with two additional mid B[e] stars from the catalogue of Bonanos et al. (2009), while those of the objects with a shell span the entire range from O to early K with number density peaks among the earlier spectral types. The group of objects of which the SED shape does not allow us to conclude on the circumstellar environnement, cover all spectral types from O to M with a slight peak around the later types. For five objects some puzzling features in the spectra prevent us from determining the correct spectral type. Furthermore, we detect three carbon stars that remain good post-AGB candidates, and 23 objects with emission lines in their spectra. Both of these latter two groups of objects will now be discussed in more detail.
3.2.1 Carbon stars
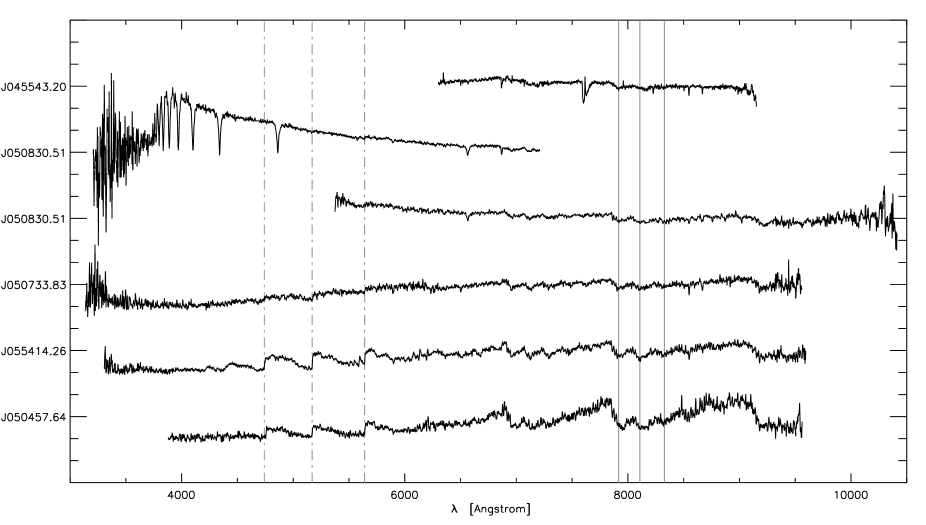
We confirmed the spectral type of the known C-rich RV Tauri star J045543.20-675110.1 (Pollard & Lloyd Evans 2000) and found two new carbon stars – J050733.83-692119.9 and J050830.51-692237.4 – with strong bands at 7910, 8100 and 8320 Å in their spectra (see Fig. 5). In J050733.83-692119.9, these bands and the bands of and at shorter wavelengths are weaker than in the spectra of the two AGB stars – J050457.64-670511.9 and J055414.26-684020.4 – from the catalogue of Kontizas et al. (2001) (see Sect. 3.1), for which we have spectra. The bandstrengths are comparable with those in J045543.20-675110.1, the C-rich RV Tauri star, which is consistent with its status as a candidate post-AGB star of higher effective temperature than these AGB stars.
The red bands in the spectrum of J050830.51-692237.4 are of a similar strength as those in J050733.83-692119.9, but the carbon-star features become progressively weaker at shorter wavelengths as the spectrum rises steeply to the blue, as seen in Fig. 5. The strong bandhead at 5635 Å is visible, though relatively weak, on the Siding Spring spectrum. The blue SAAO spectrum shows the band structure of the carbon star only at the extreme red end, near 7100 Å. is prominent in absorption and the blue spectral region shows only the spectrum of an A0-1IV star. These spectra thus appear to be of two different stars. The assigned luminosity class of the A star suggests that this is a Galactic foreground star, but the radial velocity of more than 200 km/s indicates LMC membership. The uncertain contribution of this star to the spectra prevents a decision as to whether the carbon star is an AGB star or a likely post-AGB star.
| Object Name (IRAC) | Type | |
|---|---|---|
| J045543.20-675110.1 | -5.1 | G2-8(R)Ibe: |
| J050457.64-670511.9 | -4.7 | C-J: |
| J050733.83-692119.9 | -3.6 | C |
| J050830.51-692237.4 | -4.8 | C |
| J055414.26-684020.4 | -4.0 | C |
The bolometric magnitudes, derived from the luminosities calculated in Sect. 2.3, and types of the five carbon stars are given in Table 1. The J classification of J050457.64-670511.9 is uncertain because the S/N at the diagnostic features is low. A comparison of these bolometric magnitudes with the observational carbon star luminosity function as published by Marigo et al. (1999) shows that two of these objects occur at the low-luminosity end and three are near the peak of this distribution, which extends from approximately up to , with the peak located at about (centre of the bin).
The three carbon stars that remain in our sample – J045543.20-675110.1, J050733.83-692119.9 and J050830.51-692237.4 – belong to the subgroup of post-AGB candidates of which the shape of the SED does not allow us to conclude on whether they have a disc or a shell. Carbon-rich Galactic post-AGB stars are mainly associated with shells (e.g., Kwok et al. 1989), while Galactic RV Tauri stars with circumstellar dust generally have circumstellar discs (e.g., Lloyd Evans 1995, 1997; Van Winckel et al. 1999; Gielen et al. 2007).
3.2.2 Post-AGB candidates with an emission-line spectrum
Twenty-three objects display emission lines in their spectrum. The spectral type of these objects ranges from O to F-G, although for some objects the peculiarity of their spectrum did not permit us to determine the appropriate type. In Table 2 we summarise some of the most prominent features and Table LABEL:table:prinfeat_em lists the principal features in the spectra of J045433.85-692036.2, J045729.38-661837.3, J054034.00-692509.8, J051525.45-661905.0, and J060323.20-680437.5, the five objects with the most emission features, and their identification.
Two objects – J054034.00-692509.8 and J045433.85-692036.2 – display the B[e] phenomenon in their spectra: they have strong Balmer emission lines in combination with many emission lines of Fe II and [Fe II], as well as of [O I] (Lamers et al. 1998). Our initial colour selection criterion already implies that these stars have a strong near- or mid-IR excess due to hot circumstellar dust, the fourth diagnostic feature of a B[e] star. J045729.38-661837.3 has many Fe II emission lines, but only six possible [Fe II] lines, of which four are unblended with Fe II lines, which renders its status as a B[e] star doubtful. The strength of the [O I] emission in these three stars increases markedly with increasing [Fe II]/Fe II.
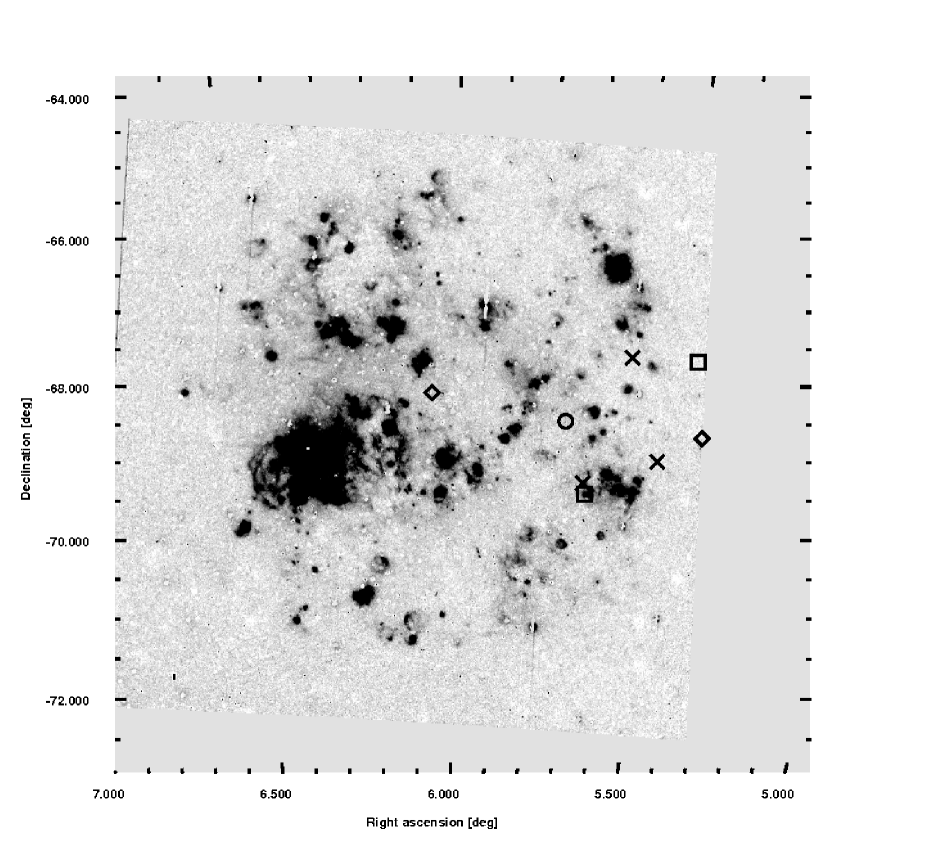
Some of the emission-line spectra have the [O III] feature at 4959 and 5007 Å present, either in emission or absorption. The latter must arise from excess sky-subtraction of emission from a surrounding emission nebula. Given especially that one of our problems is to distinguish between young stars, which would probably tend to lie within emission nebulae, and much older, randomly distributed stars, we overplotted all post-AGB candidates with an emission-line spectrum on an image of the LMC from Kennicutt et al. (1995). The result of this can be seen in Fig. 6. Fifteen objects fall out of the spatial range of the image and are therefore not shown. Of the remaining eight, two objects display the [O III] feature at 4959 and 5007 Å in absorption and one of these – J054412.04-682727.9 – is located in an area where diffuse emission is present. This object therefore lies in a starforming region and is likely a YSO. We also marked the positions of all objects for which the spectrum did not cover the spectral range around the [O III] feature, but none of these seem to lie in a region where is present.
Fifteen of the 23 emission-line stars are excluded from the final post-AGB sample because their SED-based final luminosity (see Sect. 4.2) is higher than 35 000 . These objects are noted in Table LABEL:list_delobj. The remaining eight emission-line stars fall in the luminosity range of post-AGB stars and are listed in Tables 7, 8 and 9. For each emission-line object, the respective table in which it can be found is cited in the final column of Table 2.
| Object | O I | [O I] | [O II] | [O III] | He I | [S II] | [S III] | [N II] | Ca II | Pa | Notes | |||||||||
| 7774 | 8446 | 3727 | 7319 | 5876 | 6678 | 9069 | ||||||||||||||
| J044555.34-705041.7 | e5 | e3 | e2 | e2 | 0 | a4 | e2 | e1 | - | 0 | e1 | 0 | 0 | 0 | 0 | 0 | e3 | e2 | a2 | 9 |
| J044904.66-690455.0 | e4 | - | - | - | - | 0 | e1 | 0 | - | 0 | - | 0 | 0 | 0 | 0 | 0 | e1-2 | 0 | a1: | LABEL:list_delobj |
| J044943.46-691955.3 | e4 | - | - | - | - | 0 | e2 | 0 | - | 0 | - | 0 | 0 | 0 | 0 | 0 | 0 | 0 | 0 | LABEL:list_delobj |
| J045433.85-692036.2 | e5 | e3 | e2 | e2 | e2 | a2 | e1 | e2 | 0+: | 0 | 0 | 0 | 0 | 0 | 0 | e1-2 | e3+ | e1+ | e2 | LABEL:list_delobj, B[e] |
| J045729.38-661837.3 | e5 | e3 | e2P | e2P | a1 | e2 | e4 | e1 | 0 | 0 | 0 | 0 | 0 | 0 | 0 | e1: | e1-2 | e2+ | 0 | LABEL:list_delobj |
| J050338.93-690158.6 | e3 | a2 | a++ | a++ | a1: | 0 | 0 | 0 | - | 0 | 0 | 0 | 0 | 0 | 0 | 0 | e2 | 0 | a2 | 9 |
| J050431.84-691741.4 | e4 | e1P | a3 | a3 | a1: | a2 | e1-2 | e1: | 0 | 0 | 0 | 0 | 0 | 0 | 0 | e1: | e2 | 0 | a2 | 9 |
| J050451.70-663807.5 | e4+ | e3 | e2 | e1 | 0 | e1 | e4 | e1 | - | 0 | 0 | 0 | 0 | 0 | 0 | 0 | e1: | e2-3 | 0 | LABEL:list_delobj |
| J050535.21-685928.9 | e3 | - | - | - | - | a1 | e0+ | 0 | - | 0 | - | e1 | e1 | 0 | 0 | e1 | 0 | 0 | 0 | LABEL:list_delobj |
| J051123.63-700157.4 | e6s | e4 | e3 | e2 | 0 | 0 | e2 | e3 | e3 | e3 | e5 | e4 | e2-3 | e1 | e4 | e3 | 0 | e2 | 0 | 9 |
| J051333.74-663418.9 | e3 | a2 | a2 | a2 | a4 | a2 | 0 | 0 | 0 | 0 | 0 | e3 | e1-2 | 0 | 0 | e1-2 | a5b | a2 | a3 | 7 |
| J051525.45-661905.0 | e4-5P | e3P | a3 | a3 | e0+ | 0 | e2 | 0 | 0 | 0 | 0 | 0 | 0 | 0 | 0 | 0 | e3 | e1-2 | 0 | 8, S/N |
| J051648.08-692222.0 | e3 | - | - | - | - | 0 | 0 | e1: | - | 0 | - | 0 | 0 | 0 | 0 | e0+ | 0 | e1: | a1: | LABEL:list_delobj, S/N |
| J052031.12-680057.2 | e2 | - | - | - | - | 0 | e1 | - | - | 0 | - | - | 0 | 0 | 0 | 0 | 0 | e1 | - | 8, Pa |
| J052131.77-682058.8 | e4 | - | - | - | - | 0 | e1 | 0 | - | 0 | - | e1 | 0 | e1 | 0 | e1: | e1: | 0 | 0 | LABEL:list_delobj |
| J052414.62-684110.0 | e5s | e3 | e2 | e1 | 0 | 0 | e3 | 0 | 0 | 0 | 0 | 0 | 0 | e1 | 0 | e2-3 | 0 | 0 | 0 | 8 |
| J052630.65-674036.6 | e5s | e4P | e3 | e2 | a2? | 0 | e3 | 0 | e4 | e2 | a3 | 0 | 0 | e2 | e3-4 | e3 | e2 | e1 | a2 | LABEL:list_delobj |
| J053017.49-685926.6 | e2 | - | - | - | - | 0 | 0 | 0 | - | 0 | - | e1: | 0 | 0 | 0 | e1 | 0 | 0 | a1 | LABEL:list_delobj |
| J053539.76-673705.0 | e4-5s | - | - | - | - | 0 | 0 | 0 | - | 0 | - | e1+ | e0-1: | e1 | e2 | e1 | 0 | 0 | 0 | LABEL:list_delobj, S/N |
| J054034.00-692509.8 | e5s | e3 | e2 | e2 | 0 | 0 | e4 | e3 | e4 | e1 | a3 | 0 | 0 | e2 | 0 | e3 | e3 | e1 | 0 | LABEL:list_delobj, B[e] |
| J054055.84-691614.5 | e5s | - | - | - | - | 0 | e1 | 0 | - | 0 | - | 0 | 0 | e1 | e3 | e4 | 0 | 0 | 0 | LABEL:list_delobj |
| J054412.04-682727.9 | e4-5 | e3 | e1-2 | 0 | 0 | 0 | e2 | 0 | e2 | 0 | e1-2 | e1: | e1 | e1 | 0 | e1 | e2 | e1: | e1: | LABEL:list_delobj |
| J060323.20-680437.5 | e4-5 | e3 | e1 | a1 | 0 | 0 | e3 | e1: | 0 | 0 | 0 | 0 | a1 | 0 | 0 | 0 | e2 | e2 | 0 | LABEL:list_delobj |
4 Analysis of the sample
4.1 Spectral energy distributions
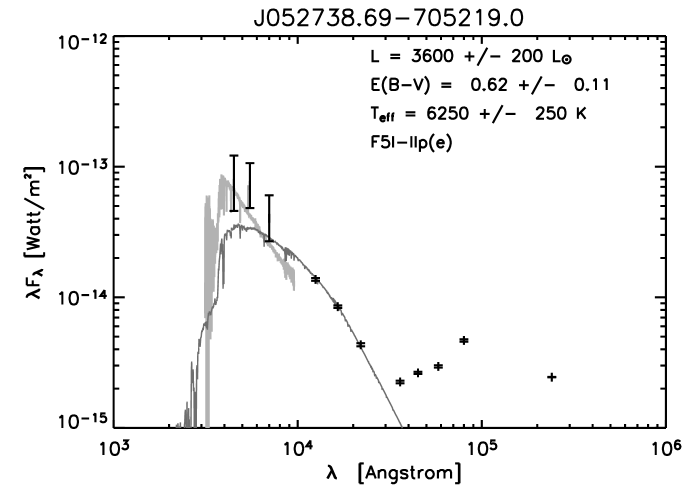
Using the spectral types we obtained from the low-resolution optical spectra and the literature, we are able to constrain the appropriate atmosphere models for the different objects and hence determine their total reddening. We assumed that the ISM reddening law can be used to approximate the total (circumstellar + ISM) reddening. The luminosities were then computed by integrating the appropriate stellar model that fits the dereddened optical photometry. With a small adaptation of the procedure, we were able to estimate these parameters for the sources without known spectral type, too. The luminosities allow us to determine the positions of the different objects in the HR diagram and lend us a view on their evolutionary stage by comparison with the evolutionary tracks of Blöcker (1995).
4.1.1 Objects with known spectral type
We developed a method based on a Monte Carlo simulation to minimise simultaneously for the effective temperature as well as for the total reddening of the star for objects of which the spectral type is known. This results in better values for the luminosity than was possible with black-body fitting (Sect. 2.3) and estimates of the effective temperature and total reddening of these objects.
For each object, we only allowed models within a certain temperature range constrained by the spectral type (Schmidt-Kaler 1982). The effective temperatures of all models that were used in the routine range from 3000 up to 10 000 K in steps of 250 K, from 10 000 up to 13 000 K in steps of 500 K, from 13 000 to 35 000 K in steps of 1000 K and from 35 000 up to 50 000 K in steps of 2500 K. For atmosphere models with effective temperatures higher than or equal to 3500 K, we used Kurucz models with a metallicity of (Kurucz 1979, and updates). The models we utilised for the range of from 3000 to 3250 K were MARCS-models with metallicity (Gustafsson et al. 2008). The metallicity of the stars in the LMC span the large range from [/] up to [/] (Geisler et al. 2009). Lower metallicity objects will be brighter than the models, especially in the UV, but our data are not good enough to constrain this parameter. The same holds true for , which was also not a free parameter. We only used one gravity for each temperature and chose log to be as low as possible within the model grids. It ranges up from 1.0 in steps of 0.5 for the coolest models and does not go above 2.0 for stars with a spectral type cooler than B.
The best model is determined by minimising the between the scaled atmosphere model and the dereddened photometric data. We assume that the photometry is dominated by the photosphere only up to 2.5 m. This is a compromise between retaining enough data points to do the minimisation procedure and the fact that at wavelengths longer than 1.3 m, the thermal radiation of the circumstellar material may dominate already in case of disc objects. The spectra themselves were left out of this process since the uncertainty on their absolute flux level is evaluated to be too large. If other photometric data were available, the magnitudes from the Guide Star Catalogue were not used in the procedure, because of their larger errors and sometimes significant difference from magnitudes found in the other two optical catalogues. This procedure allows us to determine the appropriate value of luminosity, effective temperature and total reddening.
The corresponding errors for those parameters – luminosity, effective temperature, and total reddening – were computed by use of the Monte Carlo Method. We constructed 250 alternative photometric datasets by using a Gaussian distribution of the errors on the photometric points and repeated the procedure described in the previous paragraph for each of these datasets. This yielded 250 possible models from which we removed the ones without convergence. For about 26 % of the objects, the solutions cluster in two distinct groups. In case of a bimodal distribution around two significantly different temperatures, we only retained the group of models with temperatures around the one found for the original photometry.
Finally, the errors on the different parameters were computed as the standard deviation of the remaining solutions with respect to the values based on the original photometry. For the temperature, a minimal error equal to the maximal gridstep at that temperature was taken into account because the models were not interpolated onto a finer grid.
There was one exception to this minimisation process: the photometric data of J050830.51-692237.4 are dominated by the stellar photospheres of two stars, which is why we only used the data up to 8000 Å in the minimisation.


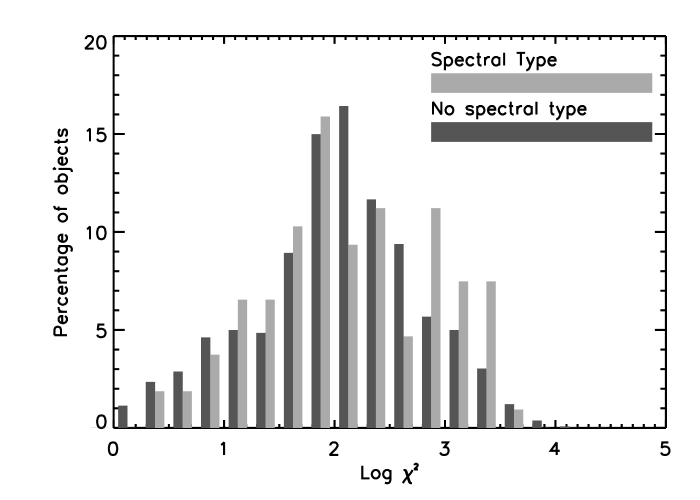
This minimisation procedure renders very convincing SED fits (e.g., Fig. 7). In Fig. 8 the histogram in light grey shows the distribution of the reduced values of the final models for all post-AGB candidates with known spectral type. Note that the reduced are still high because the quoted formal errors on the photometric data are fairly small. Because these are not the main contributors to the differences between the model and the dereddened photometric data, this does not imply the quality of our fits is low: e.g., the objects in Fig. 7, which yield convincing SEDs, have reduced values of 104 and 70 respectively.
For objects with spectral types from O to B, the errors we find on the different parameters are large, owing to the lack of photometric data at wavelengths below 3600 Å, where still a significant part of the luminosity is radiated. For all other objects most parameters are fairly stable, but the calculated values of the luminosities remain very sensitive to changes of the atmosphere model, the value of , and the variability of the photometry. A full catalogue of all SEDs can be found in Appendix D.
4.1.2 Objects without known spectral type
We broadened this method for objects without known spectral type by allowing the entire grid of atmosphere models to be used in the minimisation procedure. The best fit will then yield both an estimate of the effective temperature of the central star and the total reddening. Without spectral information, the SED minimisation procedure is, however, very degenerate. To assess the reliability of such a method, we let this broader procedure run on all objects of which we know the spectral type. We then compared these results with the ones we obtained when taking into account the spectral types.
We find that 41 % of the objects fall into the temperature range predicted by the spectral type. The effective temperatures of 73 % of the post-AGB candidates differ by less than 25 % and of 83 % by less than 50 % from our original solution. The large differences in the temperatures with and without use of the spectral type for the remaining 18 objects (17 % of the total number) are mainly because we lack data at wavelengths below 3600 Å, and the existing photometry of these objects is unable to prevent models with a higher temperature than follows from the spectral type from being chosen.
Changes in the adopted value of impact on the model parameters, because an atmosphere model with a higher temperature typically needs a higher reddening value to fit a given dataset. Small differences in the temperature of the atmosphere model require relatively large changes of the colour excess, which indicates that this parameter will be less stable than the model temperature. We find that 46 % of the reddening values are still in the error interval found with the use of the spectral types, as could be expected from the similar number of good matches in temperature. Only 55 % and 66 % differ, however, respectively less than 25 % and 50 % from this original solution for . For the remaining 34 % of the objects the colour excess changes even more owing to the reasons indicated above and the fact that for low reddening values, a large relative error can correspond to a fairly small absolute error.
As the reddening is more poorly constrained, the results are even less stable for the computed luminosity. Again the objects with an early spectral type are most affected. While the bulk of their luminosity is radiated at wavelengths below 3600 Å, our lack of photometry at these wavelengths allows a broad range in possible atmosphere models and hence luminosities. However, we still find that 47 % of the values fall inside the 1 errors of the original luminosity estimate, 50 % differ less than 25 % from this original solution and 67 % less than 50 %. For 33 % of the objects the difference is bigger.
We can conclude that for about 40 % of the objects, values for the effective temperature, colour excess, and luminosity can be found that fall inside the 1 error interval on these parameters computed when taking into account the spectral type, despite the fact that spectral information on the central source is missing. The temperature is restricted the best in general, followed by the value of . The computed value of the luminosity remains the most uncertain because of its great dependence on the other two parameters. The results are the least reliable for objects with an early spectral type because of the lack of photometric data at short enough wavelengths.
We applied this broader version of our minimisation procedure to the total sample with unknown spectral type. In Fig. 8 we depict a histogram of the reduced values in dark grey. The histogram is very similar to the histogram obtained for objects with spectral types for objects with , which shows that there is no systematic difference. The smaller relative number of objects without a known spectral type at stems from the fact that the effective temperature is an additional free parameter in these cases, unlike for the objects with known spectral type. The dip in the distribution of the latter at is simply caused by a binning effect and by the much smaller number of objects in this group when compared to the former.
4.2 Final luminosities
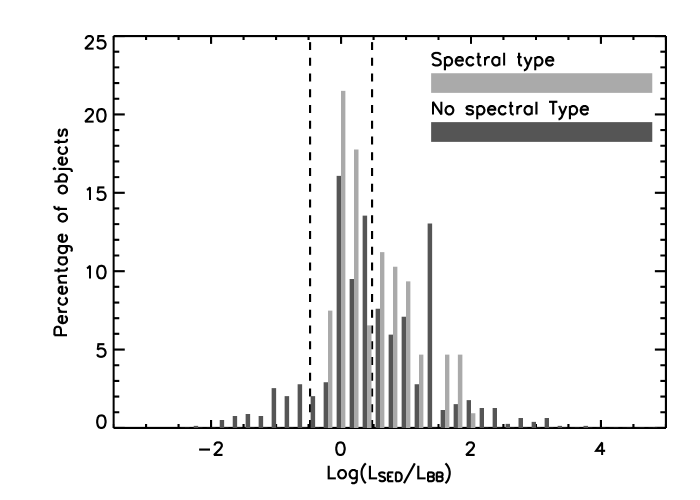
We now have two luminosities for all objects: the one calculated in Sect. 2.3 where we fitted up to three black bodies to the raw photometry (the ’black-body-based luminosity’ below) and the one from Sect. 4.1 based on the integral of the stellar model, which is scaled to the dereddened photometric values (the ’SED-based luminosity’ below). The latter luminosity calculation is the most reliable in most, but not all, cases because it is a better approximation of reality. In Fig. 9 we show the ratio of the luminosities determined by our preferred method to the black-body-based ones. There is a peak in the histogram corresponding to a ratio of 1.0, and 42 % of the data lie in between and 3.
For some objects with a known spectral type, the SED-based luminosities tend to be significantly higher than the black-body-based ones. These objects are without exception of an early spectral type. The maximum temperature of 15 000 K for the hottest black body in the luminosity fit we imposed in Sect. 2.3 because of the lack of data at wavelengths below 3600 Å can account for this difference. We therefore favour the higher SED-based luminosities for all objects with a known spectral type.
For the sources without spectral information, the situation is a bit more complicated. If there are enough photometric data to describe the photosphere well, the SED-based luminosity is likely to be better than the one based on the black-body fit. Our minimisation procedure has, however, two important shortcomings.
First of all, the lack of photometric data at wavelengths below 3600 Å implies that atmosphere models with a too high effective temperature can be chosen as the best fit. For these models, the available photometry only samples the Rayleigh-Jeans tail of the SED, which is obviously not very constraining and leads to a generous overestimation of the luminosity and total reddening. The luminosity thus remains poorly constrained for hot central stars, and we prefer the black-body-based luminosity, as calculated in Sect. 2.3. Especially for shell sources, this effect is noticeable (see Fig. 10). This type of object will only appear in our optically bright sample when the circumstellar envelope is sufficiently diluted by expansion. Given the very fast evolutionary timescales of the central star, the shell sources will therefore have hotter central stars on average. For the disc sources, the timescale is more difficult to compute because it depends on the lifetime of the compact discs, which is yet to be constrained. It is possible that disc evaporation is stimulated by the heating of the central star, which causes the object to disappear from our selection. The disc sample will therefore contain cooler central stars, on average.
We chose to use the SED-based luminosity only if the temperature of the final atmosphere model is below 17 000 K. For all cooler objects, either the bulk of the luminosity is radiated at wavelengths redder than 3600 Å, or the Balmer jump is prominent enough to confine the atmosphere model. It turns out that for 406 or 31 % of the objects without a spectral type, an effective temperature of at least 17 000 K is deduced from our fitting procedure. Hence for these objects, the black-body-based luminosity was used.
The second problem we encounter is that our method based only on photometry does not deal well with high reddening. The assumption that the interstellar extinction law is a good representation of the total reddening in the line of sight towards the photosphere is unproven and can accordingly cause problems when the extinction is dominated by the circumstellar component. We therefore discard all SED-based luminosities if the final atmosphere model has an that exceeds the arbitrary value of 1.5. This is the case for 215 or 16 % of the objects without a spectral type.
Next to the shortcomings of our minimisation procedure, the photometry itself is in some cases incapable of indicating a preferred model. We consequently also discard the SED-based luminosity if it is lower than its error. This occurs for 133 objects or 10 % of the objects without a spectral type.
In total, we used the black-body-based luminosity for 659 objects or 50 % of the objects without known spectral type.
For some objects, the SED-based luminosity estimate is higher than the upper limit of 35 000 we introduced in Sect. 2.3. This is the case for 69 objects of which 44 have a known spectral type. An additional 113 objects without a spectral type have an SED-based luminosity below 1000 . Because of the big uncertainty in the different parameters calculated by fitting an atmosphere model to the dereddened photometry for objects without a known spectral type, we decided to leave these 138 objects in the final sample and changed their luminosities back to the original values based on the black-body fit. The 44 objects with known spectral type that fall out of the imposed luminosity range were removed from our catalogue and can be found in Table LABEL:list_delobj.
Our final catalogue now contains 1407 objects. It is available at the CDS and contains the following information. Column 1 lists the name of the source, Columns 2 and 3 give the right ascension and declination, the source type based on the shape of the SED can be found in Column 4, Columns 5-8 contain the magnitude and error from respectively Zaritsky et al. (2004) and Massey (2002), the magnitude and error from these two catalogues and the Guide Star Catalogue (Lasker et al. 2008) is listed in Columns 9-14 and the magnitude and error in Columns 15-20. Columns 21 and 22 gives the magnitude and error from Massey (2002), Columns 23 and 24 the magnitude from (Lasker et al. 2008) and its error, Columns 25 and 26 contain the magnitude and error from Zaritsky et al. (2004) and Columns 27-32 give the 2MASS , and magnitudes and errors. The 3.6, 4.5, 5.8 and 8.0 m IRAC fluxes and errors are listed in columns 33-40 and the MIPS 24, 70 and 160 m fluxes with their errors can be found in Columns 41-46. Column 47 lists the black-body-based luminosity, Columns 48-53 contain the SED-based luminosity, effective temperature, and reddening with their respective errors and Column 54 gives some remarks on cross-correlation with catalogues of other types of objects (see Sect. 5.1). We also list the spectral type in Column 55 and variability information (Column 56), when these data are available.
4.3 Luminosity distribution
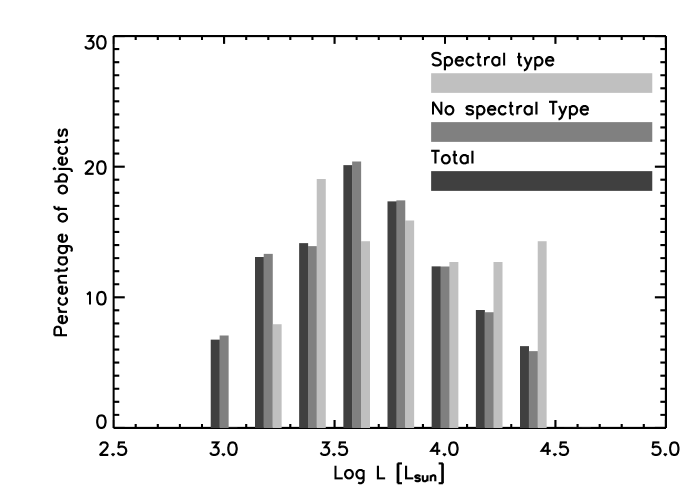
In Fig. 11 we show the histogram of all final luminosities while distinguishing between objects with and without a determined spectral type. The distribution of the total sample is also shown. As expected, we see a peak in the luminosity distribution of the total sample around the middle of the imposed luminosity range. The anticipated bias towards lower-mass objects and hence lower luminosities, due to their slower evolution and higher number density as predicted by the initial mass function, is also observed. The histogram drops slowly towards higher values of the luminosity, suggesting that the luminosity-cut we introduced to discard supergiants is effective. Some AGB stars are, however, probably still polluting the sample towards the high-luminosity range. Towards lower luminosities, a steeper drop can be observed. This indicates that also the luminosity-cut intended to remove YSOs is probably effective, although some bright YSOs and objects on the upper part of the Red Giant Branch (RGB) with circumstellar dust might still be contained in the sample.
When we compare the histograms of the objects with and without a known spectral type, it is clear that so far, the emphasis of our observations has been on visually brighter stars. A full spectral survey of all objects is needed, however.
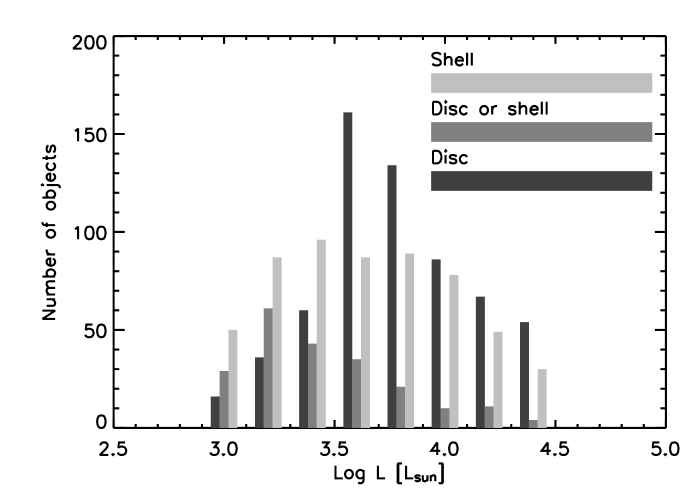
In Fig. 12 we compare the luminosity distributions of the three different subsamples based on the shape of the SED. Obviously the histograms of both the objects with a disc and those with a shell span the luminosity range we observed for the entire sample and therefore represent a wide range of different initial masses. The distinction between both types of objects is more easily made at higher luminosities, as can be seen from the distribution of the objects for which the type of SED is undecided: at higher luminosities, the number of objects in this group becomes relatively small compared to the number of objects in the other two. The distribution of objects with a shell seems to be more constant over the entire luminosity range with possibly a small peak towards the lower values, while the sources with a disc display a clear peak in the middle of the luminosity range. This implies that objects with a shell are slightly more abundant at low luminosities while post-AGB candidates with a disc lie at average luminosities. Both are equally represented at high luminosities. However, this effect at low luminosities may also be partly introduced by the pollution of our sample with YSOs, which will mainly fall in our shell class because YSOs have a typical peak in their SED at wavelengths longer than 24 m.
4.4 HR diagrams
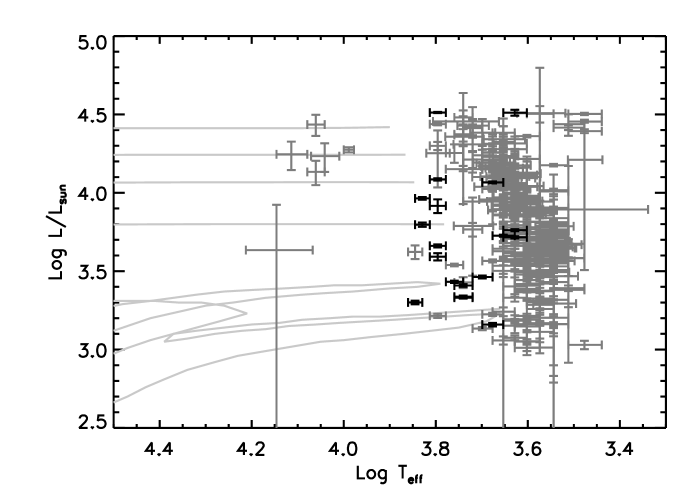
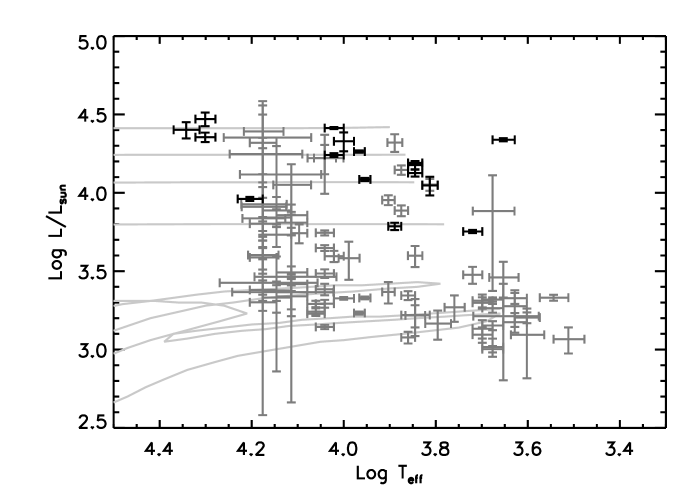
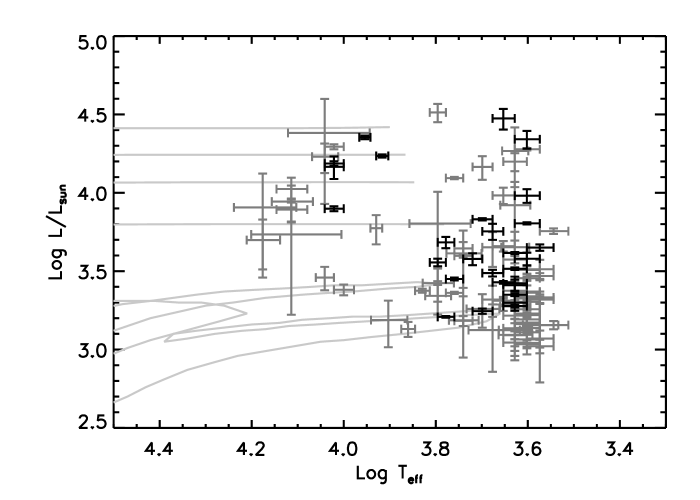
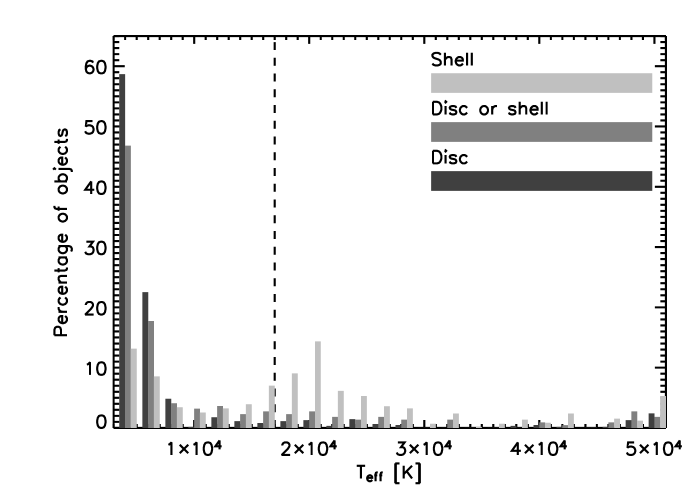
In Figs. 13, 14, and 15 we show the position in the HR diagram of all post-AGB candidates for which the final luminosity was computed based on the integral of the stellar atmosphere model that was scaled to the dereddened photometric values (Sect. 4.1). To increase the clarity of the plot, we distinguish between the different shapes of SED. The reliability of the displayed temperatures is only limited because we used atmosphere models with effective temperatures up to 50 000 K for objects with a known spectral type and only retained solutions based on models with a maximum temperature of 17 000 K for sources without.
We can, however, conclude that the post-AGB candidates with a shell as well as those with a disc show a large spread in temperatures and that on average, disc candidates show a lower effective temperature than the other objects. For post-AGB candidates with a shell, a clear line from the upper left to the lower right is observed, to the right of which practically no objects are detected. This is probably because this type of objects only appears in the optical when the opacity of the circumstellar envelope declined sufficiently for the central star to become visible. Owing to the faster evolutionary timescales for more massive objects, these objects are already closer to the PNe stage when this happens. The spread in effective temperatures is lower for objects with a disc, which seem to accumulate at effective temperatures of 3000-6000 K. This might be a consequence of the evaporation of the circumstellar disc due to the heating of the central star, at which point the object would no longer show an IR excess and disappear from our sample. More research is needed to confirm this, however.
For objects with a shell we observe a bias towards lower luminosities (lower masses). This is predicted by the initial mass function and the fact that massive, single stars lose more mass than less massive stars, which causes them to be obscured by the optically thick wind they generate. There is little direct evidence for the binary nature of shell sources in the Galaxy. Many disc sources appear to be 3-7 rather than 1 stars, which is unexpected. Maybe some of the disc sources are not really post-AGB stars with a circumstellar disc, but AGB stars with clumpy ejections. In this case, one can see the hotter dust near the central star as well as more remote clumps, which reside in general in a non-spherical wind. These clumpy winds seem to occur earlier in the AGB evolution when the mass-loss rate is lower (Feast et al. 2003; Habing & Olofsson 2004; Monnier et al. 2004) and will be more detectable in the SAGE survey for the more luminous stars.
5 Evaluation
5.1 Cross-correlation with catalogues of other types of objects
We cross-correlated the list of post-AGB candidates with available catalogues of other types of objects in the LMC that are likely to display SEDs with characteristics similar to those of post-AGB stars. For this, we invariably used a search radius of 2″ unless noted otherwise. Here, we discuss the results of these comparisons.
5.1.1 RV Tauri stars
| Object Name (IRAC) | Spectral Type | MACHO | OGLE-III |
|---|---|---|---|
| J045543.20-675110.1 | G2-8(R)Ibe: | 47.2496.8 | T2CEP-015 |
| J050304.95-684024.7 | F7-9Ibpe | 19.3694.19 | T2CEP-029 |
| J050356.28-672724.8 | T2CEP-032 | ||
| J051418.09-691234.9 | F7-9Ibpe | 79.5501.13 | T2CEP-067 |
| J051845.47-690321.8 | F2-4Ibpe | T2CEP-091 | |
| J052149.11-700434.2 | 78.6698.38 | T2CEP-104 | |
| J052519.48-705410.0 | G0Ib | T2CEP-119 | |
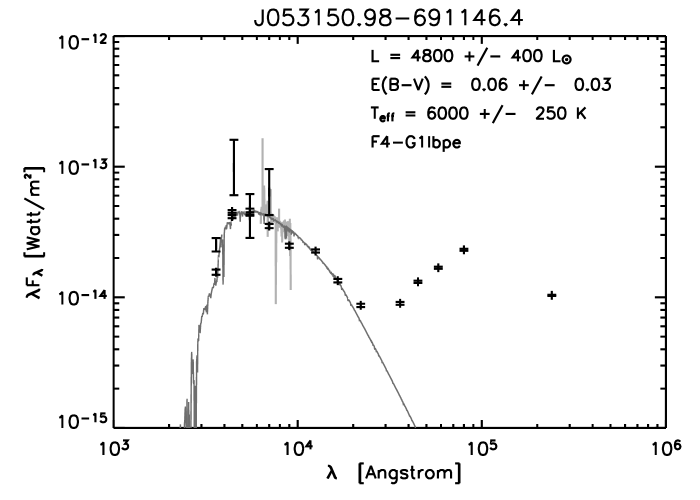
| J053150.98-691146.4 | F4-G1Ibpe | 82.8405.15 | T2CEP-147 |
| J053932.79-712154.4 | 14.9582.9 | T2CEP-169 | |
| J054312.86-683357.1 | F7Ibp | T2CEP-180 | |
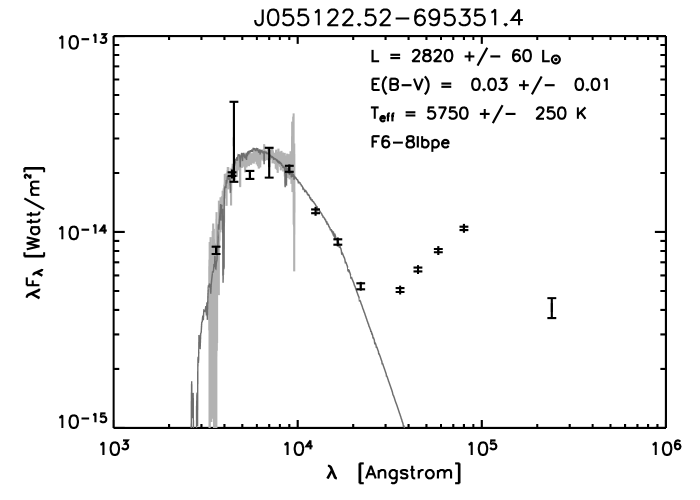
| J055122.52-695351.4 | F6-8Ibpe | T2CEP-191 |
The post-AGB tracks cross the high-luminosity end of the Population II Cepheid instability strip and consequently harbour the subclass of RV Tauri stars, objects that display complex light curves with alternating deep and shallow minima with often intermittent lower amplitude irregularities. Hence, we expect the known RV Tauri stars to be part of our sample.
The recent OGLE-III Catalogue of Variable Stars (Soszyński et al. 2008) lists 37 of these objects of which 11 also belong to our sample. This is less than we anticipated, but only these 11 objects are detected by SAGE at both 8 and 24 m. None of the selection criteria we used discarded any of them from the final sample, confirming the quality of these criteria. Six of the RV Tauri stars in our sample are also in the MACHO catalogue of RV Tauri stars (Alcock et al. 1998). A list of the names of all RV Tauri stars in our sample, their spectral types and MACHO numbers can be found in Table 4.
Because the Galactic RV Tauri stars with circumstellar dust are mainly associated with circumstellar discs (e.g., Lloyd Evans 1995, 1997; Van Winckel et al. 1999; Gielen et al. 2007), we expected something similar to occur in the LMC. When we took a closer look at the subsamples these OGLE objects belong to, we indeed discovered that they all fulfil the selection criteria we used to select the objects with a disc, with four of them also living up to the criteria we imposed for sources with a shell. Detailed SED modelling and, if possible, IR spectroscopic data (e.g., Gielen et al. 2009) is needed to clarify the nature of the circumstellar material around these objects.
5.1.2 R Coronae Borealis stars
R Coronae Borealis (R CrB) stars are also linked to the post-AGB evolutionary stage. These are rare objects, of which only about 50 are known in the Galaxy (e.g., Tisserand et al. 2008). They are -poor supergiants that display sudden deep drops of up to eight magnitudes in their light curve, which are caused by dust obscuration in the line of sight. The star only returns to its normal brightness when the optical depth of the dust in the line of sight has decreased. While at maximum light, R CrB stars undergo small-scale, Cepheid-like variability.
Surprisingly many R CrB stars were found in the LMC as a byproduct of the MACHO, EROS-2, and OGLE surveys (Soszyński et al. 2009b, and references therein). Of the 23 known R CrB stars and candidates, only one is a member of our final post-AGB sample: J052147.95-700957.0 or MACHO 6.6696.60. This object is a spectroscopically confirmed R CrB star that was observed by MACHO, but we obtained no spectrum for it.
One additional object that did not survive the SED-based luminosity-cut – J051648.08-692222.0 (see Table LABEL:list_delobj) – is also listed as an R CrB candidate by Soszyński et al. (2009b) based on the variability of its light curve. This is not supported by its O-B type spectrum, however, in which no carbon chemistry is detected and which displays a strong emission peak.
5.1.3 Other types of objects
The SEDs of luminous YSOs can be quite similar to those of post-AGB candidates. To estimate the number of YSOs among our post-AGB candidates, we cross-correlated our list with the 270 spectroscopically confirmed YSOs from Seale et al. (2009) (groups S, SE, P, PE, E and F), the 989 candidate YSOs selected by Whitney et al. (2008), and the 1172 candidate YSOs from the catalogue of Gruendl & Chu (2009) that they list as either ’definite’ or ’probable’. The latter two catalogues are based on colour-magnitude criteria only. Neither of these catalogues imposed a luminosity criterion or obtained spectra, which renders an overlap with genuine post-AGB stars very likely. A comparison of both catalogues can be found in Gruendl & Chu (2009). Note that Whitney et al. (2008) made use of an earlier version of our catalogue to remove some post-AGB candidates from their sample.
Seale et al. (2009) list 270 embedded YSOs that were spectroscopically confirmed in the IR and selected from the catalogue of Gruendl & Chu (2009) of which 54 are also part of our final sample. J052630.65-674036.6, an object that was discarded because its high final luminosity exceeded our constraints, was also observed by Seale et al. (2009), but our optical spectrum indicated that it is a B1e star and it does not lie in an H-rich region of the LMC.
We found out that our sample contains 202 of the 989 objects listed by Whitney et al. (2008) as probable YSOs of which 119 have a high probability. For 14 of these, we have a low-resolution, optical spectrum, but none of the spectra are indicative of a YSO rather than a post-AGB star. Seven additional objects for which a spectrum was obtained but which have a final luminosity of more than 35 000 are also found in this catalogue. Two of these show [O III] in absorption owing to excess sky-subtraction from a surrounding emission nebula, but lie in an poor region of the LMC. We also noted that J053557.86-671333.5 and J051654.04-672005.1, which we identified as a galaxy and a PN-like object respectively (see Sect. C), both occur in the list of high-probability YSOs.
Of the objects listed by Gruendl & Chu (2009), 30 of the 317 probable and 134 of the 855 definite YSO candidates are part of our final sample. For three of these, we obtained a spectrum that is indicative of a post-AGB star rather than a YSO. One additional object – J052630.65-674036.6 – whose high final luminosity exceeded our constraints and is therefore no longer in our final sample, shows [O III] in absorption, but does not lie in an -rich region. They also regard the PN-like object J051654.04-672005.1 (Sect. C.2) as a definite YSO candidate.
We checked the presence of possible red supergiants in our sample by cross-correlating our list with the catalogue of candidate red supergiants of Oestreicher et al. (1997). None of their 175 objects appear in our final list of post-AGB candidates and we lost the 24 sources that fulfil the colour criteria thanks to the luminosity-cut. We can therefore conclude that there are probably no red supergiants remaining in our sample of post-AGB candidates thanks to this cut.
To estimate the number of AGB stars remaining in our sample, we used the 29 AGB stars classified by Trams et al. (1999) without listed spectral type. Four objects – J044918.46-695314.5, J045538.96-674910.6, J051110.44-675210.6 and J051138.64-665109.8 – are also part of our final list, but for none of these was a spectrum obtained. All four objects have an SED that is indicative of a disc.
Cioni et al. (2006) listed some colour criteria to identify evolved giant stars, which we used to obtain an extra, but rougher estimate of the number of remaining and -rich AGB stars. Based on their findings, our sample might contain 68 -rich and 446 -rich AGB stars, making a total of 514 objects. We have a spectrum for ten of these, none of which shows any indication of molecular bands. The central stars are clearly visible at shorter wavelengths and the estimated temperatures are often too high for AGB stars. The SEDs of the majority of these 514 objects, most of which show an indication of a disc, are therefore more indicative of a post-AGB star than of an AGB object.
We already discovered two PN-like objects among our post-AGB sample. To assess the total number of PNe that still remain, we cross-correlated our list with the catalogue of Reid & Parker (2006). We discovered that 59 of the 629 PNe listed by Reid & Parker (2006) are still part of the sample. For one of those – J051123.63-700157.4 – and one additional object that was discarded because of its too high final luminosity – J045433.85-692036.2 – we already obtained a low-resolution, optical spectrum. These objects display a very peculiar spectrum, however, that is not indicative of a PN: the former is a peculiar emission-line object with a very weak continuum and the latter a B[e] star. Details of both spectra can be found in Table 2.
Low-resolution, optical spectra of all the sources are required to remove galaxies from our final sample. Nine galaxies that we identified from our spectra are listed in Table 11. To estimate the fraction of galaxies remaining on our list, we cross-correlated it with the NASA/IPAC Extragalactic Database (NED)222The NASA/IPAC Extragalactic Database (NED) is operated by the Jet Propulsion Laboratory, California Institute of Technology, under contract with the National Aeronautics and Space Administration..
We have spectra of eleven of the 172 objects both lists have in common, but none of these show a radial velocity that is incompatible with membership of the LMC.
Finally, to take into account matches with other already studied objects, we ran a search on SIMBAD. No other polluting types of objects in addition to the ones we already investigated were revealed.
5.2 Variability
The variability of our full list of post-AGB candidates was examined by cross-correlating it with the catalogue of long-period variables (LPVs) from MACHO listed by Fraser et al. (2008). Among the 56 453 LPVs listed in this catalogue, 439 are post-AGB candidates in our catalogue. The most common variable type (245 objects) is the sequence-D variable which is an LPV with a long secondary period (Wood et al. 1999). These stars were shown by Wood & Nicholls (2009) to exhibit a mid-IR excess due to circumstellar dust in a clumpy or disc-like configuration. Indeed, all but one of our 245 candidates with a sequence-D variability have an SED that is possibly indicative of a disc (or other non-spherical dust distribution), and 13 of these also meet the criteria for a shell. Given the mid-IR excess associated with sequence-D variables, it is thus not surprising that they frequently appear in our catalogue of post-AGB star candidates. Although the origin of the sequence-D variability is currently unknown (Wood et al. 2004; Nicholls et al. 2009), it is unlikely that all these objects are true post-AGB stars. They are far too common, with their numbers being about 30 % of the number of AGB stars, and their K, M, and C-type spectral types put them still on the AGB. This is consistent with the spectral types of the 3 post-AGB candidates that are listed in sequence D and for which a spectrum was obtained.
Of the remaining 194 post-AGB candidates in the LPV catalog of Fraser et al. (2008), 2 objects belong to sequence 4, 15 to sequence 3, 37 to sequence 2, 33 to sequence 1 and none to sequence E with the LMC period-luminosity sequences mentioned from shortest to longest period in the manner of Fraser et al. (2008). All other objects are either part of the one-year artifact, which is caused by the annual observing schedule of the MACHO project (14 objects), fall outside the boundaries of any period-luminosity classification (39 objects), or were unable to be classified (54 objects).
For those objects for which we have an optical spectrum that enabled us to determine their spectral type, we made a detailed examination of the light curves because catalogues of variable stars (e.g., Fraser et al. 2008) often miss low-amplitude variables. We downloaded light curves from the MACHO website for all post-AGB candidates with a spectral type and a spectrum (a few were missed, presumably because of close bright companions or bad positions on the MACHO CCDs) and we also obtained OGLE II and OGLE III light curves for the stars in the OGLE II and OGLE III variable star catalogues (Udalski et al. 2008; Soszyński et al. 2008, 2009a). Light curves were obtained for a total of 53 post-AGB candidates from at least one of the above sources.
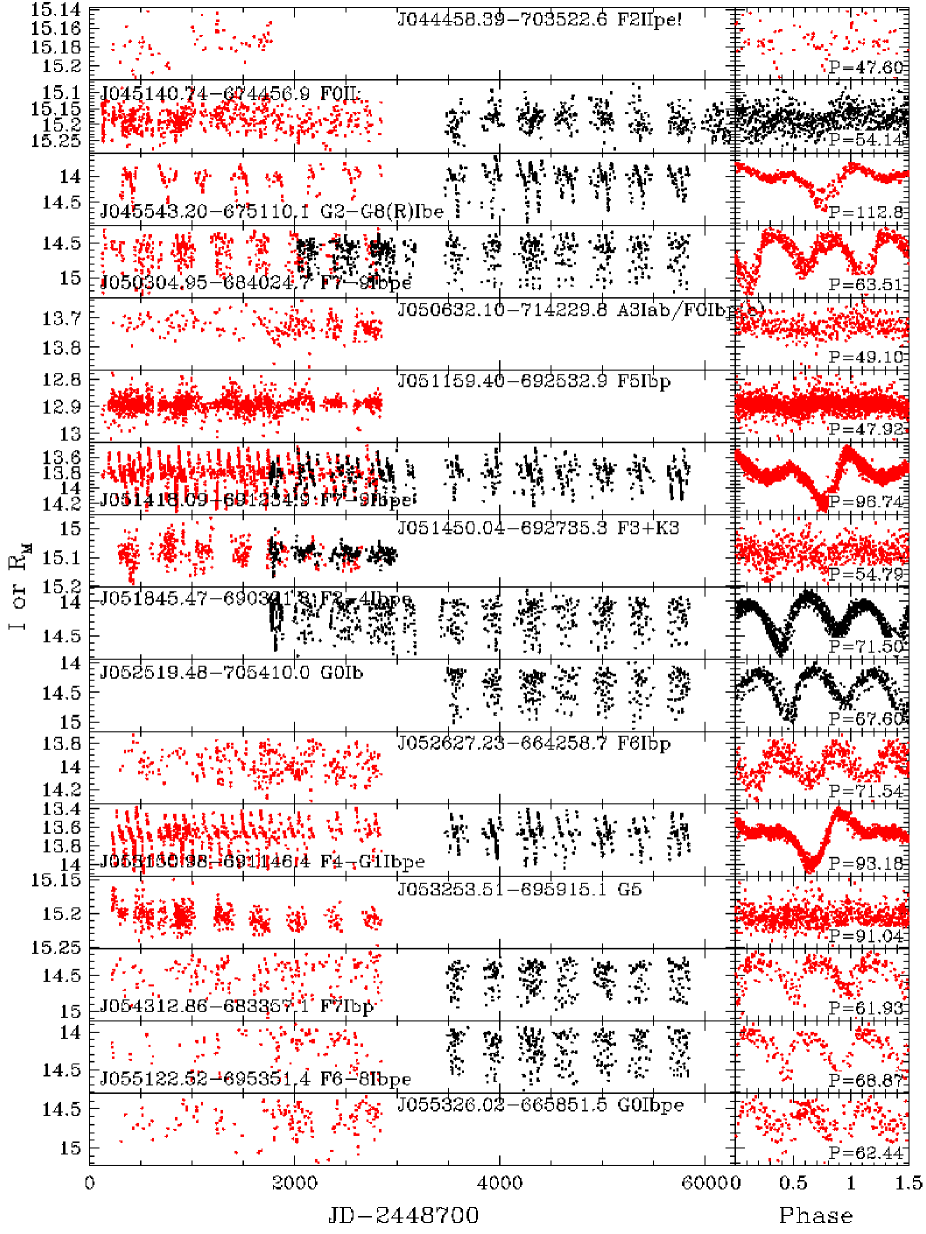
The most common variability types among the post-AGB candidates are Population II Cepheids (including RV Tauri stars) and semi-regular variables (SRVs). Light curves of the 16 Population II Cepheids we found are shown in Fig. 16, their periods and MACHO numbers can be found in Table 5. All periods were derived using the PDM routine in IRAF. The eight higher amplitude stars in this figure were previously-known variables, and they are the objects with a spectral type listed in Table 4 (see Sect. 5.1.1 for details of the other stars in Table 4). The other eight stars in Fig. 16 are new Population II Cepheids. The objects J052627.23-664258.7 and J055326.02-665851.5 have moderate amplitudes of 0.3 magnitudes, but most of the new Population II Cepheids are of very low amplitude ( magnitudes). These are more examples of the ultra-low amplitude variables discussed by Buchler et al. (2005), Buchler et al. (2009) and Van Winckel et al. (2009). One of the objects found here (J050304.95-684024.7) was also discussed by Buchler et al. (2009). As expected, all Population II Cepheids have F and G spectral types. The bulk of these objects (10 sources) have SEDs that are indicative of a disc, two are shell sources and the remaining four display the criteria for both groups. All these stars are presumably genuine post-AGB stars evolving away from the AGB across the HR diagram.
| Object Name (IRAC) | P (days) | MACHO | SpT |
|---|---|---|---|
| J044458.39-703522.6 | 47.6004 | 46.761.549 | F2IIpe! |
| J045140.74-674456.9 | 54.1438 | 47.1893.34 | F0II: |
| J045543.20-675110.1 | 112.828 | 47.2496.8 | G2-8(R)Ibe: |
| J050304.95-684024.7 | 63.51 | 19.3694.19 | F7-9Ibpe |
| J050632.10-714229.8 | 49.1 | 38.4253.12 | A3Iab |
| /F0Ibp(e) | |||
| J051159.40-692532.9 | 47.92 | 79.5135.14 | F5Ibp |
| J051418.09-691234.9 | 96.745 | 79.5501.13 | F7-9Ibpe |
| J051450.04-692735.3 | 54.785 | 5.5618.3940 | F3 + K3 |
| J051845.47-690321.8 | 71.505 | F2-4Ibpe | |
| J052519.48-705410.0 | 67.600 | G0Ib | |
| J052627.23-664258.7 | 71.537 | 62.7474.1378 | F6Ibp |
| J053150.98-691146.4 | 93.180 | 82.8405.15 | F4-G1Ibpe |
| J053253.51-695915.1 | 91.04 | 81.8514.57 | G5 |
| J054312.86-683357.1 | 61.933 | 33.10229.18 | F7Ibp |
| J055122.52-695351.4 | 68.874 | 30.11540.16 | F6-8Ibpe |
| J055326.02-665851.5 | 62.444 | 69.11947.14 | G0Ibpe |
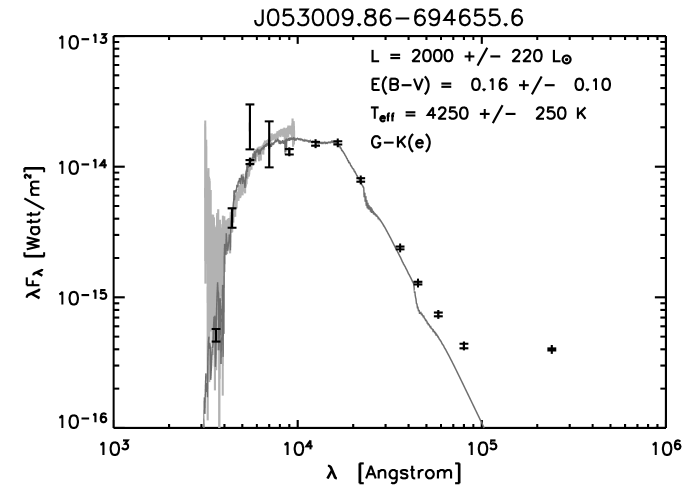
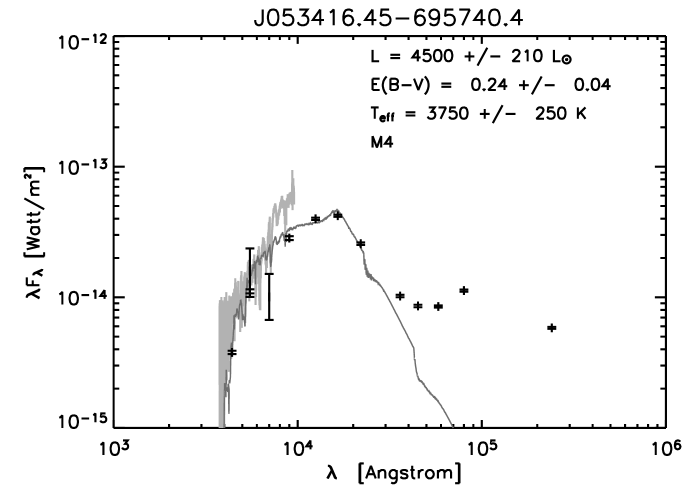
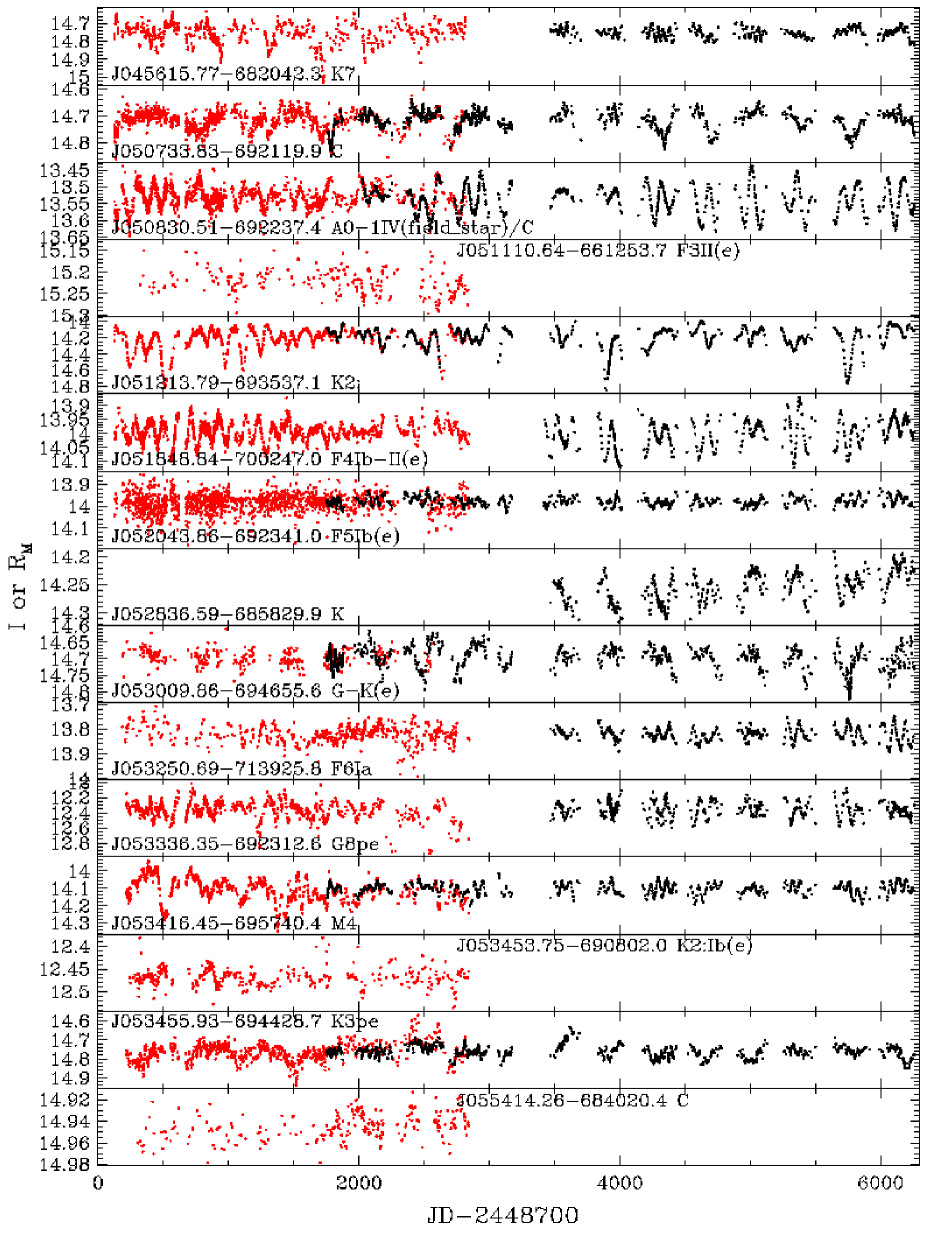
Light curves of the 15 SRVs are shown in Fig. 17. Five of these SRVs – J045615.77-682042.3, J050733.83-692119.9, J053009.86-694655.6, J053416.45-695740.4 and J053455.93-694428.7 – show a long secondary period and hence they are sequence-D variables. Three were first recognised by Fraser et al. (2008) and the other two by us. They are of K, M, or C spectral type, just like another five of the SRVs. Most of these stars, including the two carbon stars J050830.51-692237.4 and J055414.26-684020.4, may still be on the AGB, but we identified the third carbon star (the sequence-D variable J050733.83-692119.9) as a candidate post-AGB star (Sect. 3.2.1). The other five SRVs have unusually warm spectral types of F or G. This is not expected for semi-regular variables.
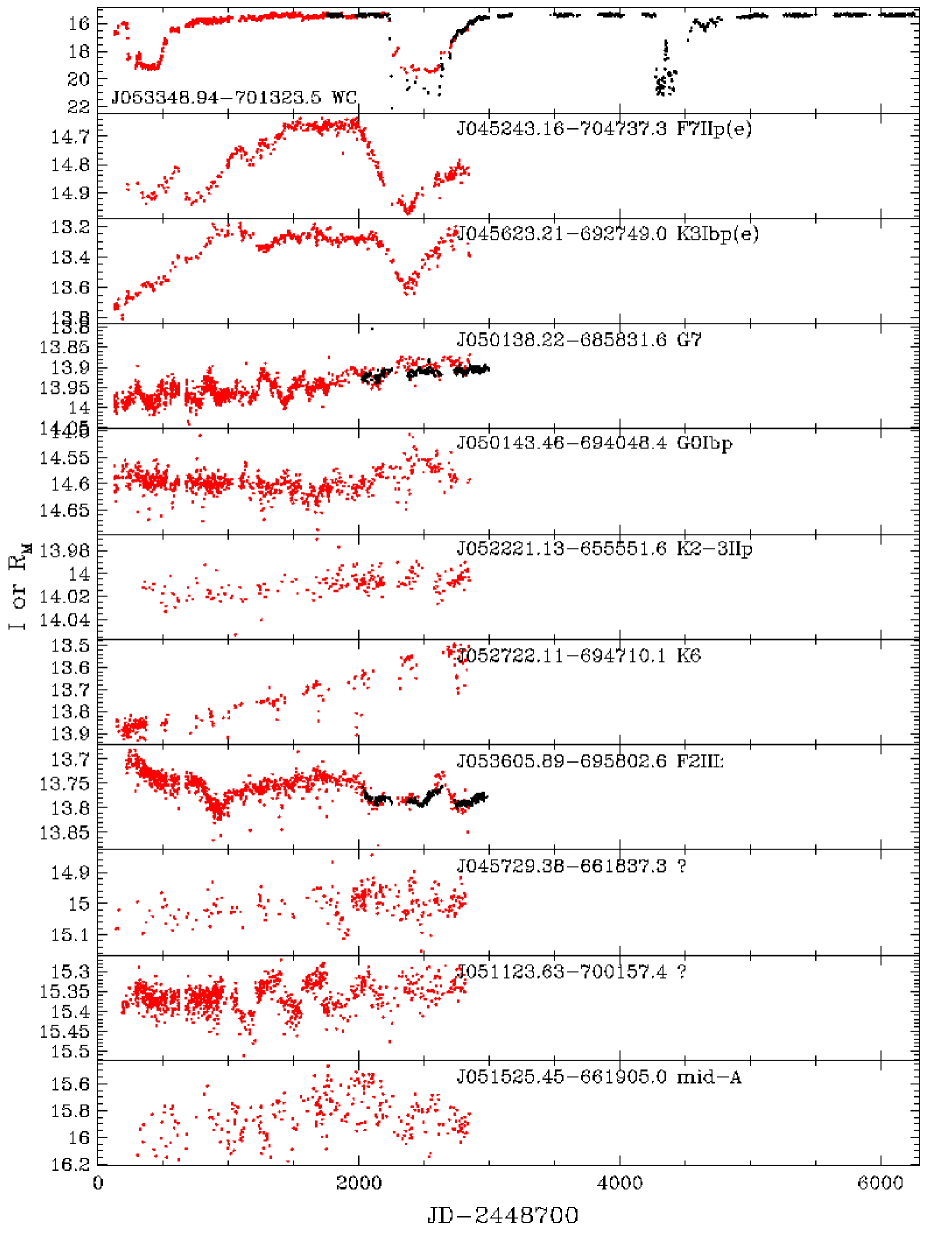
Some of the post-AGB candidates with known spectral type showed evidence for long-term, slow variations and their light curves are shown in Fig. 18. The first object, J053348.94-701323.5, is a previously-know R CrB star that is discarded from the final sample because of its WC-like spectrum. The next seven objects down the figure show a bizarre behaviour, including some resemblance to that of R CrB stars as well as long-term trends in brightness. This behaviour is most likely associated with rapidly changing extinction, which might be expected for AGB stars that have just ejected their envelopes, or which have discs that have not settled into a steady state. The final three objects in Fig. 18 are in regions of very strong nebular emission. All of them seem to show long-term brightness variations.
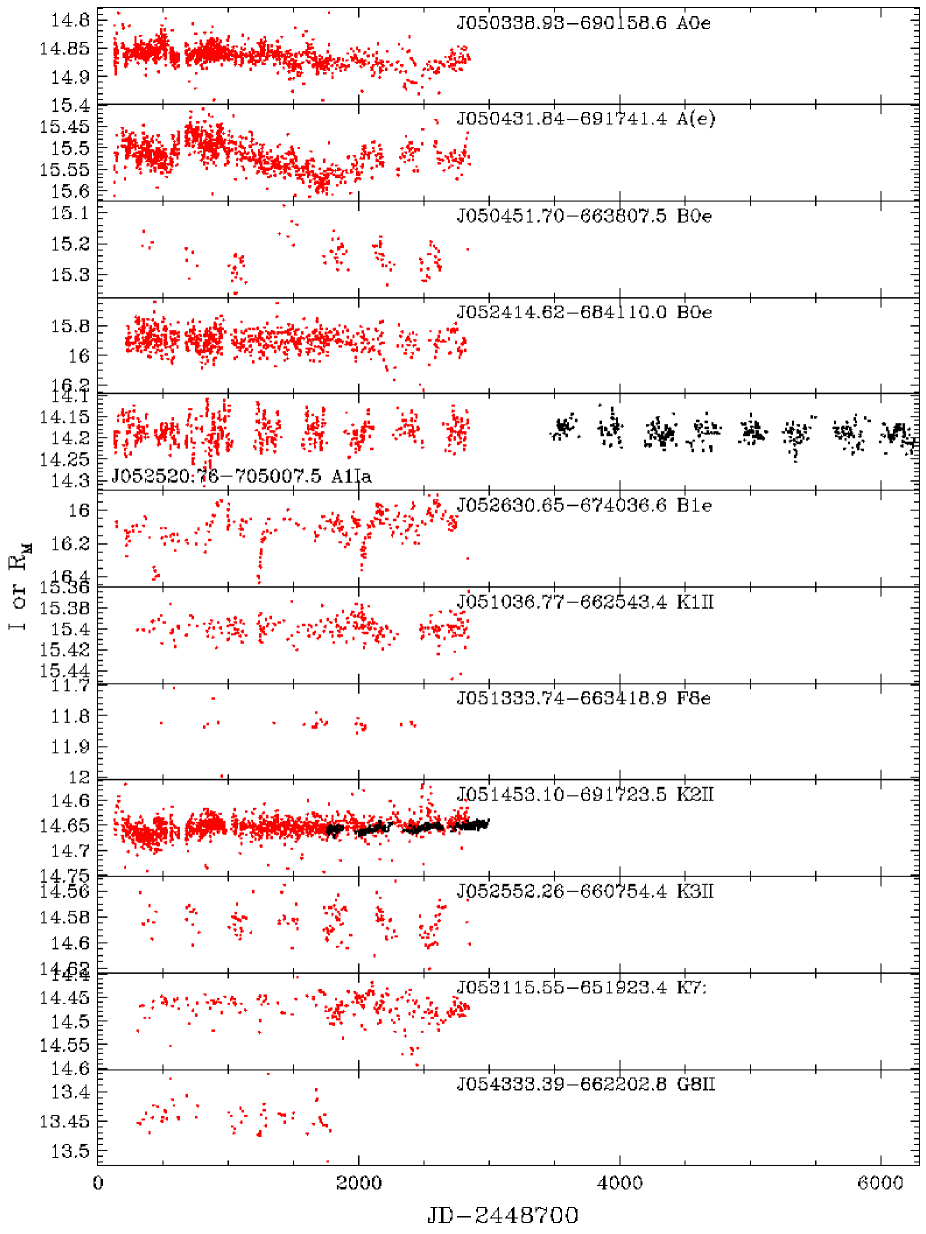
The final group of light curves (Fig. 19) consists of Ae and Be stars (the top six light curves) and post-AGB candidates that do not show strong evidence of variability (the lower six light curves). Most of the Ae and Be stars show evidence for short period oscillations, as well as longer-term trends. This behaviour is common in Ae and Be systems and the variability is thought to be caused by binarity along with possible nonradial pulsation (Mennickent et al. 2005, 2006, 2010).
In summary, the light curves of the post-AGB candidates provide useful information to support or reject post-AGB status. Stars with Population II Cepheid variations must be in the instability strip, and they can only be in this part of the HR diagram if they have evolved away from the AGB along their post-AGB evolutionary tracks. Some of the stars show unusual long-term variations that are suggestive of variable extinction, which is likely the result of the clearing and/or accretion of recently ejected matter: these stars are also likely to be post-AGB stars.
5.3 Efficiency of our selection criteria
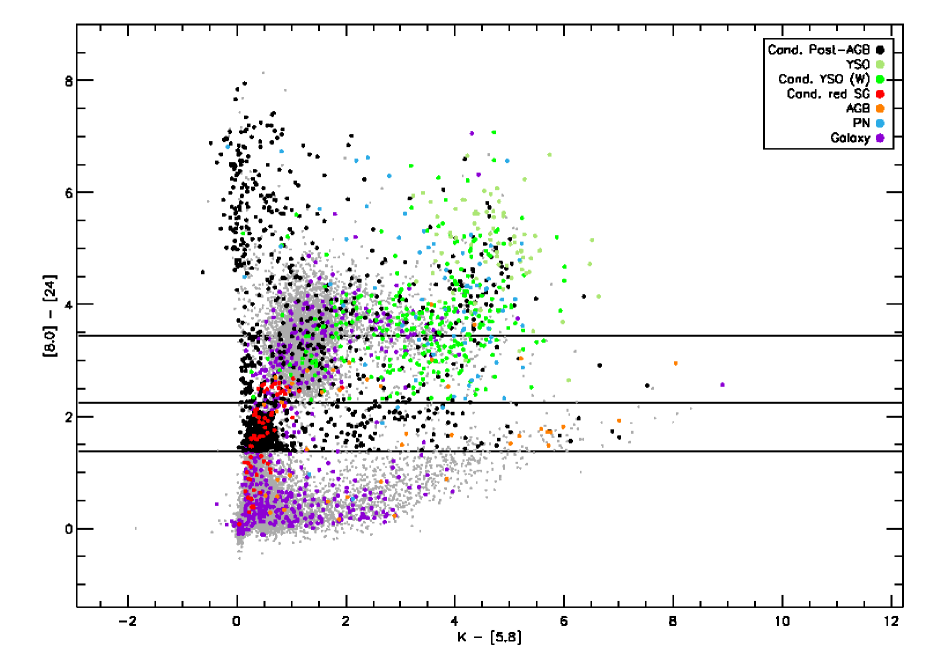
To evaluate our selection procedure, we reviewed the different selection criteria one by one. In Fig. 20 we display versus for all objects in our final sample of post-AGB candidates together with the YSOs from Seale et al. (2009), the high-probability candidate YSOs from Whitney et al. (2008), the red supergiants from Oestreicher et al. (1997), the AGB stars from Trams et al. (1999), the PNe from Reid & Parker (2006) and all galaxies from NED that are in the line of sight of the LMC. The grey dots in the background represent the initial SAGE catalogue. All objects in this plot with larger than 1.384 are initially part of our sample of post-AGB candidates. Obviously our initial criterion already removes some galaxies, red supergiants, and AGB stars from the sample, but the other types have colours in strong overlap with the post-AGB candidates.
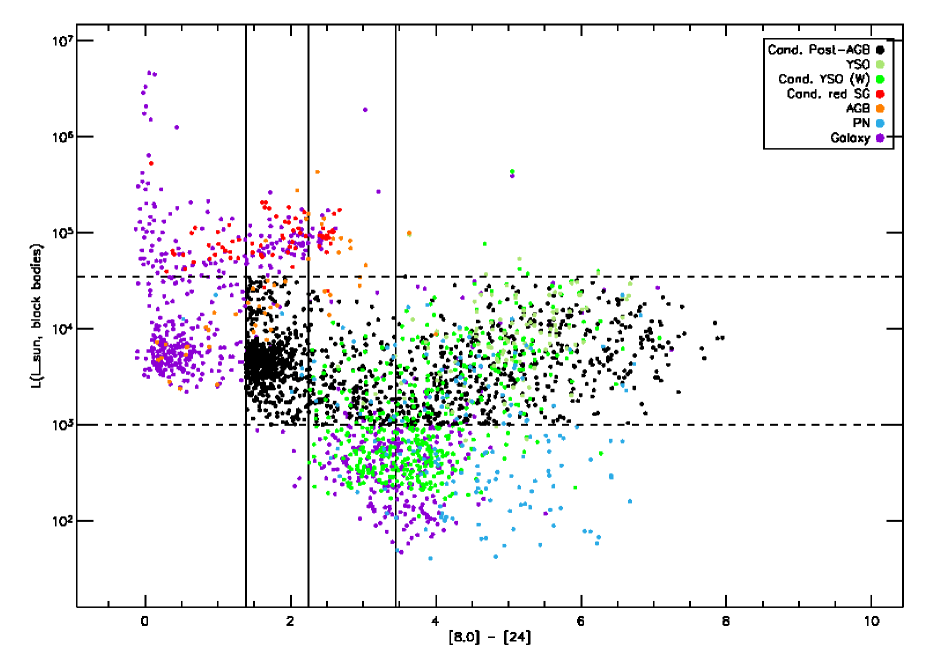
We computed the luminosity estimates of the objects from the different catalogues by fitting up to three black bodies to their photometry and integrating, as was previously described for our sample of post-AGB candidates (see Sect. 2.3). Fig. 21 shows that the luminosity-cut we performed to remove the bulk of the supergiants from the sample was indeed effective. All remaining supergiants and some extra galaxies and AGB stars were discarded from our sample. Distinguishing between YSOs and post-AGB stars proved to be a bit more difficult: the lower limit we imposed for the luminosity discards the bulk of the candidate YSOs from Whitney et al. (2008) but leaves almost all more luminous and spectroscopically confirmed YSOs of Seale et al. (2009) in the sample. Because of the similarity of the SEDs of YSOs and post-AGB stars, no other colour-colour plane can help us solve this issue. Spectra are therefore needed to discard the YSOs from our final catalogue. Some dim PNe and galaxies are also left out of the sample by this lower limit.
5.4 Completeness of the catalogue
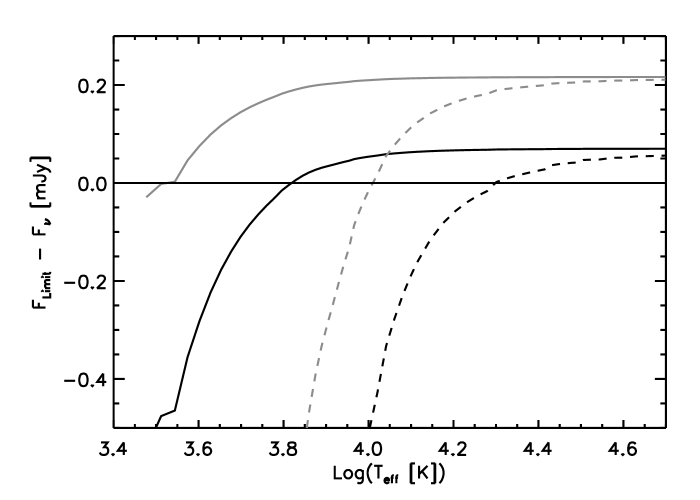
The completeness of the catalogue of optically bright post-AGB candidates is limited by the sensitivity of the IRAC 8.0 m and MIPS 24 m filters, which have a faint limit of respectively 14.9 and 11.3 in magnitude 333http://data.spitzer.caltech.edu/popular/sage/20090922_enhanced/documents/SAGEDataProductsDescription_Sep09.pdf. For the naked stellar atmosphere models introduced in Sect. 4.1, this means that an atmosphere model placed at the distance of the LMC and with a luminosity of 1000 is no longer detectable at 8 m if it has a temperature above 6750 K. For a luminosity of 35 000 this only happens at 20 000 K.
The initial selection criterion we required for post-AGB candidates, , implies the presence of dust in the system at 24 m and consequently a lower limit for the flux emitted at this wavelength for an object to become part of our final sample. The above mentioned models with no excess at 8 m, a flux at 24 m that obeys the criterion, and luminosities of 1000 and 35 000 will only be detected for effective temperatures below 3500 and 10 500 K.
Accordingly we detect all post-AGB candidates with an effective temperature less than 3500 K, while objects with a temperature above 20 000 K need a dust excess at 8 and 24 m to be found. For all temperatures in between, we lack mainly the hotter objects with minimal dust excess. In Fig. 22 we show the minimal amount of flux needed in each filter for a post-AGB candidate to be detected for a range of effective temperatures.
Wood & Cohen (2001) found 25 possible post-AGB candidates in the LMC. The candidates had a detection in the 8.28 m band of the Midcourse Space Experiment (MSX) satellite, together with luminosities and colours that suggested these candidates were transiting from the AGB to higher temperatures in the HR diagram. These objects should have been detected in the IRAC 8 m band, but only 17 can be found in the SAGE catalogue constructed by us (Sect. 2.2). One object did not fulfill the colour criteria we imposed, four did not have optical magnitudes in the requested filters and two additional MSX-selected post-AGB candidates were detected at 70 and/or 160 m in the MIPS filters and had an SED that monotonically increased towards wavelengths redder than 70 m. The final object from the MSX PAGB candidate list that did not make it to the present survey is J053348.94-701323.5: it is an R CrB star (Wood & Cohen 2001; Alcock et al. 2001) and was discarded from our final sample because it is also a WC star (see Sect. C.3).
Nine post-AGB candidates are common to our current candidate list and to the MSX post-AGB candidate list of Wood & Cohen (2001, and unpublished). The object J050718.33-690742.9 in Table 9 with a spectral type A7II/A9I is an MSX post-AGB candidate: the spectra obtained by Wood & Cohen give a similar spectral type of F0e:, it has emission in the core of . The objects J051845.23-700534.5, J052147.95-700957.0, J052337.91-693854.1, J052804.80-685947.2, J053010.30-690933.8, J053306.86-703033.9, J053327.17-700951.5 and J053431.48-683513.7 are also MSX post-AGB candidates, but we did not obtain a spectrum for any of them. Of these stars, J052147.95-700957.0 is an R CrB star (Wood & Cohen 2001; Alcock et al. 2001), J051845.23-700534.5, J052804.80-685947.2 and J053431.48-683513.7 are stars with emission, while J053010.30-690933.8 and J053306.86-703033.9 are M stars.
There are two MSX post-AGB candidates that appear to be genuine stellar candidate post-AGB stars but which are not in our current catalogue. J052048.20-701212.6 is a star with an R CrB-like light curve (Wood & Cohen 2001; Alcock et al. 2001) and J052551.84-684634.2 is an M star. Both objects had no counterpart in the optical catalogues we used. The other MSX post-AGB candidates (making up the total of 25 in Wood & Cohen (2001)) are in regions of strong nebular emission (perhaps because of the MSX source) or do not have optical counterparts and so their post-AGB status is uncertain.
Ignoring the M stars (which are probably still on the AGB) and the objects in regions of strong nebular emission, we find that of the eight MSX post-AGB candidates for which there is spectral or light curve information that supports the initial post-AGB selection, seven are in our current catalogue. In addition to this, we found in Sect. 5.1.1 that all 11 known RV Tauri stars that are detected by SAGE at both 8 and 24 m are members of our sample. Our selection criteria may thus have rejected roughly 1 in 20 (5 %) of the potential optically bright post-AGB candidates.
6 Conclusions
We present our catalogue of post-AGB candidates based on the second data release of the point-source catalogue of the SAGE-Spitzer LMC survey (Meixner et al. 2006). Our method combines photometry, low-resolution spectroscopy, and detailed SED fitting and includes constraints on the luminosity. Our conclusions and future research lines can be summarised as follows:
-
•
The catalogue of 70 spectroscopically confirmed and 1337 good post-AGB candidates we constructed is the first step towards a homogeneous and complete list of post-AGB stars in the LMC. Spectroscopic confirmation is still needed for the majority of the candidates. About 25 post-AGB stars were known in the LMC before our endeavours.
-
•
Our separation between sources with a disc and a shell is based on the SED characteristics of thermal emission from the circumstellar dust. This yields 624 discs, 568 shells and 215 undetermined sources.
-
–
As in the Galaxy, the disc sources form a very significant fraction of the optically bright post-AGB stars. The evolution rate of post-AGB stars depends on the rate at which the remaining -rich envelope is consumed. The consumption can be from within by -shell burning, which just depends on the luminosity and is the same for disc and shell sources, or by mass-loss from the exterior. As in the Galaxy, some disc sources in the LMC show the effect of accretion (Reyniers & Van Winckel 2007; Gielen et al. 2009), which increases the mass of the -rich envelope and slows down the evolutionary timescale of the central star. Because the discs are stable, the IR lifetime of these objects is expected to be much longer than for shell objects (Van Winckel 2003), which allows strong grain processing to occur. In a limited study of Gielen et al. (2009), this is also detected in the few LMC disc sources that have been published until now. Disc sources in the Galaxy are associated with binary central stars (e.g., Van Winckel et al. 2009). In our future research, we will focus on a detailed full sample study of the disc sources, but the direct proof of the high binary rate in this sample will be an observational monitoring challenge.
-
–
The objects that we characterise as shell sources cover a wide range in luminosity and hence initial mass. Detailed spectroscopic analyses of the photospheres will allow testing of the chemical enrichment predictions of AGB theoretical models in full detail with a well constrained sample of objects with known luminosities (and hence final and initial masses). Systematic IR spectroscopic surveys were defined before the construction of our catalogue, but the available Spitzer spectra (Kemper et al. 2010; Woods et al. 2011) form an ideal complement that is needed to fully characterise the post-AGB stars.
-
–
-
•
We have shown that light curves provide useful information on whether a post-AGB candidate is indeed a genuine post-AGB star. Looking at light curves doubled the number of known Population II Cepheids in our sample of 53 stars with spectra from 8 to 16 (these are almost certainly post-AGB stars). The light curves also revealed long-term changes in magnitude in eight other objects that strongly hint at genuine post-AGB status.
The catalogue offers strong potential in the study of mass-dependant properties of post-AGB stars such as AGB nucleosynthetic yields via photospheric abundances studies, and mass-loss rates by the distribution of post-AGB stars in the HR diagram. The disc sources that are likely associated with binary central stars will allow testing of the poorly understood binary evolution channels. Clearly, our extensive catalogue with well-constrained luminosities is just the first step in the exploitation of the SAGE project for extragalactic post-AGB research.
Acknowledgements.
E. van Aarle acknowledges support from the Fund for Scientific Research of Flanders (FWO) under grant number G.0470.07. We would like to thank the referee for instructive remarks. This paper utilizes public domain data obtained by the MACHO Project, jointly funded by the US Department of Energy through the University of California, Lawrence Livermore National Laboratory under contract No. W-7405-Eng-48, by the National Science Foundation through the Center for Particle Astrophysics of the University of California under cooperative agreement AST-8809616, and by the Mount Stromlo and Siding Spring Observatory, part of the Australian National University.References
- Alcock et al. (1998) Alcock, C., Allsman, R. A., Alves, D. R., et al. 1998, AJ, 115, 1921
- Alcock et al. (2001) Alcock, C., Allsman, R. A., Alves, D. R., et al. 2001, ApJ, 554, 298
- Balick & Frank (2002) Balick, B. & Frank, A. 2002, ARA&A, 40, 439
- Blöcker (1995) Blöcker, T. 1995, A&A, 299, 755
- Blum et al. (2006) Blum, R. D., Mould, J. R., Olsen, K. A., et al. 2006, AJ, 132, 2034
- Bonanos et al. (2009) Bonanos, A. Z., Massa, D. L., Sewilo, M., et al. 2009, AJ, 138, 1003
- Buchler et al. (2005) Buchler, J. R., Wood, P. R., Keller, S., & Soszyński, I. 2005, ApJ, 631, L151
- Buchler et al. (2009) Buchler, J. R., Wood, P. R., & Soszyński, I. 2009, ApJ, 698, 944
- Bujarrabal et al. (2001) Bujarrabal, V., Castro-Carrizo, A., Alcolea, J., & Sánchez Contreras, C. 2001, A&A, 377, 868
- Bujarrabal et al. (2007) Bujarrabal, V., Van Winckel, H., Neri, R., et al. 2007, A&A, 468, L45
- Cioni et al. (2006) Cioni, M., Girardi, L., Marigo, P., & Habing, H. J. 2006, A&A, 448, 77
- Crowther et al. (1998) Crowther, P. A., De Marco, O., & Barlow, M. J. 1998, MNRAS, 296, 367
- de Marco (2009) de Marco, O. 2009, PASP, 121, 316
- De Ruyter et al. (2005) De Ruyter, S., Van Winckel, H., Dominik, C., Waters, L. B. F. M., & Dejonghe, H. 2005, A&A, 435, 161
- De Ruyter et al. (2006) De Ruyter, S., Van Winckel, H., Maas, T., et al. 2006, A&A, 448, 641
- Deroo et al. (2007) Deroo, P., Acke, B., Verhoelst, T., et al. 2007, A&A, 474, L45
- Deroo et al. (2006) Deroo, P., Van Winckel, H., Min, M., et al. 2006, A&A, 450, 181
- Fazio et al. (2004) Fazio, G. G., Hora, J. L., Allen, L. E., et al. 2004, ApJS, 154, 10
- Feast (1999) Feast, M. 1999, in IAU Symposium, Vol. 190, New Views of the Magellanic Clouds, ed. Y.-H. Chu, N. Suntzeff, J. Hesser, & D. Bohlender, 542–+
- Feast et al. (2003) Feast, M. W., Whitelock, P. A., & Marang, F. 2003, MNRAS, 346, 878
- Fraser et al. (2008) Fraser, O. J., Hawley, S. L., & Cook, K. H. 2008, AJ, 136, 1242
- Garcia-Lario et al. (1997) Garcia-Lario, P., Manchado, A., Pych, W., & Pottasch, S. R. 1997, A&AS, 126, 479
- Geisler et al. (2009) Geisler, D., Grocholski, A., Sarajedini, A., Cole, A., & Smith, V. 2009, LMC Cluster Abundances and Kinematics, ed. Richtler, T. & Larsen, S., 133–+
- Gielen et al. (2008) Gielen, C., van Winckel, H., Min, M., Waters, L. B. F. M., & Lloyd Evans, T. 2008, A&A, 490, 725
- Gielen et al. (2009) Gielen, C., van Winckel, H., Reyniers, M., et al. 2009, A&A, 508, 1391
- Gielen et al. (2007) Gielen, C., Van Winckel, H., Waters, L. B. F. M., Min, M., & Dominik, C. 2007, A&A, 475, 629
- Giridhar et al. (2005) Giridhar, S., Lambert, D. L., Reddy, B. E., Gonzalez, G., & Yong, D. 2005, ApJ, 627, 432
- Gruendl & Chu (2009) Gruendl, R. A. & Chu, Y. 2009, ApJS, 184, 172
- Gustafsson et al. (2008) Gustafsson, B., Edvardsson, B., Eriksson, K., et al. 2008, A&A, 486, 951
- Habing & Olofsson (2004) Habing, H. J. & Olofsson, H. 2004, Asymptotic Giant Branch Stars (Springer)
- Herwig (2005) Herwig, F. 2005, ARA&A, 43, 435
- Hinkle et al. (2007) Hinkle, K. H., Brittain, S. D., & Lambert, D. L. 2007, ApJ, 664, 501
- Höfner (2009) Höfner, S. 2009, in Astronomical Society of the Pacific Conference Series, Vol. 414, Astronomical Society of the Pacific Conference Series, ed. T. Henning, E. Grün, & J. Steinacker, 3–+
- Hony et al. (2003) Hony, S., Tielens, A. G. G. M., Waters, L. B. F. M., & de Koter, A. 2003, A&A, 402, 211
- Houziaux (1968) Houziaux, L. 1968, Bulletin of the Astronomical Institutes of Czechoslovakia, 19, 265
- Hrivnak et al. (1989) Hrivnak, B. J., Kwok, S., & Volk, K. M. 1989, ApJ, 346, 265
- Hu et al. (1993) Hu, J. Y., Slijkhuis, S., de Jong, T., & Jiang, B. W. 1993, A&AS, 100, 413
- Jacoby et al. (1984) Jacoby, G. H., Hunter, D. A., & Christian, C. A. 1984, ApJS, 56, 257
- Keller & Wood (2006) Keller, S. C. & Wood, P. R. 2006, ApJ, 642, 834
- Kemper et al. (2010) Kemper, F., Woods, P. M., Antoniou, V., et al. 2010, PASP, 122, 683
- Kennicutt et al. (1995) Kennicutt, Jr., R. C., Bresolin, F., Bomans, D. J., Bothun, G. D., & Thompson, I. B. 1995, AJ, 109, 594
- Kennicutt et al. (2000) Kennicutt, Jr., R. C., Bresolin, F., French, H., & Martin, P. 2000, ApJ, 537, 589
- Kontizas et al. (2001) Kontizas, E., Dapergolas, A., Morgan, D. H., & Kontizas, M. 2001, A&A, 369, 932
- Kurucz (1979) Kurucz, R. L. 1979, ApJS, 40, 1
- Kwok (1993) Kwok, S. 1993, ARA&A, 31, 63
- Kwok et al. (1987) Kwok, S., Boreiko, R. T., & Hrivnak, B. J. 1987, ApJ, 312, 303
- Kwok et al. (1989) Kwok, S., Volk, K. M., & Hrivnak, B. J. 1989, ApJ, 345, L51
- Lamers et al. (1998) Lamers, H. J. G. L. M., Zickgraf, F., de Winter, D., Houziaux, L., & Zorec, J. 1998, A&A, 340, 117
- Lasker et al. (2008) Lasker, B. M., Lattanzi, M. G., McLean, B. J., et al. 2008, AJ, 136, 735
- Leuenhagen & Hamann (1994) Leuenhagen, U. & Hamann, W. 1994, A&A, 283, 567
- Lloyd Evans (1995) Lloyd Evans, T. 1995, Ap&SS, 230, 169
- Lloyd Evans (1997) Lloyd Evans, T. 1997, Ap&SS, 251, 239
- Luck et al. (1990) Luck, R. E., Bond, H. E., & Lambert, D. L. 1990, ApJ, 357, 188
- Maas et al. (2005) Maas, T., Van Winckel, H., & Lloyd Evans, T. 2005, A&A, 429, 297
- Manchado et al. (1989) Manchado, A., Garcia-Lario, P., Esteban, C., Mampaso, A., & Pottasch, S. R. 1989, A&A, 214, 139
- Marigo et al. (1999) Marigo, P., Girardi, L. ., & Bressan, A. 1999, A&A, 344, 123
- Massey (2002) Massey, P. 2002, ApJS, 141, 81
- Meixner et al. (2006) Meixner, M., Gordon, K. D., Indebetouw, R., et al. 2006, AJ, 132, 2268
- Meixner et al. (2002) Meixner, M., Ueta, T., Bobrowsky, M., & Speck, A. 2002, ApJ, 571, 936
- Meixner et al. (1999) Meixner, M., Ueta, T., Dayal, A., et al. 1999, ApJS, 122, 221
- Mennickent et al. (2005) Mennickent, R. E., Cidale, L., Díaz, M., et al. 2005, MNRAS, 357, 1219
- Mennickent et al. (2006) Mennickent, R. E., Cidale, L., Pietrzyński, G., Gieren, W., & Sabogal, B. 2006, A&A, 457, 949
- Mennickent et al. (2010) Mennickent, R. E., Smith, M. A., Kołaczkowski, Z., Pietrzyński, G., & Soszyński, I. 2010, PASP, 122, 662
- Monnier et al. (2004) Monnier, J. D., Millan-Gabet, R., Tuthill, P. G., et al. 2004, ApJ, 605, 436
- Nicholls et al. (2009) Nicholls, C. P., Wood, P. R., Cioni, M., & Soszyński, I. 2009, MNRAS, 399, 2063
- Oestreicher et al. (1997) Oestreicher, M. O., Schmidt-Kaler, T., & Wargau, W. 1997, MNRAS, 289, 729
- Oudmaijer et al. (1992) Oudmaijer, R. D., van der Veen, W. E. C. J., Waters, L. B. F. M., et al. 1992, A&AS, 96, 625
- Pollard & Lloyd Evans (2000) Pollard, K. R. & Lloyd Evans, T. 2000, AJ, 120, 3098
- Pottasch & Parthasarathy (1988) Pottasch, S. R. & Parthasarathy, M. 1988, A&A, 192, 182
- Reid & Parker (2006) Reid, W. A. & Parker, Q. A. 2006, MNRAS, 373, 521
- Reyniers & Van Winckel (2007) Reyniers, M. & Van Winckel, H. 2007, A&A, 463, L1
- Reyniers et al. (2004) Reyniers, M., Van Winckel, H., Gallino, R., & Straniero, O. 2004, A&A, 417, 269
- Rieke et al. (2004) Rieke, G. H., Young, E. T., Engelbracht, C. W., et al. 2004, ApJS, 154, 25
- Sahai et al. (2007) Sahai, R., Morris, M., Sánchez Contreras, C., & Claussen, M. 2007, AJ, 134, 2200
- Schmidt-Kaler (1982) Schmidt-Kaler, T. 1982, Landolt-Börnstein, Numerical Data and Functional Relationships in Science and Technology, New Series, Vol. 2b, Physical Parameters of the Stars, New Series, Group IV edn. (Berlin: Springer-Verlag)
- Seale et al. (2009) Seale, J. P., Looney, L. W., Chu, Y., et al. 2009, ApJ, 699, 150
- Siódmiak et al. (2008) Siódmiak, N., Meixner, M., Ueta, T., et al. 2008, ApJ, 677, 382
- Skrutskie et al. (2006) Skrutskie, M. F., Cutri, R. M., Stiening, R., et al. 2006, AJ, 131, 1163
- Soszyński et al. (2009a) Soszyński, I., Udalski, A., Szymański, M. K., et al. 2009a, Acta Astron., 59, 239
- Soszyński et al. (2008) Soszyński, I., Udalski, A., Szymański, M. K., et al. 2008, Acta Astron., 58, 293
- Soszyński et al. (2009b) Soszyński, I., Udalski, A., Szymański, M. K., et al. 2009b, Acta Astron., 59, 335
- Szczerba et al. (2007) Szczerba, R., Siódmiak, N., Stasińska, G., & Borkowski, J. 2007, A&A, 469, 799
- Takeda et al. (2007) Takeda, Y., Taguchi, H., Yoshioka, K., et al. 2007, PASJ, 59, 1127
- Thackeray (1962) Thackeray, A. D. 1962, MNRAS, 124, 251
- Tisserand et al. (2008) Tisserand, P., Marquette, J. B., Wood, P. R., et al. 2008, A&A, 481, 673
- Trams et al. (1999) Trams, N. R., van Loon, J. T., Waters, L. B. F. M., et al. 1999, A&A, 346, 843
- Trams et al. (1991) Trams, N. R., Waters, L. B. F. M., Lamers, H. J. G. L. M., et al. 1991, A&AS, 87, 361
- Udalski et al. (2008) Udalski, A., Szymanski, M. K., Soszynski, I., & Poleski, R. 2008, Acta Astron., 58, 69
- Ueta & Meixner (2003) Ueta, T. & Meixner, M. 2003, ApJ, 586, 1338
- Ueta et al. (2000) Ueta, T., Meixner, M., & Bobrowsky, M. 2000, ApJ, 528, 861
- Van de Steene et al. (2000) Van de Steene, G. C., van Hoof, P. A. M., & Wood, P. R. 2000, A&A, 362, 984
- van der Marel et al. (2002) van der Marel, R. P., Alves, D. R., Hardy, E., & Suntzeff, N. B. 2002, AJ, 124, 2639
- van der Marel & Cioni (2001) van der Marel, R. P. & Cioni, M. 2001, AJ, 122, 1807
- van der Veen et al. (1989) van der Veen, W. E. C. J., Habing, H. J., & Geballe, T. R. 1989, A&A, 226, 108
- Van Winckel (2003) Van Winckel, H. 2003, ARA&A, 41, 391
- Van Winckel (2007) Van Winckel, H. 2007, Baltic Astronomy, 16, 112
- Van Winckel et al. (2009) Van Winckel, H., Lloyd Evans, T., Briquet, M., et al. 2009, A&A, 505, 1221
- Van Winckel & Reyniers (2000) Van Winckel, H. & Reyniers, M. 2000, A&A, 354, 135
- Van Winckel et al. (1999) Van Winckel, H., Waelkens, C., Fernie, J. D., & Waters, L. B. F. M. 1999, A&A, 343, 202
- Van Winckel et al. (1995) Van Winckel, H., Waelkens, C., & Waters, L. B. F. M. 1995, A&A, 293, L25
- Vassiliadis & Wood (1993) Vassiliadis, E. & Wood, P. R. 1993, ApJ, 413, 641
- Verhoelst et al. (2009) Verhoelst, T., Waters, L. B. F. M., Verhoeff, A., et al. 2009, A&A, 503, 837
- Volk & Kwok (1989) Volk, K. M. & Kwok, S. 1989, ApJ, 342, 345
- Waters et al. (1992) Waters, L. B. F. M., Trams, N. R., & Waelkens, C. 1992, A&A, 262, L37
- Werner et al. (2004) Werner, M. W., Roellig, T. L., Low, F. J., et al. 2004, ApJS, 154, 1
- Whitney et al. (2008) Whitney, B. A., Sewilo, M., Indebetouw, R., et al. 2008, AJ, 136, 18
- Wood et al. (1999) Wood, P. R., Alcock, C., Allsman, R. A., et al. 1999, in IAU Symposium, Vol. 191, Asymptotic Giant Branch Stars, ed. T. Le Bertre, A. Lebre, & C. Waelkens, 151–+
- Wood & Cohen (2001) Wood, P. R. & Cohen, M. 2001, in Astrophysics and Space Science Library, Vol. 265, Astrophysics and Space Science Library, ed. R. Szczerba & S. K. Górny, 71–+
- Wood & Nicholls (2009) Wood, P. R. & Nicholls, C. P. 2009, ApJ, 707, 573
- Wood et al. (2004) Wood, P. R., Olivier, E. A., & Kawaler, S. D. 2004, ApJ, 604, 800
- Woods et al. (2011) Woods, P. M., Oliveira, J. M., Kemper, F., et al. 2011, MNRAS, 411, 1597
- Zaritsky et al. (2004) Zaritsky, D., Harris, J., Thompson, I. B., & Grebel, E. K. 2004, AJ, 128, 1606
| Observed Features | Feature Identification | ||||||||||
|---|---|---|---|---|---|---|---|---|---|---|---|
| (Å) | (Å) | ||||||||||
| J045433.85 | J045729.38a𝑎aa𝑎aIt seems anomalous that an apparent P Cygni structure is seen at H and H, whereas the emission appears symmetrical with no sign of absorption at H and H. The alternative, that the emission and absorption appear in different objects, is unattractive unless we see a binary with a high velocity amplitude as the absorption components are blueshifted. Higher resolution spectra would be useful. | J054034.00 | J051525.45 | J060323.20 | |||||||
| b | 3651.93 | ||||||||||
| 3680.68 | |||||||||||
| 3688.25 | |||||||||||
| 3730.12 | [OII](1F) | 3726.16 | |||||||||
| 3728.91 | |||||||||||
| 3762.91 | |||||||||||
| A | 3800.26 | HI(2) | 3797.90 | ||||||||
| A | 3837.59 | A | 3835.07 | HI(2) | 3835.39 | ||||||
| A | 3871.90 | ||||||||||
| A | 3891.57 | A | 3890.56 | A | 3892.08 | HI(2) | 3889.05 | ||||
| 3903.68 | TiII(34) | 3900.55 | |||||||||
| 3915.78 | |||||||||||
| A | 3930.42 | A | 3930.42 | A | 3932.43 | ||||||
| 3936.48 | CaII(1) | 3933.68 | |||||||||
| 3971.29 | A | 3968.77 | A | 3970.79 | A | 3970.79 | HI(1) | 3970.07 | |||
| CaII(1) | 3968.47 | ||||||||||
| b | 3995.36 | [NiII](4F) | 3993.15 | ||||||||
| 4029.82 | HeI(18) | 4026.19 | |||||||||
| ? | 4070.68 | [SII](2F) | 4068.60 | ||||||||
| NiII(11) | 4067.05 | ||||||||||
| A | 4100.36 | A | 4103.39 | HI(1) | 4101.74 | ||||||
| 4104.90 | P | 4106.41 | 4107.01 | HI(1) | 4101.74 | ||||||
| 4147.97 | |||||||||||
| 4173.01 | |||||||||||
| d | 4179.06 | 4181.58 | b | 4180.67 | FeII(27) | 4173.45 | |||||
| [FeII](21F) | 4177.21 | ||||||||||
| FeII(28) | 4178.86 | ||||||||||
| c | 4236.58 | 4237.59 | 4235.58 | FeII(27) | 4233.17 | ||||||
| c | 4247.67 | 4246.76 | [FeII](21F) | 4243.98 | |||||||
| 4279.96 | c | 4280.06 | [FeII](21F) | 4276.63 | |||||||
| 4291.57 | c | 4290.16 | c | 4292.08 | [FeII](7F) | 4287.40 | |||||
| c | 4301.69 | c | 4303.86 | ||||||||
| 4304.19 | c | 4306.48 | c | 4303.68 | |||||||
| 4318.32 | |||||||||||
| A | 4339.00 | A | 4340.65 | HI(1) | 4340.47 | ||||||
| c | 4343.03 | P | 4345.55 | 4344.64 | 4346.56 | HI(1) | 4340.47 | ||||
| 4356.15 | FeII(27) | 4351.76 | |||||||||
| 4362.71 | 4361.29 | [FeII](7F) | 4359.34 | ||||||||
| A | 4388.14 | ||||||||||
| 4398.33 | |||||||||||
| 4419.17 | 4421.15 | 4419.39 | [FeII](6F) | 4416.27 | |||||||
| 4447.43 | A | 4445.86 | |||||||||
| 4455.50 | c | 4455.73 | [FeII](7F) | 4452.11 | |||||||
| 4461.04 | [FeII](6F) | 4457.95 | |||||||||
| 4471.64 | |||||||||||
| 4477.19 | 4476.41 | A | 4480.17 | HeI(14) | 4471.5 | ||||||
| [FeII](7F) | 4474.91 | ||||||||||
| 4494.34 | 4494.30 | b | 4495.08 | [FeII](6F) | 4488.75 | ||||||
| 4505.45 | |||||||||||
| 4513.02 | c | 4512.97 | FeII(38) | 4508.28 | |||||||
| 4520.08 | c | 4520.54 | FeII(37) | 4515.34 | |||||||
| 4525.62 | c | 4526.09 | 4524.34 | FeII(37) | 4520.22 | ||||||
| FeII(38) | 4522.63 | ||||||||||
| 4537.23 | |||||||||||
| 4553.38 | c | 4554.34 | FeII(38) | 4549.47 | |||||||
| 4560.43 | c | 4559.89 | FeII(37) | 4555.89 | |||||||
| 4567.00 | |||||||||||
| 4576.58 | MgI(1) | 4571.10 | |||||||||
| 4588.19 | 4587.14 | 4587.92 | 4589.16 | 4588.15 | FeII(38) | 4583.83 | |||||
| 4620.48 | |||||||||||
| 4623.50 | |||||||||||
| 4634.10 | 4633.56 | 4633.31 | FeII(37) | 4629.34 | |||||||
| 4642.17 | ?[FeII](4F) | 4639.68 | |||||||||
| b | 4671.39 | ||||||||||
| 4732.49 | 4732.71 | [FeII](4F) | 4728.07 | ||||||||
| 4738.50 | |||||||||||
| 4779.41 | [FeII](20F) | 4774.74 | |||||||||
| 4783.40 | |||||||||||
| 4788.44 | |||||||||||
| 4819.17 | 4818.99 | [FeII](20F) | 4814.55 | ||||||||
| 4828.25 | |||||||||||
| A | 4860.45 | HI(1) | 4861.33 | ||||||||
| 4865.09 | 4866.64 | 4865.91 | P | 4868.02 | 4866.04 | HI(1) | 4861.33 | ||||
| 4894.34 | 4894.67 | [FeII](4F) | 4889.63 | ||||||||
| 4909.48 | 4906.77 | ||||||||||
| 4928.14 | 4928.70 | 4927.97 | 4928.55 | 4930.12 | FeII(42) | 4923.92 | |||||
| 5010.38 | |||||||||||
| 5022.49 | 5023.56 | 5023.31 | 5024.42 | 5023.46 | FeII(42) | 5018.43 | |||||
| c | 5163.27 | 5162.66 | [FeII](18F) | 5158.0 | |||||||
| c | 5172.84 | 5174.41 | 5173.25 | 5173.77 | c | 5176.33 | FeII(42) | 5169.0 | |||
| 5186.52 | |||||||||||
| 5201.52 | 5202.66 | 5202.01 | FeII(49) | 5197.6 | |||||||
| 5224.72 | 5224.72 | [FeII](19F) | 5220.1 | ||||||||
| 5239.35 | 5239.99 | 5238.33 | FeII(49) | 5234.6 | |||||||
| c | 5266.10 | 5266.09 | [FeII](19F) | 5261.6 | |||||||
| c | 5279.22 | 5280.36 | 5278.20 | c | 5282.23 | 5279.16 | [FeII](18F) | 5273.4 | |||
| c | 5288.78 | FeII(41) | 5284.1 | ||||||||
| 5321.09 | 5322.23 | 5321.58 | 5321.58 | 5321.05 | FeII(49) | 5316.6 | |||||
| 5337.74 | 5338.73 | [FeII](19F ) | 5333.6 | ||||||||
| 5367.00 | 5367.14 | b | 5366.99 | 5366.44 | ([FeII](17F) | 5362.1 | |||||
| FeII(48) | 5362.9 | ||||||||||
| 5380.63 | ? | 5379.61 | [FeII](19F) | 5376.5 | |||||||
| 5416.95 | [FeII](17F) | 5412.6 | |||||||||
| 5430.58 | 5432.73 | FeII(49) | 5425.3 | ||||||||
| 5436.62 | [FeII](18F) | 5433.1 | |||||||||
| w | 5479.64 | ?[FeII](34F) | 5477.2 | ||||||||
| 5531.48 | 5530.96 | [FeII](17F) | 5527.33 | ||||||||
| 5539.18 | FeII(55) | 5534.9 | |||||||||
| 5567.44 | |||||||||||
| 5576.33 | |||||||||||
| 5632.43 | |||||||||||
| 5641.51 | |||||||||||
| w | 5658.76 | ||||||||||
| 5749.97 | |||||||||||
| 5938.27 | |||||||||||
| 5884.19 | |||||||||||
| b | 5897.60 | NaI(1) | 5889.95 | ||||||||
| 5895.92 | |||||||||||
| w | 5903.46 | ||||||||||
| 5996.69 | FeII(46) | 5991.4 | |||||||||
| 6082.19 | |||||||||||
| 6304.97 | 6307.49 | c | 6305.69 | 6306.71 | [OI](1F) | 6300.23 | |||||
| 6325.15 | b | 6323.85 | 6326.38 | ||||||||
| 6369.64 | c | 6368.25 | [OI](1F) | 6363.88 | |||||||
| 6390.32 | b | 6388.93 | FeII | 6383.7 | |||||||
| 6438.25 | |||||||||||
| 6463.97 | c | 6462.97 | c | 6465.12 | 6462.23 | FeII(74) | 6456.4 | ||||
| c | 6468.53 | ||||||||||
| 6498.78 | b | 6496.39 | FeII | 6491.3, | |||||||
| 6493.0 | |||||||||||
| 6522.00 | 6523.51 | c | 6522.13 | FeII(40) | 6516.0 | ||||||
| c | 6547.22 | ||||||||||
| 6555.07 | [NII](1F) | 6548.1 | |||||||||
| A | 6561.62 | HI(1) | 6562.82 | ||||||||
| 6568.42 | 6570.44 | c | 6568.68 | P | 6571.72 | 6569.48 | HI(1) | 6562.82 | |||
| c | 6588.10 | c | 6589.23 | [NII](1F) | 6583.6 | ||||||
| 6672.85 | c | 6672.48 | [NiII](2F) | 6666.78 | |||||||
| 6683.25 | HeI(46) | 6678.15 | |||||||||
| 6706.46 | |||||||||||
| ? | 6721.39 | 6722.65 | w | 6726.44 | [SII](2F) | 6717.0 | |||||
| 6736.78 | w | 6736.24 | [FeII](31F) | 6729.85 | |||||||
| [SII](2F) | 6730.8 | ||||||||||
| w | 6754.90 | ||||||||||
| 6877.93 | |||||||||||
| 6948.05 | 6947.89 | ||||||||||
| c | 7006.87 | ||||||||||
| c | 7016.46 | ||||||||||
| b | 7063.69 | ||||||||||
| 7090.62 | |||||||||||
| b | 7106.77 | ||||||||||
| 7161.56 | 7160.70 | [FeII](14F) | 7155.14 | ||||||||
| 7178.21 | d | 7177.11 | [FeII](14F) | 7171.98 | |||||||
| 7277.55 | |||||||||||
| 7297.78 | 7298.50 | ?[CaII](1F) | 7291.46 | ||||||||
| 7315.43 | 7313.63 | FeII(73) | 7307.97 | ||||||||
| 7330.07 | c | 7328.77 | ?[CaII](1F) | 7323.88 | |||||||
| c | 7384.06 | c | 7383.77 | [NiII](2F) | 7377.88 | ||||||
| 7394.65 | [FeII](14F) | 7388.16 | |||||||||
| 7417.87 | 7417.07 | [NiII](2F) | 7411.57 | ||||||||
| 7458.22 | ? | 7458.93 | [FeII](14F) | 7452.50 | |||||||
| 7468.32 | FeII(73) | 7462.38 | |||||||||
| c | 7475.08 | NI(3) | 7468.29 | ||||||||
| c | 7503.63 | ||||||||||
| 7519.78 | c | 7522.30 | 7518.98 | FeII(73) | 7515.88 | ||||||
| c | 7667.01 | c | 7665.78 | ||||||||
| 7718.05 | 7719.48 | 7717.26 | FeII(73) | 7711.71 | |||||||
| A | 7780.00 | 7782.54 | ? | 7784.95 | 7784.80 | 7787.71 | OI(1)b𝑏bb𝑏bThe triplet at 7774 Å is normally seen in absorption and is a useful luminosity criterion from late B to early G type stars, becoming very strong in the most luminous supergiants. It may appear in emission when the line at 8446 Å is strongly in emission. A caveat is that, given our lower resolution, the emission line near 8446 Å must be a blend of the OI triplet with the stronger unidentified line found by Thackeray (1962). | 7773.18 | |||
| 7869.71 | |||||||||||
| 7874.37 | ? | 7866.49 | |||||||||
| 7904.64 | |||||||||||
| 8007.65 | 8005.93 | [CrII](1F) | 8000.12 | ||||||||
| 8131.27 | [CrII](1F) | 8125.50 | |||||||||
| c | 8228.53 | ||||||||||
| b | 8238.22 | c | 8236.09 | [CrII](1F) | 8229.81 | ||||||
| 8295.15 | 8294.11 | 8292.24 | 8296.26 | ? | 8287.31 | ||||||
| 8314.41 | [CrII](1F) | 8308.68 | |||||||||
| 8341.56 | HI(11) | 8333.78 | |||||||||
| 8355.18 | HI(11) | 8345.55 | |||||||||
| 8367.30 | HI(11) | 8359.01 | |||||||||
| 8382.43 | 8382.01 | HI(11) | 8374.48 | ||||||||
| 8400.09 | 8394.88 | 8399.69 | HI(11) | 8392.40 | |||||||
| 8421.28 | 8421.12 | 8420.36 | HI(10) | 8413.32 | |||||||
| 8453.14 | c | 8455.08 | 8453.03 | 8453.19 | 8454.19 | OI(4)b𝑏bb𝑏bThe triplet at 7774 Å is normally seen in absorption and is a useful luminosity criterion from late B to early G type stars, becoming very strong in the most luminous supergiants. It may appear in emission when the line at 8446 Å is strongly in emission. A caveat is that, given our lower resolution, the emission line near 8446 Å must be a blend of the OI triplet with the stronger unidentified line found by Thackeray (1962). | 8446.48 | ||||
| ? | 8450.88 | ||||||||||
| 8476.26 | 8475.61 | 8477.41 | 8474.37 | HI(10) | 8467.26 | ||||||
| c | 8497.46 | ? | 8489.93 | ||||||||
| 8505.63 | c | 8511.07 | c | 8505.18 | 8507.17 | 8507.66 | HI(10) | 8502.49 | |||
| CaII(2) | 8998.02 | ||||||||||
| 8549.51 | 8552.96 | 8549.86 | 8550.56 | 8552.24 | HI(10) | 8545.38 | |||||
| CaII(2) | 8542.09 | ||||||||||
| 8605.42 | 8606.94 | 8605.08 | 8605.55 | c | 8606.24 | HI(9) | 8598.39 | ||||
| 8623.69 | [FeII](13F) | 8616.96 | |||||||||
| 8639.23 | NI(8) | 8629.24 | |||||||||
| 8669.58 | 8673.03 | 8670.44 | 8671.73 | 8670.82 | HI(9) | 8665.02 | |||||
| CaII(2) | 8662.14 | ||||||||||
| 8690.69 | |||||||||||
| 8757.88 | 8759.39 | c | 8755.93 | c | 8758.02 | HI(9) | 8750.48 | ||||
| c | 8764.57 | 8761.62 | |||||||||
| 8790.49 | b | 8791.75 | |||||||||
| 8801.34 | c | 8797.24 | |||||||||
| 8825.56 | c | 8822.97 | |||||||||
| 8836.32 | |||||||||||
| 8869.50 | 8872.41 | 8870.96 | 8868.50 | 8871.11 | HI(9) | 8862.79 | |||||
| 8922.36 | |||||||||||
| 8935.48 | c | 8933.77 | ? | 8926.52 | |||||||
| 8989.76 | |||||||||||
| c | 9022.25 | 9023.26 | 9023.51 | ? | 9022.88 | c | 9025.08 | HI(9) | 9014.91 | ||
| b | 9103.28 | ||||||||||
| b | 9186.24 | ||||||||||
| 9213.97 | c | 9213.21 | |||||||||
| c | 9226.09 | ||||||||||
| 9237.19 | c | 9237.19 | 9236.93 | 9238.50 | HI(8) | 9229.02 | |||||
| b | 9280.07 | ||||||||||
| b | 9400.16 | ||||||||||
Appendix A Tables of the subsample of post-AGB candidates with a low-resolution, optical spectrum
We display all data for the post-AGB candidates in our final sample that have a spectrum in three tables subdivided into the three subclasses based on the shape of the SED.
| Object | Right Ascension | Declination | Spectral Typea𝑎aa𝑎aAll spectral types indicated with a superscript a were found in the catalogue of massive stars of Bonanos et al. (2009), the others were determined based on our low-resolution, optical spectra. | Variabilityb𝑏bb𝑏bThe variability remarks are based on both the luminosity curves as discussed in Sect. 5.2 and cross-correlation with the catalogue of Fraser et al. (2008). The latter is indicated with ’Fr’ with the correct sequence in subscript. Sequences 9, 0 and -99 indicate subsequently that the star is identified with the One-Year Artifact which is caused by the annual observing schedule of the MACHO project, that the star is outside the boundaries of any period-luminosity classification, or that Fraser et al. (2008) were unable to classify this object. The other abbreviations used to characterise the variability of the different objects are Population II Cepheids (Ceph.) which include the subclass of RV Tauri stars (RVT), semi-regular variables (SRV) with the subclass of sequence-D variables (Seq. D) that were recognized by us, objects with lightcurves in Fig. 18 that show long-term, slow variations (SV), R CrB stars (R CrB), objects in regions of very strong nebular emission (em), Ae and Be stars (AB) and objects that do not show strong evidence of variability (NV). For all Population II Cepheids, the periods we computed between deep minima or two cycles of the light curve if the minima are of equal depth, are listed in days. | Remarksc𝑐cc𝑐cThe final column contains the empirically confirmed cross-matches of the object in the catalogues of Sect. 5.1.3 with ’A’ standing for the RV T stars listed in the recent OGLE-III Catalogue of Variable Stars (Soszyński et al. 2008), ’B’ for the R CrB stars in Soszyński et al. (2009b), ’C’ for the MSX post-AGB stars of Wood & Cohen (2001), ’D’ are the YSOs from Seale et al. (2009), ’E’ the AGB stars from Trams et al. (1999), ’F’ the PNe in Reid & Parker (2006) and ’G’ the galaxies in the line of sight of the LMC from NED. | ||||
|---|---|---|---|---|---|---|---|---|---|
| (h:m:s) | (d:m:s) | () | () | (K) | |||||
| J044458.39-703522.6 | 04:44:58.39 | -70:35:22.6 | 2000 | F2IIpe! | Ceph. (47.60004) | ||||
| J045243.16-704737.3 | 04:52:43.17 | -70:47:37.4 | 2000 | F7IIp(e) | SV | ||||
| J045623.21-692749.0 | 04:56:23.21 | -69:27:49.0 | 6000 | K3Ibp(e) | SV, Fr-99 | ||||
| J050143.46-694048.4 | 05:01:43.47 | -69:40:48.5 | 2000 | G0Ibp | SV | ||||
| J050304.95-684024.7 | 05:03:04.96 | -68:40:24.8 | 3000 | F7-9Ibpe | Ceph. (63.51), RVT | AG | |||
| J051159.40-692532.9 | 05:11:59.40 | -69:25:33.0 | 11000 | F5Ibp | Ceph. (47.92) | ||||
| J051333.74-663418.9d𝑑dd𝑑dThis star is unique in our sample in combining a solar type, with unusually strong broad Ca II absorption, and emission of He I (Table 2). | 05:13:33.74 | -66:34:19.0 | 20000 | F8-G0Ipe | NV | ||||
| J051418.09-691234.9 | 05:14:18.10 | -69:12:35.0 | 7000 | F7-9Ibpe | Ceph. (96.745), RVT | AG | |||
| J051845.47-690321.8 | 05:18:45.47 | -69:03:21.8 | 4000 | F2-4Ibpe | Ceph. (71.505), RVT | AG | |||
| J052221.13-655551.6 | 05:22:21.14 | -65:55:51.6 | 4000 | K2-3IIp | SV | ||||
| J052519.48-705410.0 | 05:25:19.49 | -70:54:10.0 | 3000 | G0Ib | Ceph. (67.600), RVT | AG | |||
| J052627.23-664258.7 | 05:26:27.23 | -66:42:58.7 | 4000 | F6Ibp | Ceph. (71.537) | G | |||
| J053253.51-695915.1 | 05:32:53.51 | -69:59:15.1 | 1200 | G5 | Ceph. (91.04) | ||||
| J053336.35-692312.6 | 05:33:36.35 | -69:23:12.7 | 19000 | G8pe | SRV, Fr-99 | G | |||
| J053453.75-690802.0 | 05:34:53.76 | -69:08:02.1 | 30000 | K2:Ib(e) | SRV | ||||
| J053605.89-695802.6 | 05:36:05.90 | -69:58:02.7 | 6000 | F2III: | SV | G | |||
| J054312.86-683357.1 | 05:43:12.86 | -68:33:57.2 | 3000 | F7Ibp | Ceph. (61.933), RVT | A | |||
| J054333.39-662202.8 | 05:43:33.39 | -66:22:02.9 | 5000 | G8II | NV, Fr9 | ||||
| J055326.02-665851.5 | 05:53:26.03 | -66:58:51.6 | 3000 | G0Ibpe | Ceph. (62.444) |
| Object | Right Ascension | Declination | Spectral Typea𝑎aa𝑎aAll spectral types indicated with a superscript a were found in the catalogue of massive stars of Bonanos et al. (2009), the others were determined based on our low-resolution, optical spectra. | Variabilityb𝑏bb𝑏bfootnotemark: | Remarksc𝑐cc𝑐cfootnotemark: | ||||
|---|---|---|---|---|---|---|---|---|---|
| (h:m:s) | (d:m:s) | () | () | (K) | |||||
| J045140.74-674456.9 | 04:51:40.75 | -67:44:57.0 | 4000 | F0II: | Ceph. (54.1438), Fr0 | ||||
| J045330.05-691749.5 | 04:53:30.06 | -69:17:49.5 | 30000 | similar to Of/Of?pa | G | ||||
| J050138.22-685831.6 | 05:01:38.23 | -68:58:31.6 | 11000 | G7 | SV, Fr-99 | ||||
| J050629.89-682409.0 | 05:06:29.89 | -68:24:09.0 | 1300 | ? | |||||
| J050632.10-714229.8 | 05:06:32.11 | -71:42:29.9 | 6000 | A3Iab / F0Ibp(e) | Ceph. (49.1) | ||||
| J051110.64-661253.7 | 05:11:10.64 | -66:12:53.8 | 8000 | F3II(e) | SRV, Fr-99 | ||||
| J051213.79-693537.1 | 05:12:13.79 | -69:35:37.1 | 6000 | K2: | SRV, Fr1 | ||||
| J051525.45-661905.0 | 05:15:25.45 | -66:19:05.0 | 3000 | Ae | SV, em | ||||
| J051624.89-690000.8 | 05:16:24.90 | -69:00:00.9 | 4000 | A5I | |||||
| J051848.84-700247.0 | 05:18:48.85 | -70:02:47.0 | 6000 | F4Ib-II(e) | SRV, Fr1 | ||||
| J052031.12-680057.2 | 05:20:31.12 | -68:00:57.3 | 14000 | ? | |||||
| J052043.86-692341.0 | 05:20:43.87 | -69:23:41.0 | 6000 | F5Ib(e) | SRV, Fr1 | ||||
| J052340.49-680528.2 | 05:23:40.49 | -68:05:28.3 | 3000 | B3Iep | |||||
| J052414.62-684110.0 | 05:24:14.62 | -68:41:10.1 | 4000 | B0e | AB | ||||
| J052429.44-693723.7 | 05:24:29.45 | -69:37:23.7 | 6000 | A2I-II | |||||
| J052520.76-705007.5 | 05:25:20.76 | -70:50:07.6 | 4000 | A1Ia | AB, Fr0 | ||||
| J053011.67-710559.7 | 05:30:11.67 | -71:05:59.8 | 9000 | B0.5Va | |||||
| J053250.69-713925.8 | 05:32:50.70 | -71:39:25.8 | 5000 | F6Ia | SRV, Fr1 | ||||
| J054320.63-674944.8 | 05:43:20.64 | -67:49:44.9 | 6000 | B0.5Va |
| Object | Right Ascension | Declination | Spectral Typea𝑎aa𝑎aAll spectral types indicated with a superscript a were found in the catalogue of massive stars of Bonanos et al. (2009), the others were determined based on our low-resolution, optical spectra. | Variabilityb𝑏bb𝑏bfootnotemark: | Remarksc𝑐cc𝑐cfootnotemark: | ||||
|---|---|---|---|---|---|---|---|---|---|
| (h:m:s) | (d:m:s) | () | () | (K) | |||||
| J044555.34-705041.7 | 04:45:55.34 | -70:50:41.8 | 4000 | ? (e) | |||||
| J045444.13-701916.1 | 04:54:44.14 | -70:19:16.1 | 20000 | M0 (III) | |||||
| J045515.73-701742.1 | 04:55:15.74 | -70:17:42.2 | 4000 | A3II | |||||
| J045543.20-675110.1 | 04:55:43.20 | -67:51:10.1 | 3000 | G2-8(R)Ibe: | Ceph. (112.828), RVT | A | |||
| J045615.77-682042.3 | 04:56:15.77 | -68:20:42.3 | 1900 | K7 | SRV, Seq. D, FrD | ||||
| J045655.23-682732.9 | 04:56:55.23 | -68:27:33.0 | 4000 | G1Ibp | |||||
| J050338.93-690158.6 | 05:03:38.93 | -69:01:58.7 | 4000 | A0e | AB | ||||
| J050431.84-691741.4 | 05:04:31.84 | -69:17:41.4 | 1800 | A(e) | AB | ||||
| J050529.01-644609.1 | 05:05:29.02 | -64:46:09.2 | 1800 | K1p(e) | |||||
| J050718.33-690742.9 | 05:07:18.34 | -69:07:42.9 | 12000 | A7II / A9I | C | ||||
| J050733.83-692119.9 | 05:07:33.84 | -69:21:19.9 | 2000 | C | SRV, Seq. D, FrD | ||||
| J050830.51-692237.4 | 05:08:30.52 | -69:22:37.4 | 8000 | A0-1IV (field star) / C | SRV | ||||
| J051036.77-662543.4 | 05:10:36.77 | -66:25:43.5 | 1500 | K1II | NV | ||||
| J051123.63-700157.4 | 05:11:23.64 | -70:01:57.4 | 5000 | ? | SV, em | F | |||
| J051450.04-692735.3 | 05:14:50.05 | -69:27:35.3 | 1700 | F3 + K3 | Ceph. (54.785), Fr9 | ||||
| J051453.10-691723.5 | 05:14:53.10 | -69:17:23.5 | 2000 | K2II | NV | ||||
| J051917.29-693147.3 | 05:19:17.29 | -69:31:47.3 | 3000 | K2II | |||||
| J052552.26-660754.4 | 05:25:52.26 | -66:07:54.4 | 4000 | K3II | NV | ||||
| J052722.11-694710.1 | 05:27:22.12 | -69:47:10.2 | 20000 | K6 | SV, Fr-99 | ||||
| J052738.69-705219.0 | 05:27:38.69 | -70:52:19.1 | 2000 | F5I-IIp(e) | G | ||||
| J052836.59-685829.9 | 05:28:36.59 | -68:58:30.0 | 4000 | K | SRV | ||||
| J053009.86-694655.6 | 05:30:09.86 | -69:46:55.7 | 1500 | G-K(e) | SRV, Seq. D | ||||
| J053034.62-680615.3 | 05:30:34.63 | -68:06:15.4 | 1200 | ? | G | ||||
| J053115.55-651923.4 | 05:31:15.55 | -65:19:23.4 | 5000 | K7: | NV, Fr9 | ||||
| J053150.98-691146.4 | 05:31:50.99 | -69:11:46.4 | 8000 | F4-G1Ibpe | Ceph. (93.180), RVT | AG | |||
| J053416.45-695740.4 | 05:34:16.45 | -69:57:40.4 | 5000 | M4 | SRV, Seq. D, FrD | ||||
| J053444.17-673750.1 | 05:34:44.17 | -67:37:50.2 | 3000 | G | |||||
| J053455.93-694428.7 | 05:34:55.94 | -69:44:28.7 | 3000 | K3pe | SRV, Seq. D, Fr-99 | ||||
| J053505.62-691923.2 | 05:35:05.62 | -69:19:23.3 | 3000 | K3II | |||||
| J053642.47-700747.0 | 05:36:42.47 | -70:07:47.1 | 8000 | M0(III) | |||||
| J054310.86-672728.0 | 05:43:10.87 | -67:27:28.0 | 11000 | M0 | |||||
| J055122.52-695351.4 | 05:51:22.53 | -69:53:51.5 | 4000 | F6-8Ibpe | Ceph. (68.874), RVT | AG |
Appendix B Table of all objects that have a low-resolution, optical spectrum but are no longer part of the post-AGB sample
| Object | Right Ascension | Declination | Subsample | Spectral Typea𝑎aa𝑎aAll spectral types indicated with a superscript a were found in the catalogue of massive stars of Bonanos et al. (2009), the others were determined based on our low-resolution, optical spectra. | Reason | ||||
|---|---|---|---|---|---|---|---|---|---|
| (h:m:s) | (d:m:s) | () | () | (K) | |||||
| J044904.66-690455.0 | 04:49:04.67 | -69:04:55.0 | disc or shell | 3000 | O-B | F | |||
| J044922.46-692434.5 | 04:49:22.46 | -69:24:34.5 | disc or shell | 90000 | M | C | |||
| J044943.46-691955.3 | 04:49:43.47 | -69:19:55.4 | shell | 1500 | O-B | F | |||
| J044957.99-702102.6 | 04:49:57.99 | -70:21:02.6 | B5II-III | A | |||||
| J045433.85-692036.2 | 04:54:33.85 | -69:20:36.3 | disc or shell | 10000 | B[e] | F | |||
| J045503.04-692912.7 | 04:55:03.05 | -69:29:12.8 | disc or shell | 170000 | M2 | C | |||
| J045521.62-694716.8 | 04:55:21.62 | -69:47:16.8 | disc or shell | 100000 | M | C | |||
| J045617.53-661818.9 | 04:56:17.54 | -66:18:19.0 | shell | 19000 | B2.5Iaba | F | |||
| J045658.29-663133.2 | 04:56:58.30 | -66:31:33.2 | shell | 15000 | O9-9.5IIIa | F | |||
| J045724.33-663416.2 | 04:57:24.00 | -66:34:15.0 | B2:Ie | A | |||||
| J045729.38-661837.3 | 04:57:29.38 | -66:18:37.4 | disc or shell | 4000 | B:e | F | |||
| J045731.51-700859.4 | 04:57:31.52 | -70:08:59.4 | disc or shell | 90000 | M | C | |||
| J045850.87-672640.5 | 04:58:50.88 | -67:26:40.5 | shell | 20000 | B0IIIa | F | |||
| J045907.37-654313.3 | 04:59:07.38 | -65:43:13.4 | shell | 30000 | O9ep / B1-2ep | F | |||
| J050303.97-663345.9 | 05:03:03.98 | -66:33:45.9 | disc or shell | 2000 | Galaxy | E | |||
| J050351.50-685724.2 | 05:03:51.00 | -68:57:24.0 | B2Ie | A | |||||
| J050428.89-682615.9 | 05:04:28.90 | -68:26:15.9 | shell | 20000 | B1IIIa | F | |||
| J050451.70-663807.5 | 05:04:51.71 | -66:38:07.6 | shell | 8000 | B0e | F | |||
| J050457.64-670511.9 | 05:04:57.64 | -67:05:12.0 | disc or shell | 6000 | C-J | D | |||
| J050524.35-673435.4 | 05:05:24.35 | -67:34:35.5 | shell | 5000 | Galaxy | E | |||
| J050533.50-703346.8 | 05:05:33.51 | -70:33:46.9 | disc or shell | 90000 | M - M4Ia | C | |||
| J050535.21-685928.9 | 05:05:35.22 | -68:59:29.0 | shell | 20000 | B1.5 | F | |||
| J050828.07-684825.2 | 05:08:28.07 | -68:48:25.2 | shell | 9000 | O8.5V + O9Va | F | |||
| J050945.15-684610.0 | 05:09:45.15 | -68:46:10.0 | shell | 50000 | B4Ia / B4Iae - B3Iaba | C | |||
| J051037.47-662514.9 | 05:10:37.47 | -66:25:14.9 | shell | 800 | G2V (Field) | C | |||
| J051147.92-692342.3 | 05:11:47.92 | -69:23:42.3 | disc or shell | 1700 | O-B - PN | E | |||
| J051209.02-710649.7 | 05:12:09.02 | -71:06:49.7 | disc or shell | 10000 | B8I-IIe | F | |||
| J051213.13-680455.5 | 05:12:13.14 | -68:04:55.5 | disc | 210000 | M0.5 | C | |||
| J051236.70-663822.2 | 05:12:36.71 | -66:38:22.3 | disc or shell | 6000 | O8II:e (e) | F | |||
| J051246.83-641411.2 | 05:12:46.84 | -64:14:11.2 | K4 (Field) | B | |||||
| J051327.70-693111.5 | 05:13:27.71 | -69:31:11.6 | shell | 15000 | B1IIIa | F | |||
| J051424.45-720705.5 | 05:14:24.46 | -72:07:05.5 | disc or shell | 1200 | Galaxy | E | |||
| J051648.08-692222.0 | 05:16:48.08 | -69:22:22.0 | shell | 1800 | O-B | F | |||
| J051654.04-672005.1 | 05:16:54.05 | -67:20:05.1 | disc or shell | 8000 | O-B - PN | E | |||
| J051814.34-691501.3 | 05:18:14.35 | -69:15:01.3 | shell | 170000 | A0e - LBV Sk -69 94a | C | |||
| J051830.30-693754.7 | 05:18:30.30 | -69:37:54.8 | shell | 30000 | B3II: (e) / B4II-III (e) | F | |||
| J051852.75-683848.9 | 05:18:52.76 | -68:38:48.9 | shell | 1200 | Galaxy | E | |||
| J052023.60-693326.8 | 05:20:23.60 | -69:33:26.8 | disc or shell | 110000 | M3Iab: - M3Ia | C | |||
| J052026.68-695125.4 | 05:20:26.69 | -69:51:25.5 | shell | 5000 | Galaxy | E | |||
| J052127.96-693016.1 | 05:21:27.96 | -69:30:16.2 | disc or shell | 80000 | M - M3Ia | C | |||
| J052131.77-682058.8 | 05:21:31.77 | -68:20:58.8 | shell | 4000 | O-B (e) | F | |||
| J052146.94-711943.9 | 05:21:46.95 | -71:19:44.0 | disc | 130000 | K2p | C | |||
| J052229.16-710814.9 | 05:22:29.16 | -71:08:14.9 | shell | 4000 | Galaxy | E | |||
| J052327.13-670928.1 | 05:23:27.00 | -67:09:28.0 | B1II / B3II | A | |||||
| J052627.37-691055.8 | 05:26:27.38 | -69:10:55.8 | disc or shell | 90000 | M4 - M3Ia | C | |||
| J052630.65-674036.6 | 05:26:30.65 | -67:40:36.6 | shell | 10000 | B1e | F | |||
| J052631.16-684602.4 | 05:26:31.16 | -68:46:02.4 | shell | 15000 | O7Va | F | |||
| J052708.47-703007.1 | 05:27:08.47 | -70:30:07.1 | shell | 14000 | B5IIa | F | |||
| J052800.02-690742.4 | 05:28:00.02 | -69:07:42.5 | disc | 40000 | M1- - M2-3Ia | C | |||
| J052903.46-690646.2 | 05:29:03.46 | -69:06:46.2 | disc or shell | 90000 | M4-5 - M3-4.5a | C | |||
| J053017.49-685926.6 | 05:30:17.49 | -68:59:26.7 | shell | 11000 | O | F | |||
| J053036.40-671742.4 | 05:30:36.41 | -67:17:42.5 | shell | 14000 | B2II Binary (SB1)a | F | |||
| J053147.40-660340.6 | 05:31:47.40 | -66:03:40.7 | disc or shell | 70000 | M4-5 | C | |||
| J053149.89-705753.4 | 05:31:49.90 | -70:57:53.4 | shell | 13000 | B0.5Va | F | |||
| J053218.03-662847.8 | 05:32:18.03 | -66:28:47.8 | shell | 15000 | B0Va | F | |||
| J053232.18-665815.0 | 05:32:32.18 | -66:58:15.1 | disc or shell | 70000 | M2Ib-III / M3-4 | C | |||
| J053308.27-722644.9 | 05:33:08.27 | -72:26:45.0 | disc or shell | 1100 | Galaxy | E | |||
| J053348.94-701323.5 | 05:33:48.94 | -70:13:23.6 | disc or shell | 7000 | WC | E | |||
| J053351.86-672849.5 | 05:33:51.86 | -67:28:49.6 | shell | 18000 | O9Va | F | |||
| J053427.82-660855.6 | 05:34:27.83 | -66:08:55.7 | disc | 900 | G | C | |||
| J053452.85-671620.2 | 05:34:52.86 | -67:16:20.3 | shell | 18000 | O8Va | F | |||
| J053513.47-694947.3 | 05:35:13.47 | -69:49:47.3 | Late O(e) | A | |||||
| J053514.08-674355.8 | 05:35:14.09 | -67:43:55.9 | disc or shell | 90000 | M3-4 | C | |||
| J053539.76-673705.0 | 05:35:39.77 | -67:37:05.1 | shell | 8000 | O-B (e) | F | |||
| J053551.73-690052.7 | 05:35:51.74 | -69:00:52.8 | shell | 9000 | O9.5Ia | F | |||
| J053556.06-714135.4 | 05:35:56.07 | -71:41:35.4 | shell | 1200 | Galaxy | E | |||
| J053557.86-671333.5 | 05:35:57.87 | -67:13:33.6 | disc or shell | 2000 | Galaxy | E | |||
| J053626.76-692351.2 | 05:36:26.77 | -69:23:51.2 | disc or shell | 190000 | K4-5 - K0Ia | C | |||
| J053639.51-662722.8 | 05:36:39.52 | -66:27:22.9 | shell | 10000 | B1-2IIIe - Be (FeII?)a | F | |||
| J053717.92-691952.2 | 05:37:17.93 | -69:19:52.2 | shell | 17000 | B2III | F | |||
| J053718.64-685918.0 | 05:37:18.65 | -68:59:18.1 | shell | 20000 | O9.5Va | F | |||
| J053751.00-690933.8 | 05:37:51.00 | -69:09:33.9 | shell | 30000 | B0.5Ia | F | |||
| J054025.34-691530.2 | 05:40:25.34 | -69:15:30.2 | disc | 60000 | M1- - K7-M0Ia | C | |||
| J054034.00-692509.8 | 05:40:34.01 | -69:25:09.9 | disc or shell | 12000 | B[e] | F | |||
| J054055.84-691614.5 | 05:40:55.85 | -69:16:14.6 | shell | 8000 | O-B | F | |||
| J054059.22-691836.2 | 05:40:59.22 | -69:18:36.2 | disc or shell | 110000 | M4 - M2-3Ia | C | |||
| J054059.87-693840.1 | 05:40:59.87 | -69:38:40.1 | shell | 30000 | B3Ia / B3Ia | F | |||
| J054143.79-693738.3 | 05:41:43.80 | -69:37:38.3 | disc | 8000 | B6[e]Ib/IIa | F | |||
| J054155.20-664421.3 | 05:41:55.20 | -66:44:21.4 | disc or shell | 30000 | F4Iab | F | |||
| J054202.60-702245.3 | 05:42:02.00 | -70:22:45.0 | A1Ib / B8III: | A | |||||
| J054308.40-675053.3 | 05:43:08.40 | -67:50:53.3 | shell | 11000 | O9.5Va | F | |||
| J054401.55-692804.5 | 05:44:01.56 | -69:28:04.5 | disc or shell | 3000 | B | F | |||
| J054412.04-682727.9 | 05:44:12.05 | -68:27:27.9 | disc or shell | 2000 | O (e) | F | |||
| J054427.29-685221.8 | 05:44:27.29 | -68:52:21.9 | shell | 14000 | B9Iab / B7I | F | |||
| J054442.96-695052.9 | 05:44:42.96 | -69:50:52.9 | O-B (e) | A | |||||
| J054529.52-681145.9 | 05:45:29.52 | -68:11:46.0 | disc | 11000 | B5[e]IIa | F | |||
| J055414.26-684020.4 | 05:54:14.27 | -68:40:20.5 | disc or shell | 3000 | C | D | |||
| J055825.96-694425.8 | 05:58:25.96 | -69:44:25.9 | shell | 13000 | WC | E | |||
| J060323.20-680437.5 | 06:03:23.21 | -68:04:37.5 | disc or shell | 1800 | BIe | F |
Appendix C Spectral analysis of the intruders
Fourteen of the low-resolution, optical spectra we took, do not belong to post-AGB stars. We were able to identify nine galaxies, two PN-like objects and two WC-like objects.
C.1 Galaxies
| Object Name (IRAC) | Redshift | Type |
|---|---|---|
| J050303.97-663345.9 | 0.063 | Active galaxy |
| J050524.35-673435.4 | 0.047 | Normal spiral or irregular galaxy |
| J051424.45-720705.5 | 0.027 | Normal spiral or irregular galaxy |
| J051852.75-683848.9 | 0.059 | Starburst galaxy |
| J052026.68-695125.4 | 0.004 | Normal spiral or irregular galaxy |
| J052229.16-710814.9 | 0.036 | Starburst galaxy |
| J053308.25-722644.9 | 0.046 | Normal spiral or irregular galaxy |
| J053556.06-714135.4 | 0.041 | Starburst galaxy |
| J053557.86-671333.5 | 0.078 | Normal spiral or irregular galaxy |
We observed nine objects for which the spectrum does not correspond to a source in the LMC. They all have too high a redshift and are therefore galaxies. Some details on these sources can be found in Table 11. All these objects are listed as galaxies on NASA/IPAC Extragalactic Database (NED)777The NASA/IPAC Extragalactic Database (NED) is operated by the Jet Propulsion Laboratory, California Institute of Technology, under contract with the National Aeronautics and Space Administration.. A redshift is noted only for J050303.97-663345.9 and J053308.25-722644.9 and both values agree with the ones we determined.
C.2 PN-like objects

Two objects in our sample – J051654.04-672005.1 and J051147.92-692342.3 – show emission features of , , [O II], [O III], [N II], [S II], [Ar III] and [Ne III] (see Fig. 23). In addition, He II emission can be seen from J051147.92-692342.3. Both spectra bear resemblance to spectra of H II regions as well as PNe.
The spectrum of J051147.92-692342.3 contains emission features of elements like [O III], [Ar III] and [Ne III] at higher levels of ionisation than can be found in H II regions. The line intensity ratio of [O III] 5007 Å to is about 5, which is somewhat lower than the theoretically expected value of 9 (Reid & Parker 2006), but still compatible with a PN. Since [N II] 6583 Å and He II 4686 Å is also clearly visible, this object is probably a high excitation Type I PN.
The most significant differences in the spectrum of J051654.04-672005.1 with respect to J051147.92-692342.3 are the less prominent features of [O III] and [N II] when compared to the Balmer lines. The line intensity ratio of [O III] 5007 Å to for this object is 0.4, which is incompatible with both classical PNe and H II regions. A very low excitation PN or an extremely compact, low-excitation H II can explain these ratios, however. The latter possibility is supported by the [N II]/ ratio which is well below 0.7 (Kennicutt et al. 2000).
Some of the most prominent features in J051654.04-672005.1 show a P Cygni profile which is indicative of a fast stellar wind. The low-resolution of the spectrum only allows for a rough estimation of the velocity of this wind which turns out to be between 650 and 1050 km/s.
Of the two objects we identified as PNe-like objects, only J051147.92-692342.3 can be found in the PNe catalogue of Reid & Parker (2006).
C.3 Wolf-Rayet carbon star-like objects
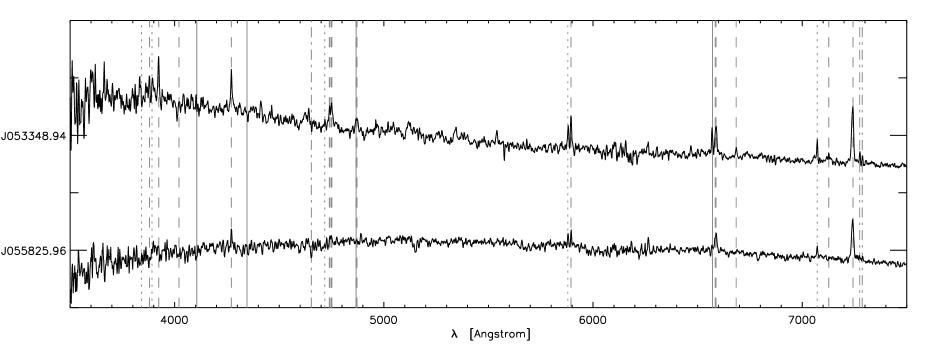
The spectra of J053348.94-701323.5 and J055825.96-694425.8 are clearly distinct from the other spectra, but resemble each other (see Fig. 24). Both spectra are similar to Wolf-Rayet carbon (WC) stars, but the emission lines are rather weak and they lack the C III feature at 5696 Å which is still present even in WC stars of spectral types as late as WC10 (Crowther et al. 1998). The resemblance of both spectra to that of V 348 Sagitarii, a Galactic R CrB star with a very peculiar spectrum (e.g., Leuenhagen & Hamann 1994; Houziaux 1968), makes it plausible that our objects are also of spectral type [WC12]. One of these objects, J053348.94-701323.5, is also listed as an R CrB star by Soszyński et al. (2009b) even though it is not deficient.
C.4 Some additional spectra
In addition to the 105 objects from our sample of post-AGB candidates, we observed 31 bright sources with IR detections, which were originally identified using the first release of the SAGE catalogue of only Epoch 1 data. These objects were not recovered while creating our final list. Most of them were lost due to the black-body luminosity-cut, but some simply do not have the required measurements in the different SAGE catalogues we used to define our final sample or are listed as a cool carbon star by Kontizas et al. (2001) or an AGB star with spectral type by Trams et al. (1999). For these objects, and some objects with a low-resolution, optical spectrum that were later on discarded from our final sample, we list the spectral types and the reason why they are no longer in our final catalogue in Table LABEL:list_delobj.
Appendix D SEDs of all post-AGB candidates with a known spectral type
D.1 Post-AGB candidates with a disc
1
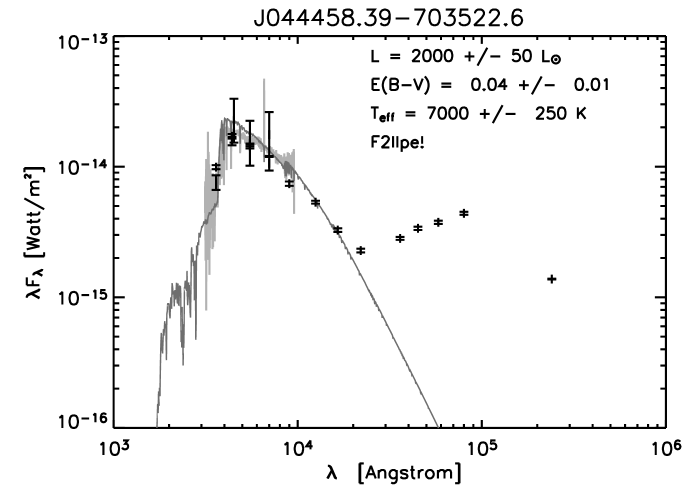

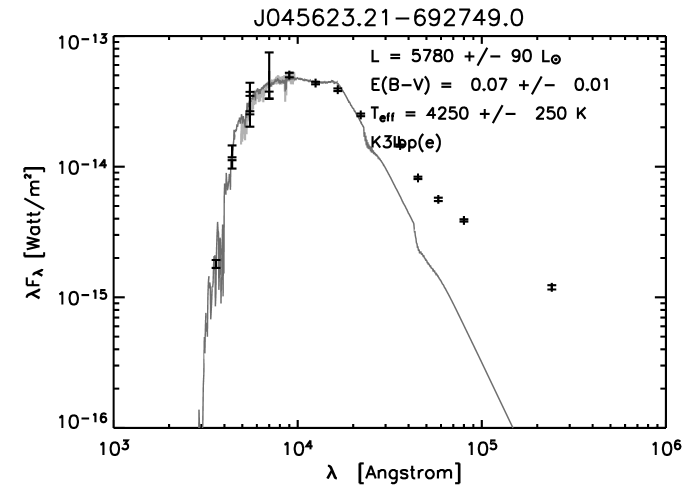
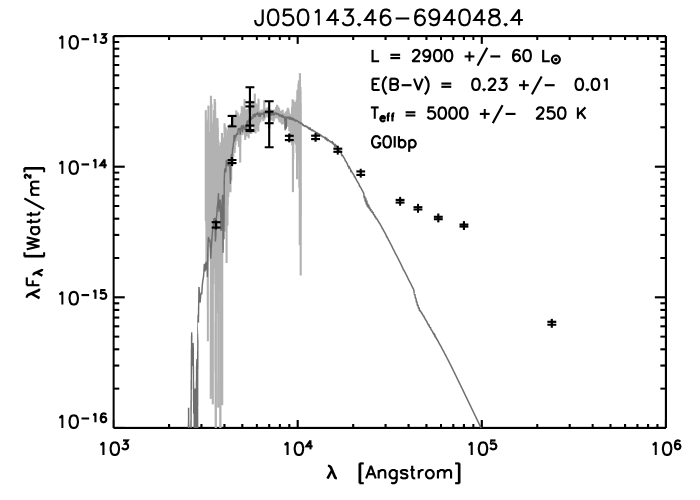

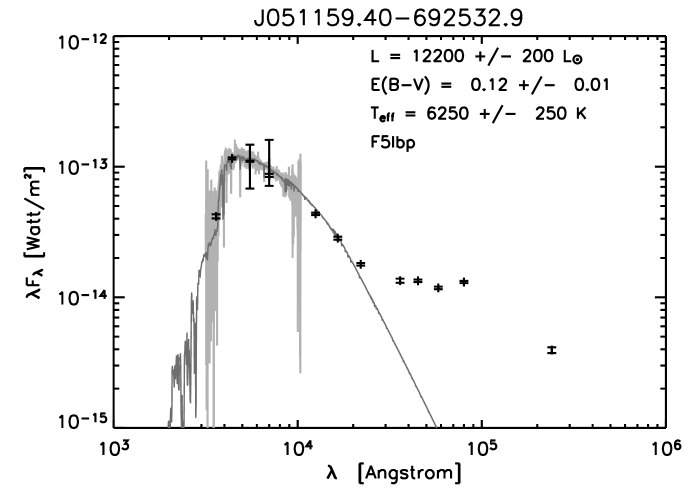

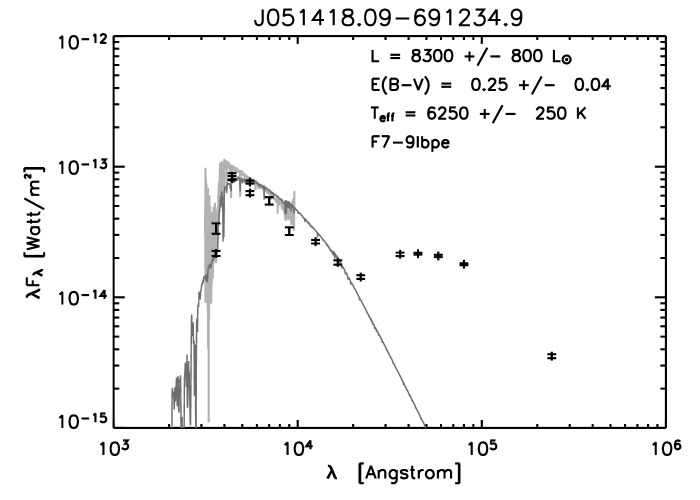
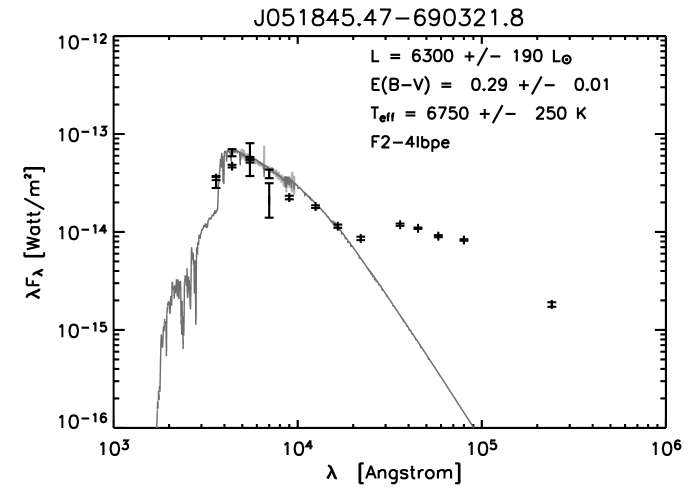


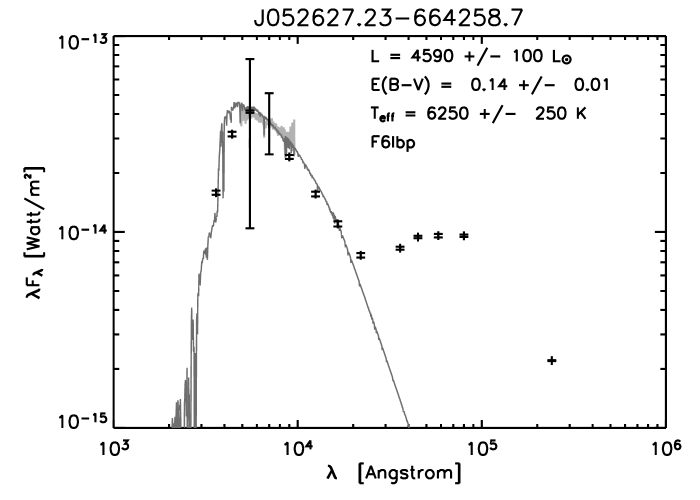

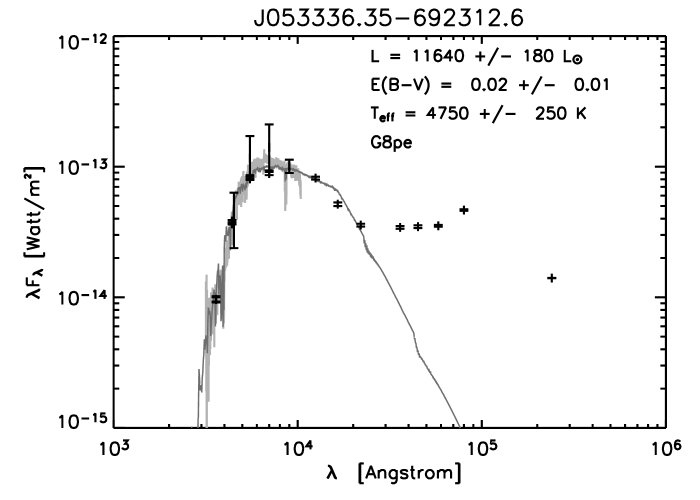
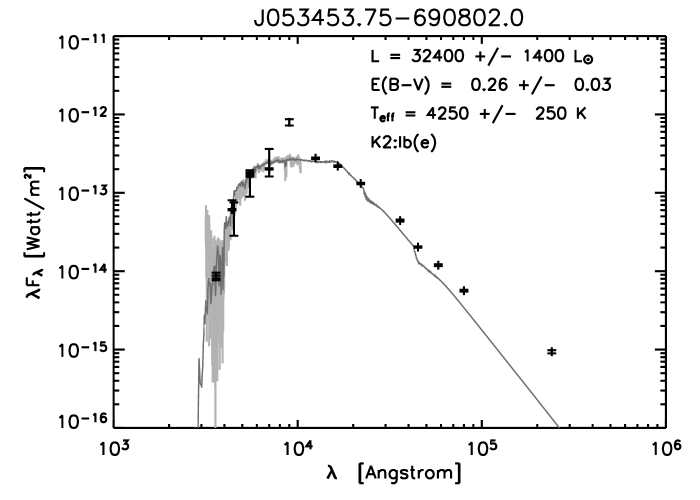
2
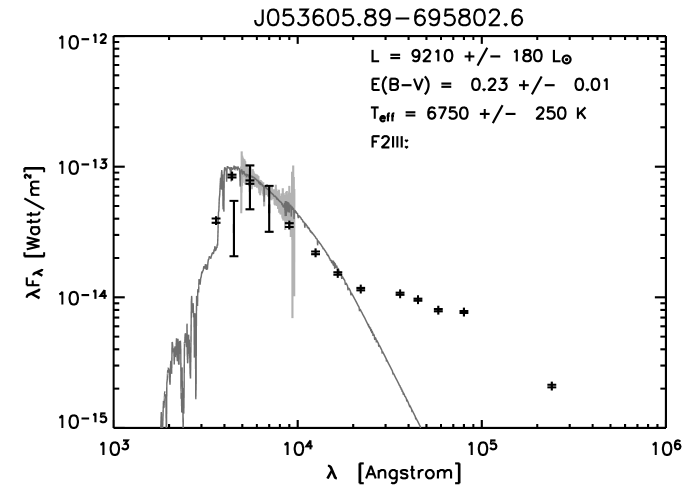

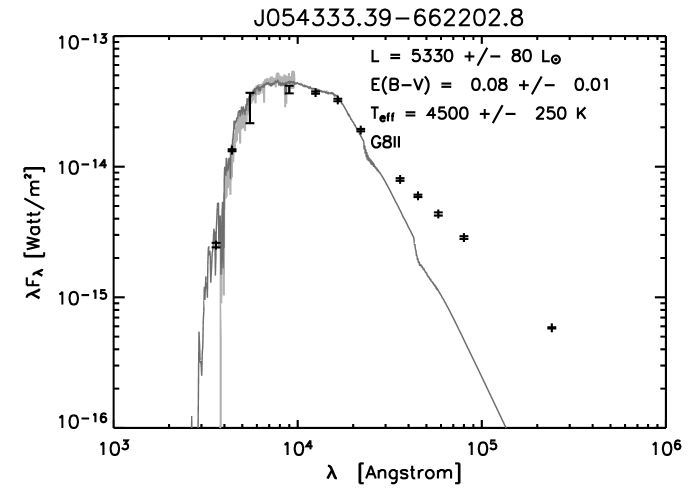


D.2 Post-AGB candidates with a shell
3


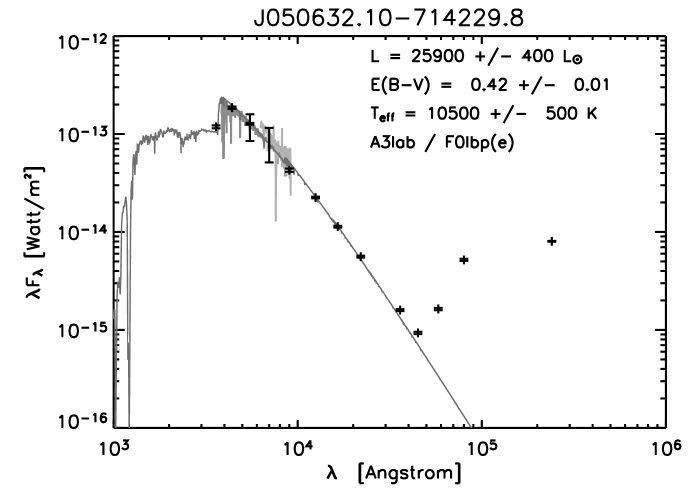
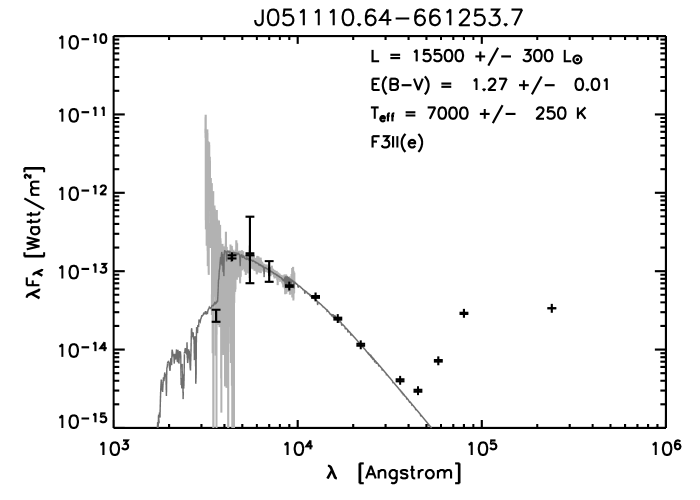
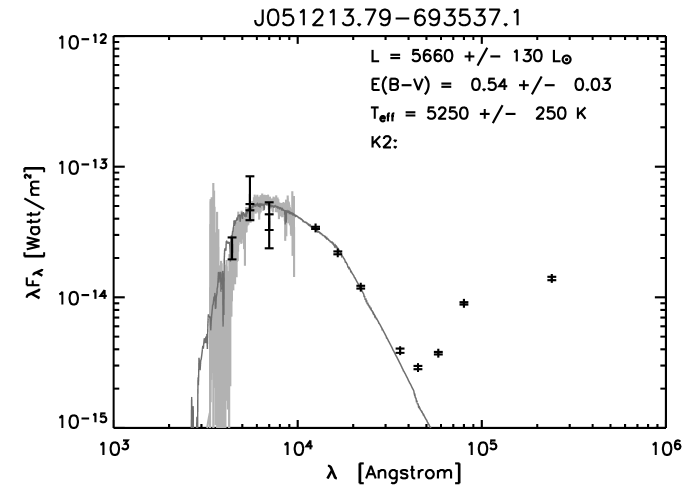
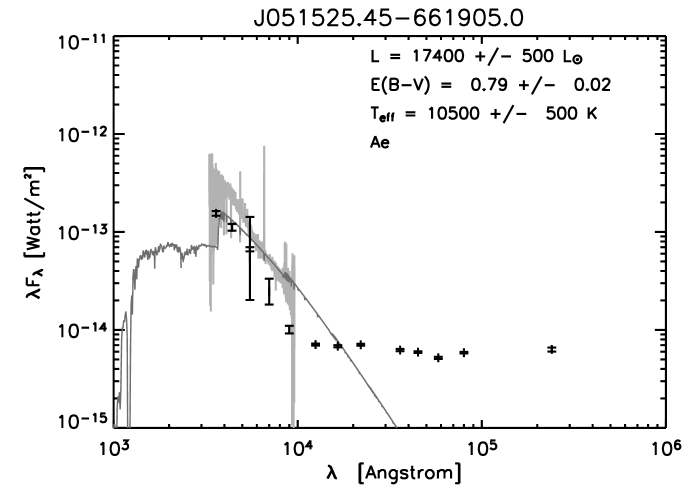
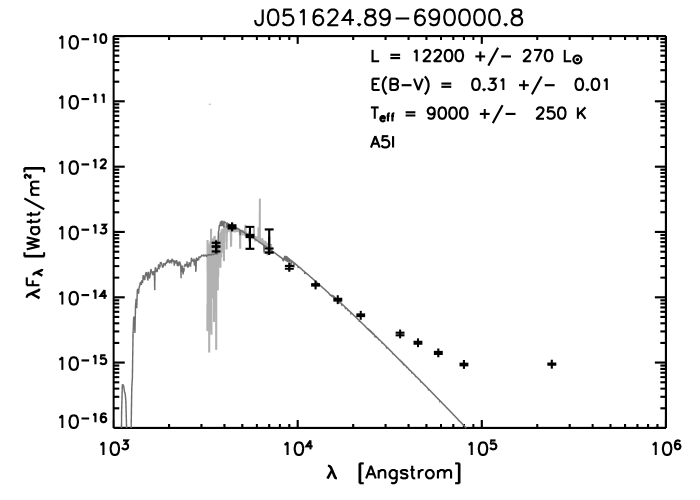
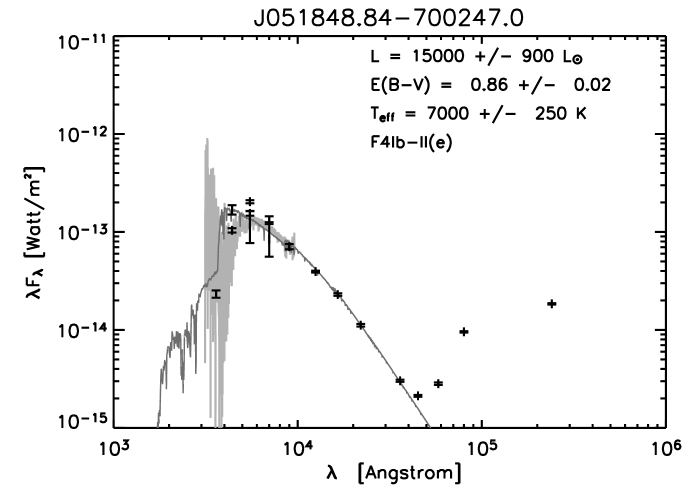
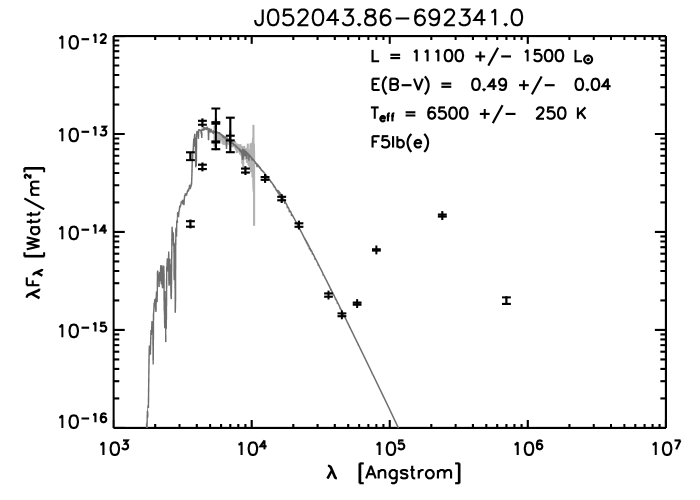
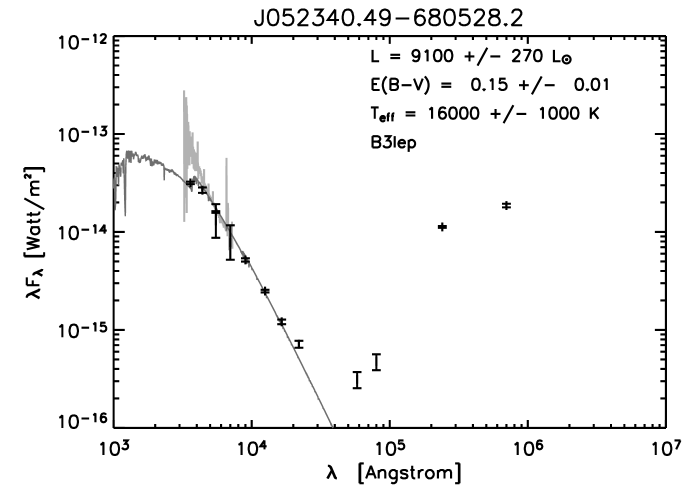
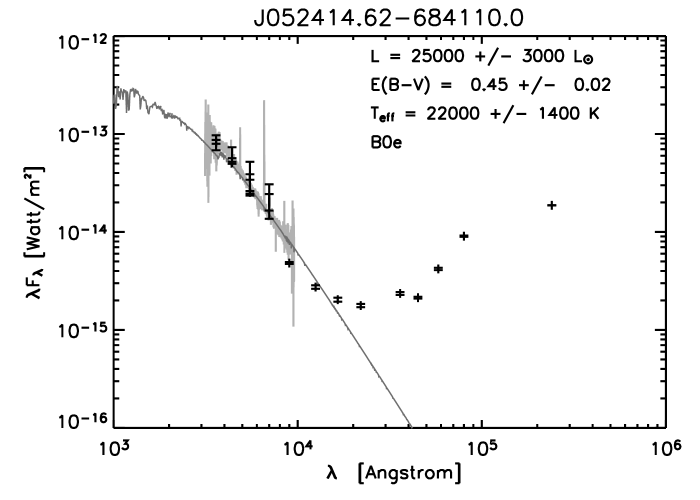
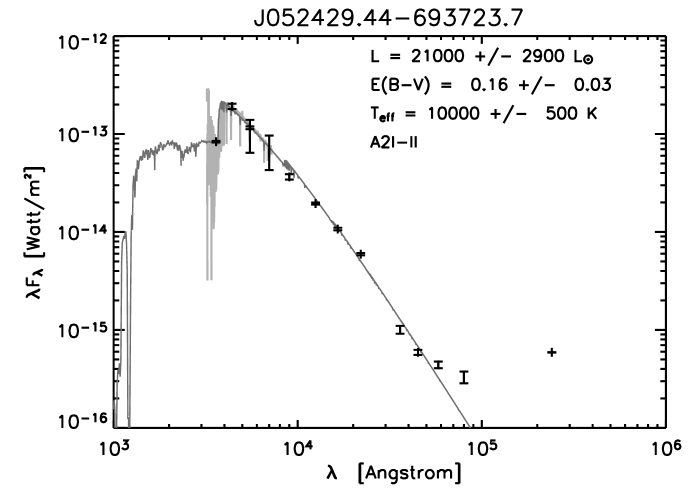

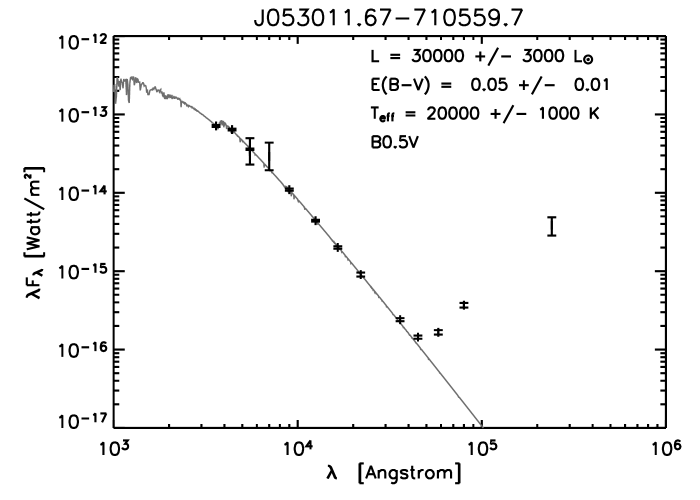
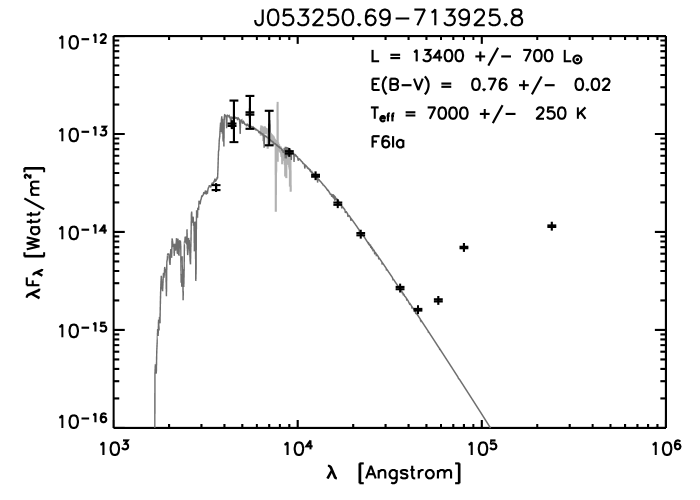
4
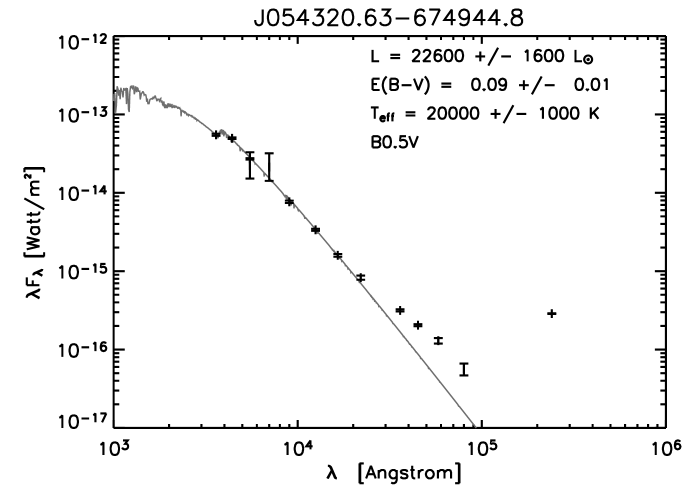


D.3 Post-AGB candidates that fulfil all criteria
5
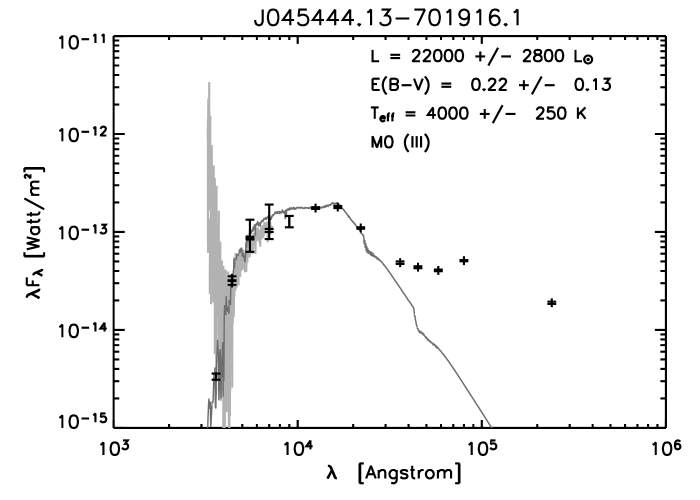
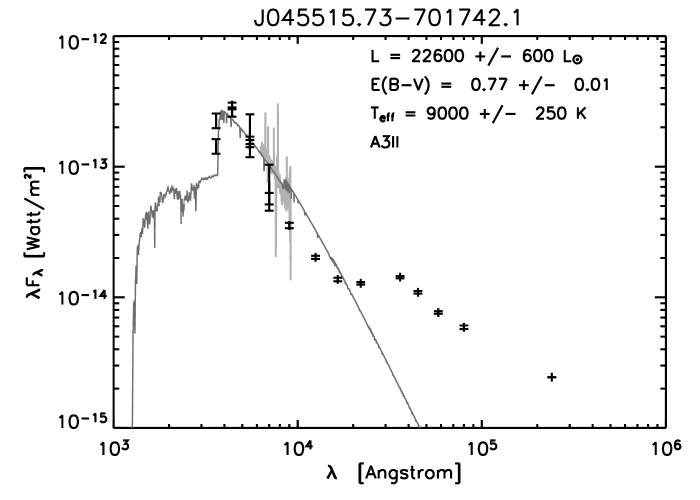

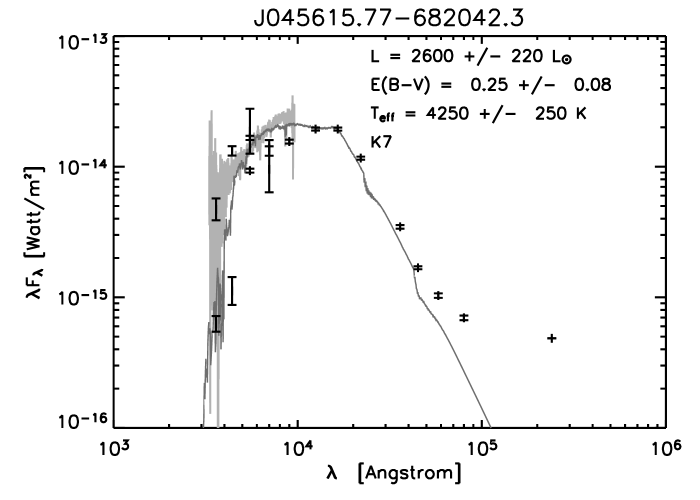


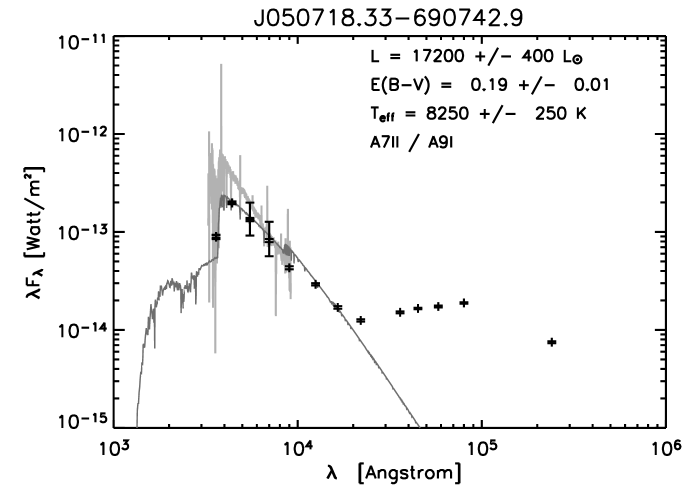
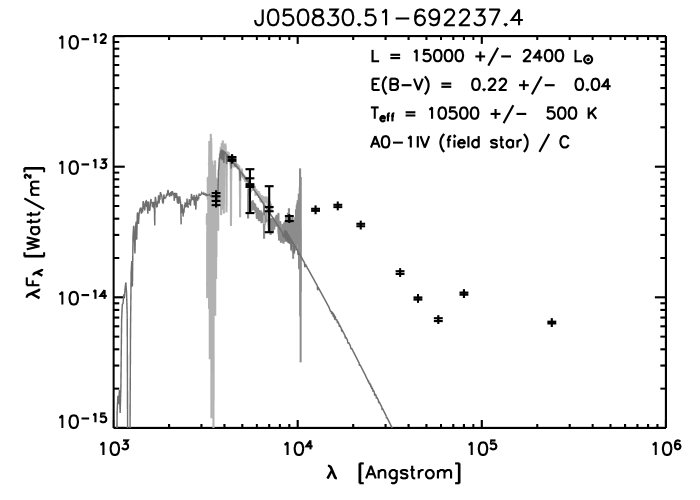
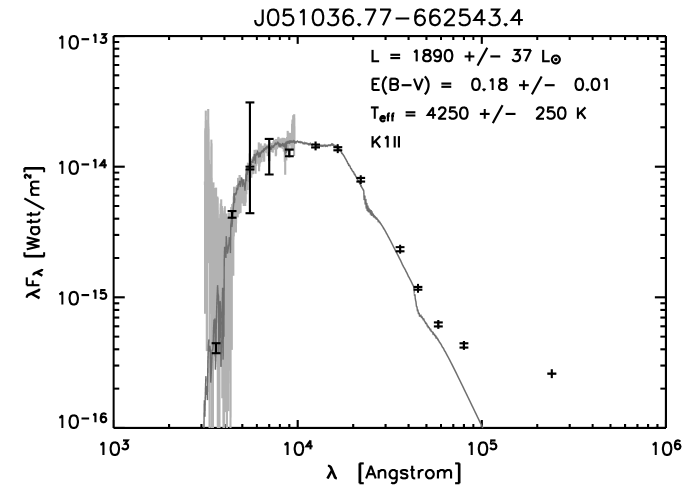
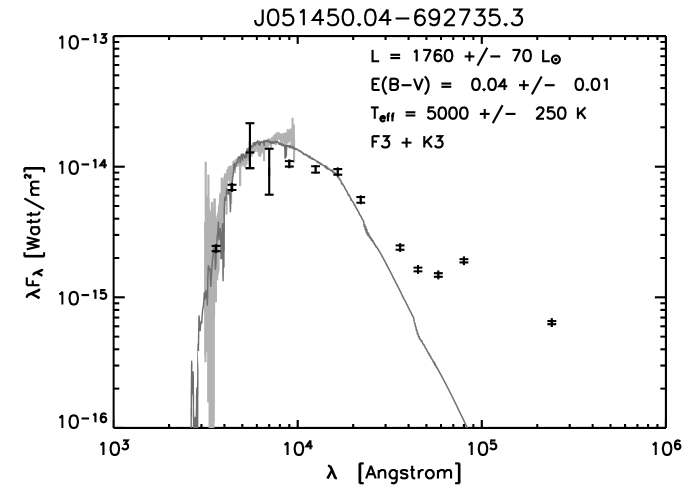
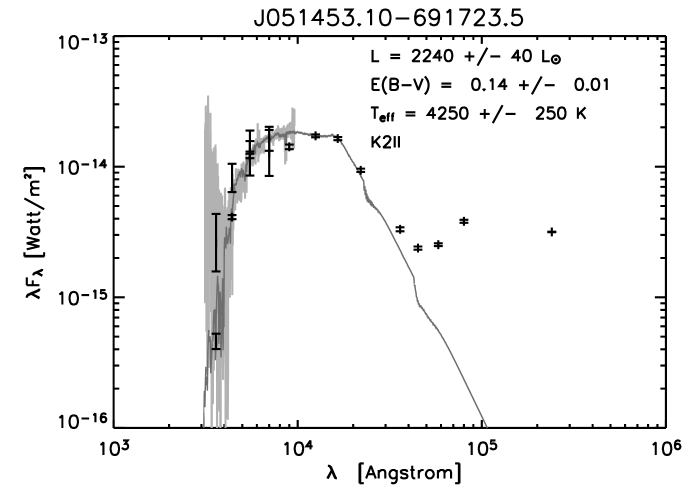
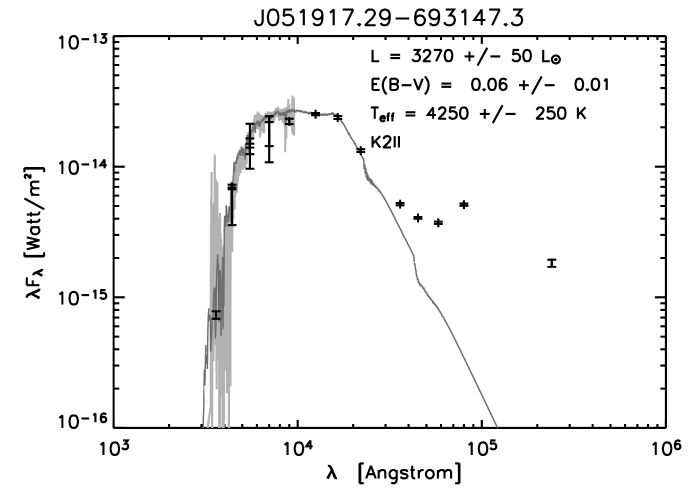
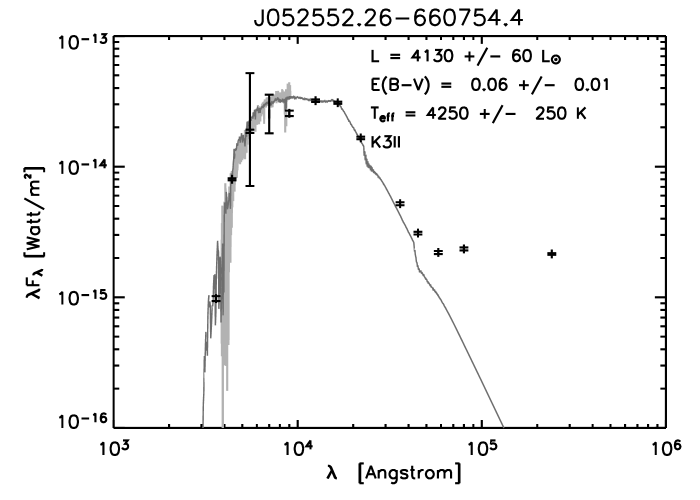
6