Demonstration of the synchrotron type spectrum of Laser-produced Betatron radiation
Abstract
Betatron X-ray radiation in laser-plasma accelerators is produced when electrons are accelerated and wiggled in the laser-wakefield cavity. This femtosecond source, producing intense X-ray beams in the multi kiloelectronvolt range has been observed at different interaction regime using high power laser from 10 to 100 TW. However, none of the spectral measurement performed were at sufficient resolution, bandwidth and signal to noise ratio to precisely determine the shape of spectra with a single laser shot in order to avoid shot to shot fluctuations. In this letter, the Betatron radiation produced using a 80 TW laser is characterized by using a single photon counting method. We measure in single shot spectra from 8 to 21 keV with a resolution better than 350 eV. The results obtained are in excellent agreement with theoretical predictions and demonstrate the synchrotron type nature of this radiation mechanism. The critical energy is found to be for our experimental conditions. In addition, the features of the source at this energy range open novel perspectives for applications in time-resolved X-ray science.
A femtosecond X-ray beam, called Betatron, can be produced by focusing an intense femtosecond laser pulse at relativistic intensities, on the order of , onto a gas jet target. Interacting with the quasi-instantaneously created under-dense plasma, the laser pulse excites a wakefield in which electrons can be trapped and accelerated to high energies in short distances Tajima and Dawson (1979); Pukhov and Meyer-ter Vehn (2002); Geddes et al. (2004); Mangles et al. (2004); Faure et al. (2004). These electrons perform Betatron oscillations across the propagation axis, and emit X-ray photons Esarey et al. (2002); Kostyukov et al. (2003); Kiselev et al. (2004); Rousse et al. (2004); Ta Phuoc et al. (2006) (radiation from accelerating charged-particles). The Betatron radiation consists on a broadband X-ray beam, collimated within 10’s mrad, with a femtosecond duration Phuoc et al. (2007).
During the past few years, several experiments have been dedicated, at different laser facilities, to the characterization of Betatron radiation. Even if the origin of the radiation was clearly identified, its spectrum has never been precisely determined. This information is however crucial to improve our knowledge of the physical mechanisms driving the source, identify the electrons participating to the emission, and determine the most appropriate routes for its development. In addition, for any potential application the precise shape of the spectrum must be known.
So far, spectra estimations were either based on the measurement of the transmission through an array of filters or by using the diffraction from crystals. The use of filters is the most elementary method and it allows a single shot measurement. The results obtained using this method are generally fitted with the synchrotron distribution theoretically predicted Kneip et al. (2008, 2009); Mangles et al. (2009); Kneip et al. (2010). However, this rely on the assumption that the spectrum is synchrotron-like and can not give any deviation from such distribution, or details in the structure of the spectrum. When the Bragg diffraction from a crystal is used, the resolution is important but the characterization range is limited to about 1-3 keV Albert et al. (2008) and the measurement requires an accumulation over about 10 laser shots for each energy point. Consequently this method is very sensitive to the strong fluctuations of the Betatron spectrum and can only provide a mean spectrum of the source. To overcome the limitations of the precedent methods, the photon counting can be a relevant method. For a sufficiently intense source and an appropriate experimental setup, we will show that it can provide a single shot measurement of the source over a large bandwidth. A photon counting based measurement of the Betatron source has been recently used in the range 1-9 keV and a continuous spectrum was observed, but its structure was not revealed since it was not deconvoluted by the filters transmission and the CCD response Thorn et al. (2010); Plateau et al. (2010).
In this letter, we present single shot photon counting measurements of the Betatron X-ray radiation spectrum in the 8-21 keV energy range with a resolution better than 350 eV. Thanks to this method, the results demonstrate the synchrotron type nature of the Betatron radiation and its direct correlation with the accelerated electron energy spectrum which were simultaneously measured. In the experiment presented, the Betatron radiation was produced at the interaction of a 80 TW / 30 fs laser pulse with a gas jet target density on the order of . We will show that the experimental spectrum fits a synchrotron distribution of critical energy .
In a laser-plasma accelerator, electrons are both accelerated longitudinally and wiggled transversally by the electromagnetic wakefields. The transverse oscillation is nearly sinusoidal at the Betatron frequency Esarey et al. (2002); Kostyukov et al. (2003), where is the relativistic factor of the electron and the plasma frequency, with the electron density, the electron charge and the electron mass. Due to this oscillatory motion, radiation is emitted with properties depending on the strength parameter ( is the Betatron transverse amplitude of motion and ), on the Betatron frequency and on the electron energy . For , the on-axis radiation spectrum is nearly monochromatic at the fundamental frequency . As , harmonics of the fundamental start to appear in the spectrum, and for the spectrum contains many closely spaced harmonics and extends up to a critical frequency . Experimental data Rousse et al. (2004); Ta Phuoc et al. (2006); Kneip et al. (2008, 2009); Mangles et al. (2009) have shown that Betatron oscillations occur in the wiggler regime, . In this latter regime, for a single electron with constant parameters , and , the integrated radiation spectrum is similar to the synchrotron one which is given by , where is a modified Bessel function of the second kind. But because electrons are accelerating with changing parameters and because different electrons may have different parameters, a Betatron spectrum is probably more correctly described by a sum of synchrotron distributions Thomas (2010).
The experiment has been performed at the Advanced Laser Light Source (ALLS) facility at INRS-EMT Fourmaux et al. (2008), using a titanium-doped sapphire (Ti:sapphire) laser operating at 10 Hz with a central wavelength of 800 nm in chirped-pulse amplification mode. The ALLS laser system delivered 2.5 Joule of energy on target with a full width at half maximum (FWHM) duration of 30 fs (80TW) and linear polarization. The experimental set-up for electron acceleration and Betatron X-ray generation is presented on figure 1.
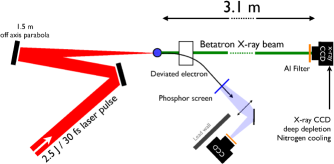
The laser pulse was focused by an m off-axis parabolic mirror onto a supersonic helium gas jet. In the focal plane, the FWHM spot size was 24 and the encircled energy in this FWHM spot size was 30% of the total energy. It corresponds to an initial laser intensity of and a normalized vector potential amplitude of . The gas jet density profile has been characterized by interferometry Malka et al. (2000). In this experiment, we used a 3 mm diameter helium gas jet whose density profile has a well-defined 2.1-mm-long electron density plateau of .
The electron beam produced in the interaction is measured with a spectrometer consisting of a permanent dipole magnet (1.1 T over 10 cm) which deflects electrons depending on their energy, and a Lanex phosphor screen to convert a fraction of the electron energy into 546 nm light imaged by a CCD camera Glinec et al. (2006). Three typical raw electron spectra recorded in the experiment are displayed on figure 2.
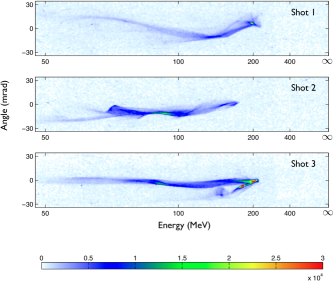
It shows that electrons are accelerated up to approximately 200 MeV, and that transverse structure are present in the raw spectra (correlation between energy and exit angle), which are reminiscent of the Betatron motion in the laser-plasma accelerator Glinec et al. (2008).
X-rays produced by the accelerated electrons have been measured using a deep-depletion X-ray CCD (model PI-LCX:1300 cooled with liquid nitrogen), with imaging pixels of size mm. The X-ray CCD was directly connected and vacuum pumped via the interaction chamber. The quantum efficiency extends well above 20 keV, allowing to count X-ray photons beyond ten keV. First, we placed the X-ray CCD close to the X-ray source (distance of 1.2 m) in order to measure the X-ray angular profile. Typical measured angular spreads of the X-ray beams were on the order of 20 mrad (FWHM). Using an array of aluminum filters of different thicknesses (4, 34, 64 and 124 m), the measurement of the transmission through each filter can be used to fit for the best synchrotron distribution reproducing the data. Using the synchrotron distribution defined above, we obtained a best fit for . However, this method is very imprecise and does not allow to obtain any detail in the X-ray spectrum, or any deviation from a unique synchrotron distribution.
A precise measurement of the X-ray spectrum can be achieved by photon counting Maddox et al. (2008); Fourment et al. (2009). The CCD camera is composed of pixels, i.e. 1,740,000 independent detectors, and a single photon detected by one of these detectors gives a number of counts (analog to digital converter (ADC) unit) which is proportional to its energy: , where is the number of counts and the photon energy. For our ADC settings, we obtained count per eV by calibrating the X-ray CCD using lines emitted in laser-solid interaction and using the Betatron X-ray beam passing through a Cu filter which has a sharp cut-off at 8.98 keV. If the number of photons per pixel is small compared to one, piling events (several photons detected on a single pixel) can be neglected and the measurement of the X-ray spectrum becomes possible. A single photon leads to the formation of an electron cloud in the Silicon layer of the CCD chip, which can spread over several neighbor pixels. This phenomenon has to be taken into account in the data analysis. We have used a first algorithm able to detect events spreading over a few pixels (multi-pixel event, MPE) and a second algorithm which only takes into account non-spreading events in which the electron cloud is detected on only one pixel (single-pixel event, SPE). For a MPE, the photon energy can be recovered by summing the number of counts over all pixels of the event. However, we found that the MPE algorithm had a lower energy resolution and was more sensitive to piling events than the SPE algorithm. On the other hand, to recover the experimental spectrum from the SPE method, it is necessary to know the probability that a single photon yields a single-pixel event, , which depends on the photon energy . This function has been obtained from a simulation modeling our CCD response and providing Fourment et al. (2009). The experimental spectrum is then recovered by:
| (1) |
where is the number of single-pixel events for each number of counts obtained from the SPE algorithm, count/eV, is the CCD quantum efficiency, is the transmission of the filters placed before the CCD, is a numerical factor and is the number of photons per unit energy (in eV-1). The numerical factor comes from the fact that many SPE photons are not analyzed by the algorithm because they are superposed or situated next to other photons. This factor is obtained by requiring that the spectrum leads to the correct total number of counts in the CCD image. It should be noted that contrary to reference Thorn et al. (2010), the studied energy range doesn’t contain any edge or line emission making the analysis easier. In our work, the energy range is limited at low energy by the Al filter thickness used to reduce the number of photons on the CCD camera. The energy range could be extended to lower energies by setting the detector farther away.
In order to operate in photon counting mode, we placed the X-ray CCD at a distance of 3.1 m from the source as shown on figure 1, and we attenuated the signal using an Al filter with a thickness of 274 m. We collected photons in a solid angle of sr around the propagation axis.
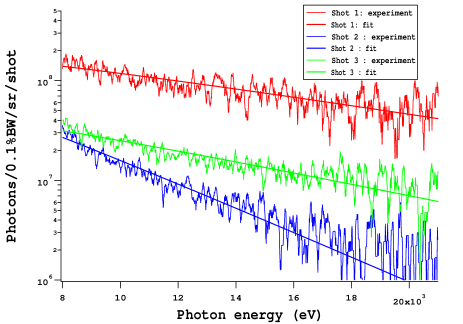
Figure 3 displays the measured experimental spectra of Betatron X-rays by photon counting corresponding to each laser shot whose electron energy spectra have already been shown on figure 2. The estimated energy resolution is better than 350 eV. A fit of the experimental measurements by a synchrotron distribution (of the type as defined above) is also shown for each laser shot. The best fit was respectively obtained with a synchrotron distribution of critical energy , , and (shot 1, 2, and 3).
Since both the electron and X-ray photon spectra are simultaneously obtained in a single laser shot they can be correlated. If we consider the shot 1 shown both on figure 2 and 3, we observe important Betatron oscillations combined with a high electron charge at 200 MeV. This is well correlated with a high critical energy () and a high number of photons (more than photons/0.1%bandwidth/sr/shot). For shot 2, the maximum electron charge is well below 200 MeV and the Betatron oscillations are small compared to shot 1. This is well correlated with the small critical energy .
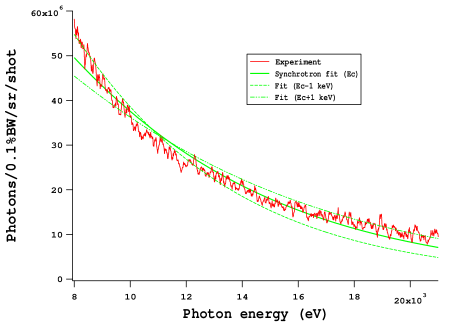
Figure 4 displays the measured experimental spectrum of Betatron X-rays averaged over ten successive shots. As the X-ray beam has a pointing fluctuation on the order of the beam size, it can be regarded as an averaged spectrum over angles. The average also allows to give a typical spectrum (since shot to shot fluctuations are important) and to improve the signal to noise ratio. A fit of the experimental measurement by a synchrotron distribution (of the type as defined above) is also shown. The best fit was obtained with a synchrotron distribution of critical energy . The measurement precision over the critical energy is .
In conclusion, we have presented a single shot and large spectral range characterization of laser-produced Betatron radiation. At this experiment, the source produces and photons/0.1%bandwidth/sr/shot at respectively 10 and 20 keV. The result shows unambiguously that the single shot experimental spectra fit synchrotron distributions. The averaged spectrum has a best fit for . The high critical energy obtained in these experiments demonstrate the potential of this X-ray source for diffraction and imaging applications. It also shows the interest for 100 TW scale laser system to go beyond 10 Hz repetition rate to increase the X-ray source average brightness.
The authors would like to thanks ALLS technical team for their support: M. O. Bussière, J. Maltais, C. Morissette, L. Pelletier, F. Poitras, P. L. Renault and C. Sirois. The ALLS facility has been funded by the Canadian Foundation for Innovation (CFI). This work is funded by NSERC, the Canada Research Chair program and Ministère de l’Éducation du Québec. We acknowledge the Agence Nationale pour la Recherche, through the COKER project ANR-06-BLAN-0123-01.
References
- Tajima and Dawson (1979) T. Tajima and J. M. Dawson, Phys. Rev. Lett., 43, 267 (1979).
- Pukhov and Meyer-ter Vehn (2002) A. Pukhov and J. Meyer-ter Vehn, Appl. Phys. B: Lasers Opt., 74, 355 (2002).
- Geddes et al. (2004) C. G. R. Geddes, C. Toth, J. van Tilborg, E. Esarey, C. B. Schroeder, D. Bruhwiler, C. Nieter, J. Cary, and W. P. Leemans, Nature (London), 431, 538 (2004).
- Mangles et al. (2004) S. P. D. Mangles, C. D. Murphy, Z. Najmudin, A. G. R. Thomas, J. L. Collier, A. E. Dangor, E. J. Divall, P. S. Foster, J. G. Gallacher, C. J. Hooker, D. A. Jaroszynski, A. J. Langley, W. B. Mori, P. A. Norreys, F. S. Tsung, R. Viskup, B. R. Walton, and K. Krushelnick, Nature (London), 431, 535 (2004).
- Faure et al. (2004) J. Faure, Y. Glinec, A. Pukhov, S. Kiselev, S. Gordienko, E. Lefebvre, J. P. Rousseau, F. Burgy, and V. Malka, Nature (London), 431, 541 (2004).
- Esarey et al. (2002) E. Esarey, B. A. Shadwick, P. Catravas, and W. P. Leemans, Phys. Rev. E, 65, 056505 (2002).
- Kostyukov et al. (2003) I. Kostyukov, S. Kiselev, and A. Pukhov, Phys. Plasmas, 10, 4818 (2003).
- Kiselev et al. (2004) S. Kiselev, A. Pukhov, and I. Kostyukov, Phys. Rev. Lett., 93, 135004 (2004).
- Rousse et al. (2004) A. Rousse, K. Ta Phuoc, R. Shah, A. Pukhov, E. Lefebvre, V. Malka, S. Kiselev, F. Burgy, J. P. Rousseau, D. Umstadter, and D. Hulin, Phys. Rev. Lett., 93, 135005 (2004).
- Ta Phuoc et al. (2006) K. Ta Phuoc, S. Corde, R. Shah, F. Albert, R. Fitour, J. P. Rousseau, F. Burgy, B. Mercier, and A. Rousse, Phys. Rev. Lett., 97, 225002 (2006).
- Phuoc et al. (2007) K. T. Phuoc, R. Fitour, A. Tafzi, T. Garl, N. Artemiev, R. Shah, F. Albert, D. Boschetto, A. Rousse, D.-E. Kim, A. Pukhov, V. Seredov, and I. Kostyukov, Phys. Plasmas, 14, 080701 (2007).
- Kneip et al. (2008) S. Kneip, S. R. Nagel, C. Bellei, N. Bourgeois, A. E. Dangor, A. Gopal, R. Heathcote, S. P. D. Mangles, J. R. Marquès, A. Maksimchuk, P. M. Nilson, K. T. Phuoc, S. Reed, M. Tzoufras, F. S. Tsung, L. Willingale, W. B. Mori, A. Rousse, K. Krushelnick, and Z. Najmudin, Phys. Rev. Lett., 100, 105006 (2008).
- Kneip et al. (2009) S. Kneip, C. McGuffey, S. R. Nagel, C. Palmer, C. Bellei, J. Schreiber, C. Huntington, F. Dollar, T. Matsuoka, V. Chvykov, G. Kalintchenko, V. Yanovsky, A. Maksimchuk, K. Ta Phuoc, S. P. D. Mangles, K. Krushelnick, and Z. Najmudin, in Proceedings of SPIE 7359: Harnessing Relativistic Plasma Waves as Novel Radiation Sources from Terahertz to X-Rays and Beyond, 73590T (2009).
- Mangles et al. (2009) S. P. D. Mangles, G. Genoud, S. Kneip, M. Burza, K. Cassou, B. Cros, N. P. Dover, C. Kamperidis, Z. Najmudin, A. Persson, J. Schreiber, F. Wojda, and C.-G. Wahlstrom, Appl. Phys. Lett., 95, 181106 (2009).
- Kneip et al. (2010) S. Kneip, C. McGuffey, J. L. Martins, S. F. Martins, C. Bellei, V. Chvykov, F. Dollar, R. Fonseca, C. Huntington, G. Kalintchenko, A. Maksimchuk, S. P. D. Mangles, T. Matsuoka, S. R. Nagel, C. A. J. Palmer, J. Schreiber, K. T. Phuoc, A. G. R. Thomas, V. Yanovsky, L. O. Silva, K. Krushelnick, and Z. Najmudin, Nat. Phys., 6, 980 (2010).
- Albert et al. (2008) F. Albert, R. Shah, K. Ta Phuoc, R. Fitour, F. Burgy, J. P. Rousseau, A. Tafzi, D. Douillet, T. Lefrou, and A. Rousse, Phys. Rev. E, 77, 056402 (2008).
- Thorn et al. (2010) D. B. Thorn, C. G. R. Geddes, N. H. Matlis, G. R. Plateau, E. H. Esarey, M. Battaglia, C. B. Schroeder, S. Shiraishi, T. Stohlker, C. Toth, and W. P. Leemans, Rev. Sci. Instrum., 81, 10E325 (2010).
- Plateau et al. (2010) G. R. Plateau, C. G. R. Geddes, D. B. Thorn, N. H. Matlis, D. E. Mittelberger, T. Stoehlker, M. Battaglia, T. S. Kim, K. Kamakura, E. Esarey, and W. P. Leemans, in Proceedings of Advanced Accelerator Concept: 14th Workshop (2010) p. 139.
- Thomas (2010) A. G. R. Thomas, Phys. Plasmas, 17, 056708 (2010).
- Fourmaux et al. (2008) S. Fourmaux, S. Payeur, A. Alexandrov, C. Serbanescu, F. Martin, T. Ozaki, A. Kudryashov, and J. C. Kieffer, Opt. Express, 16, 11987 (2008).
- Malka et al. (2000) V. Malka, C. Coulaud, J. P. Geindre, V. Lopez, Z. Najmudin, D. Neely, and F. Amiranoff, Rev. Sci. Instrum., 71, 2329 (2000).
- Glinec et al. (2006) Y. Glinec, J. Faure, A. Guemnie-Tafo, V. Malka, H. Monard, J. P. Larbre, V. D. Waele, J. L. Marignier, and M. Mostafavi, Rev. Sci. Instrum., 77, 103301 (2006).
- Glinec et al. (2008) Y. Glinec, J. Faure, A. Lifschitz, J. M. Vieira, R. A. Fonseca, L. O. Silva, and V. Malka, Europhys. Lett., 81, 64001 (2008).
- Maddox et al. (2008) B. R. Maddox, H. S. Park, B. A. Remington, and M. McKernan, Rev. Sci. Instrum., 79, 10E924 (2008).
- Fourment et al. (2009) C. Fourment, N. Arazam, C. Bonte, T. Caillaud, D. Descamps, F. Dorchies, M. Harmand, S. Hulin, S. Petit, and J. J. Santos, Rev. Sci. Instrum., 80, 083505 (2009).