The Suzaku view of 3C 382
Abstract
We present a long (116 ks) Suzaku observation of the Broad-Line Radio Galaxy (BLRG) 3C 382 acquired in April 2007. A Swift BAT spectrum in 15–200 keV from the 58-month survey is also analyzed, together with an archival XMM-Newton EPIC exposure of 20 ks obtained one year after Suzaku. Our main result is the finding with Suzaku of a broad Fe K line with a relativistic profile consistent with emission from an accretion disk at tens of gravitational radii from the central black hole. The XIS data indicate emission from highly ionized iron and allow us to set tight, albeit model-dependent, constraints on the inner and outer radii of the disk reflecting region, and , respectively, and on the disk inclination, ∘. Two ionized reflection components are possibly observed, with similar contributions of 10% to the total continuum. A highly ionized one, with log3 erg s-1 cm, which successfully models the relativistic line and a mildly ionized one, with log1.5 erg s-1 cm, which models the narrow Fe K and high energy hump. When both these components are included, there is no further requirement for an additional black body soft excess below 2 keV. The Suzaku data confirm the presence of a warm absorber previously known from grating studies. After accounting for all the spectral features, the intrinsic photon index of the X-ray continuum is with a cutoff energy at keV, consistent with Comptonization models and excluding jet-related emission up to these energies. Comparison of the X-ray properties of 3C 382 and other BLRGs to Seyferts recently observed with Suzaku and BAT confirms the idea that the distinction between radio-loud and radio-quiet AGN at X-rays is blurred. The two classes form a continuum distribution in terms of X-ray photon index, reflection strength, and Fe K line width (related to the disk emission radius), with BLRGs clustered at one end of the distribution. This points to a common structure of the central engine, with only a few fundamental parameter(s) responsible for the radio-loud/radio-quiet division. The black hole spin, and in particular its rotation compared to the disk’s, may be a key one.
Subject Headings: Galaxies: active — galaxies: radio – galaxies: individual — X-rays: galaxies
1 Introduction
It is by now widely accepted that Active Galactic Nuclei (AGN), including radio-loud sources, are powered by accretion of the host galaxy gas onto a central super-massive black hole (e.g., Blandford 1985). The rich variety of AGN phenomenology has been explained in terms of orientation with respect to the axis of an obscuring equatorial thick matter surrounding the nucleus (Antonucci 1993; Urry & Padovani 1995), yielding type-1 sources for face-on views and type-2 objects for edge-on views. In addition, in radio-loud sources a relativistic jet is present, connecting the innermost regions near the black hole to the radio galaxy perifery. The jet angle – defined as the angle between the jet axis and the line of sight – increases from blazars to Broad- and Narrow-Line Radio Galaxies, roughly corresponding to an increase of obscuration degree. As the jet angle increases, the importance of its emission decreases, due to beaming effects.
X-ray spectroscopy is an effective tool to investigate the central engines of AGN. Indeed, previous X-ray observations of BLRGs in the 1990s with ASCA, RXTE, and BeppoSAX established that these sources exhibit Seyfert-like spectra with subtle but significant differences, i.e., flatter X-ray continua and weaker reflection features than in radio-quiet (see Sambruna, Eracleous, & Mushotzky 2002; Ballantyne 2007, and references therein, for a review). In particular, the Fe K emission line around 6.4 keV was observed to be narrower and of lower EW than in Seyferts, and generally unresolved at the limited resolution of the pre-Suzaku detectors. No clear evidence for a relativistic accretion disk profile was found for the Fe K line in any BLRGs, or other RL AGN. These results raised the currently held scenario that some intrinsic, fundamental difference must exist in the structure of the accretion flow between the two classes of AGN, with RQ being dominated by standard optically thick, geometrically thin disks and RL having radiatively inefficient, ADAF-like, inner disks (see discussion in Eracleous et al. 2000; Ballantyne 2007). Alternatively or in addition, a non-thermal jet contribution was also possible.
The advent of Suzaku with its broad-band coverage in 0.3–100 keV and improved sensitivity especially in the critical Fe K region, 6–7 keV, has provided a golden opportunity to deepen our understanding of the central engines of RL AGN. Our group has secured GO observations of all the bright, nearby () BLRGs with relatively deep, 100 ks, Suzaku exposures. The Suzaku observations of our program targets are described in separate papers that concentrate on one source at the time, as each classical BLRG presents somewhat unique X-ray and multi-wavelength properties (3c 390.3, Sambruna et al. 2009, S09 hereafter; 3C 445, Braito et al. 2011; Reeves et al. 2010; 3C 111, Ballo et al. in prep.). In this paper, we focus on 3C 382, a giant lobe-dominated radio galaxy well-known for its soft excess and rapid X-ray variability from previous observations (see § 2). Besides its Suzaku data, we also discuss its XMM-Newton EPIC data and a Swift BAT spectrum (see below), both unpublished.
The Suzaku observation of 3C 382 confirms the complexity of its spectrum and its similarity to Seyferts. Remarkably, we find compelling evidence in the XIS data for a relativistic Fe K line profile, with excellent constraints on the disk inclination and inner/outer radii (§ 5.3). This is the first time that a such a detailed profile is detected in a BLRG, and indeed in a radio-loud AGN. The implications for the structure of the central engine and models of jet formation are far reaching (§ 8).
The paper is organized as follows. After describing the source properties and previous observations in § 2, in § 3 the data reduction of the new observations is presented. The Suzaku timing analysis is reported in § 4. We describe the spectral fits to the various datasets in § 5 for the combined Suzaku and Swift BAT and in § 6 for XMM-Newton. In § 7 we report the summary of the results and the discussion following in § 8. Finally, in Appendix A we report the background and calibration tests for the XIS cameras. Throughout this paper, a concordance cosmology with H km s-1 Mpc-1, =0.73, and =0.27 (Spergel et al. 2003) is adopted. The energy spectral index, , is defined such that . The photon index is .
2 3C 382 and Previous X-ray Observations
The lobe-dominated, Fanaroff-Riley II radio galaxy 3C 382 () has a double-lobe structure, with a clear jet in the northern lobe ending in a hotspot. While a counter-jet is not clear, a hotspot is also detected in the southern lobe, with a total size between hotspots at 3.89 GHz of 179′′ (Hardcastle et al. 1998). From this size, a lower limit to the jet inclination of ∘ is inferred (Eracleous & Halpern 1998). While it is common to assume that in BLRGs the jet axis is parallel to the disk axis, so that , with the disk inclination with respect to the line of sight, in this paper we will leave free to vary during the spectral fits to the X-ray data whenever possible.
Optically, 3C 382 is identified with a disturbed elliptical galaxy dominated by a very bright and unresolved nucleus (Matthews, Morgan & Schmidt 1964; Martel et al. 1999), located in a moderately rich environment (Longair & Seldner 1979). The optical spectra show a strong continuum and prominent broad lines photo-ionized by a power-law type of spectrum (Saunders et al. 1989; Tadhunter, Fosbury & Quinn 1989), with FWHM km/s for the H line (Eracleous & Halpern 1994). A recent estimate using the luminosity of the host galaxy places the mass of the central black hole around M M☉ within 40% (Marchesini et al. 2004).
3C 382 is a variable source at X-ray (Dower et al. 1980; Barr & Giommi 1992), radio (Strom, Willis & Willis 1978), optical, and UV frequencies (Puschell 1981; Tadhunter, Perez & Fosbury 1986). At X-rays it is well studied, and was observed by all the major X-ray observatories before Suzaku. Flux and spectral variability is observed on time-scales shorter than a day, with a trend of spectral softening for increasing intensity (Gliozzi et al. 2007).
Previous low-sensitivity observations of 3C 382 indicated that its X-ray spectrum was remarkably similar to Seyferts (Reynolds 1997). Aside from the variable soft excess below 2 keV, 3C 382 exhibits a warm absorber with ionization parameter log erg cm s-1, column density N cm-2, and outflow velocity 1,000 km/s, clearly detected in recent high-resolution dispersion spectra (Reeves et al. 2009; Torresi et al. 2010). The X-ray continuum can be described by a power law with the “canonical” photon index (e.g., Sambruna et al. 1999, S99 hereafter) and weak reflection features, including a Compton hump above 10 keV with reflection fraction (Gliozzi et al. 2007) and an Fe K line. The profile of the Fe K line has remained, so far, ambiguous due to its inherent complexity, as we show here (§ 5.1), and the poor sensitivity of the pre-Suzaku detectors. For example, using ASCA an unusually broad (Gaussian width 1 keV) line was inferred (S99; Reynolds 1997) while only a narrow component with 100 eV was detected with RXTE, BeppoSAX, and the Chandra HETGS (Eracleous et al. 2000; Grandi et al. 2001; Gliozzi et al. 2007).
The source exhibits a strong, variable X-ray excess over the extrapolation of the power-law continuum from the hard X-rays below 2 keV. Extended soft X-ray emission was detected with the ROSAT HRI in 0.3–2.4 keV (Prieto 2000), later confirmed with Chandra (Gliozzi et al. 2007). The contribution to the spectral soft excess from the extended emission, however, is negligible as shown by the point-like ACIS-S image in 0.5–2 keV (Gliozzi et al. 2007).
Finally, while other BLRGs have been detected at GeV gamma-rays (3C 111; Hartman et al. 2008), no signal has been reported so far from 3C 382 with Fermi (Abdo et al. 2010). The lack of gamma-ray flux and the double-lobe radio structure are strong indicators that the jet in this source is misaligned and most likely does not contaminate the nuclear emission, as supported by the Seyfert-like X-ray spectrum from the ASCA and RXTE era.
3 New X-ray Observations: Data Reduction
The log of the X-ray observations is reported in Table 1. The exposures are after data screening and the source count rates after background subtraction, according to the procedures described below.
3.1 Suzaku XIS
Suzaku observed 3C 382 on April 27th, 2007 for a net exposure time after screening of 116 ks. We used the cleaned event files obtained from version 2 of the Suzaku pipeline processing. Standard screening criteria were used, namely, only events outside the South Atlantic Anomaly (SAA) as well as with an Earth elevation angle (ELV) were retained, and Earth day-time elevation angles (DYE_ELV) . Furthermore, data within 256 s of the SAA passage were excluded and a cut-off rigidity of was adopted. The main parameters of the XIS observations are reported in Table 1.
The XIS spectra of 3C 382 were extracted from a circular region of 2.9′ radius centered on the source. Background spectra were extracted from four circular regions offset from the main target and avoiding the serendipitous source and the calibration sources. The combined area of these four background regions is twice the area of the main target region. The XIS response (rmf) and ancillary response (arf) files were produced, using the latest calibration files available, with the ftools tasks xisrmfgen and xissimarfgen, respectively. The source spectra from the front illuminated (FI) CCDs were summed, and fitted jointly with the back illuminated (BI), the XIS1, spectrum after verifying that the data from the FI and BI CCDs were consistent with each other. In fact, we checked that the 2–10 keV continuum slope and fluxes in the two cases are consistent within the 2%. The net XIS background-subtracted source spectra were binned with a minimum of 25 counts per energy bin to ensure that the goodness of fit can be applied to the spectral analysis. This binning is maintained throughout the spectral analysis and only in some figures it was increased for clarity, when specified. Consistent results were found by varying the binning in a range up to 100 counts/bin.
3.2 Suzaku HXD
For the HXD-PIN data reduction and analysis we followed the latest Suzaku data reduction guide (the ABC guide Version 2)111http://heasarc.gsfc.nasa.gov/docs/suzaku/analysis/abc/. We used the rev2 data, which include all four cluster units, and the best background available, which account for the instrumental background (Kokubun et al. 2007)222ftp://legacy.gsfc.nasa.gov/suzaku/doc/hxd/suzakumemo-2008-03.pdf. The source and background spectra were extracted within the common good time interval and the source spectrum was corrected for the detector dead-time. The net exposure time after screening was 113 ks.
The contribution of the diffuse cosmic X-ray background counts was simulated using the spectral form of Boldt (1987), assuming the response matrix for diffuse emission, and then added to the instrumental one. Two instrumental background files are available; background A or “quick” background, and background D or “tuned” background. We adopted the latter which is the latest release and which suffers lower systematic uncertainties of about 1.3%, corresponding to about half the uncertainty of the first release of the Non X-ray Background. With this choice of background, 3C 382 is detected up to 70 keV with the PIN at a level of 20% above the background. The count rate in 10–30 keV is 0.135 0.003 c/s. The HXD PIN spectrum was binned in order to have a signal-to-noise ratio greater then 10 in each bin, and the latest response file released by the instrumental team was used.
For a comparison with the Swift BAT spectrum, we considered the PIN spectrum in the overlapping energy band of the two detectors, E15–70 keV (see § 3.4). In this band, the PIN spectrum can be fitted with a single power law with , yielding a flux of erg cm-2 s-1, with 90% errors.
3.3 XMM-Newton
XMM-Newton observed 3C 382 on April 28th, 2008, for a net exposure after screening of 20 ks. The analysis of the RGS spectrum has already been performed by Torresi et al. (2010) and is not reported here.
We downloaded and reduced the data of the three EPIC cameras, pn, MOS1 and MOS2. The data reduction was performed following the standard procedure with the XMM-SAS v. 8.0.1 package. We checked the observation for high background contamination, looking for flares in the light curves at energies greater than 10 keV. We excluded these bad intervals from the successive analysis, and extracted the source photons from a circular region of 40′′, while the background ones were collected from an adjacent source free circular region of the same size. Only single and double events were selected.
Using the SAS task epatplot we checked that the pile-up fraction of the EPIC pn is negligible, less than 1%. Instead, given the X-ray brightness of the source, the pile-up fraction of the EPIC MOS observations is significant, 50%. The main result of pile-up is to introduce an overall distortion of the observed continuum, as it basically consists in counting two or more low-energy photons as a single high-energy photon. In fact, we find that the 2–10 keV power-law continuum of the pn has a 1.74, while for the MOS 1.6. Therefore, given the significant pileup of the MOS and and the 25% lower S/N ratio of the MOS data, due to the short exposure and lower effective area, we limited the analysis of XMM-Newton only to data from the EPIC pn camera.
Similarly to the XIS, the net EPIC pn background-subtracted source spectrum was binned with a minimum of 25 counts per energy bin to ensure that the goodness of fit can be applied to the spectral analysis This binning is maintained throughout the successive spectral analysis and increased only in some figures for clarity of presentation, when specified. Consistent results were found by varying the binning in a range up to 100 counts/bin.
3.4 Swift BAT Observations
The BAT spectrum was derived from the 58-month hard X-ray
survey111http://heasarc.gsfc.nasa.gov/docs/swift/results/bs58mon/. The
data reduction and extraction procedure of the 8-channel spectrum is
described in Baumgartner et al. (2010). To fit the BAT spectrum, we
used the latest calibration response diagonal_8.rsp and
background files as of December 2010.
The source is clearly detected in the energy band E15–200 keV with a S/N35 and a count rate c/s. A fit to the mean 58-month BAT spectrum in the 15–70 keV band with a single power law model yields a photon index and a flux of erg cm-2 s-1, at 90% uncertainty. These values are consistent with those derived for the Suzaku HXD PIN in the same energy range (see §3.2), justifying joint fits using both instruments. This is especially important in view of the extended sensitivity to higher energies provided by the BAT, which will allow us to set better constraints on reflection models.
4 Timing Analysis
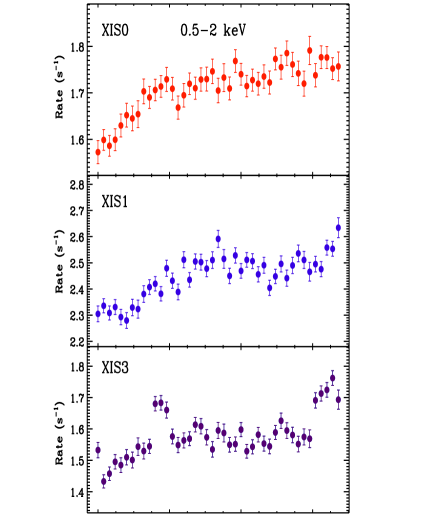
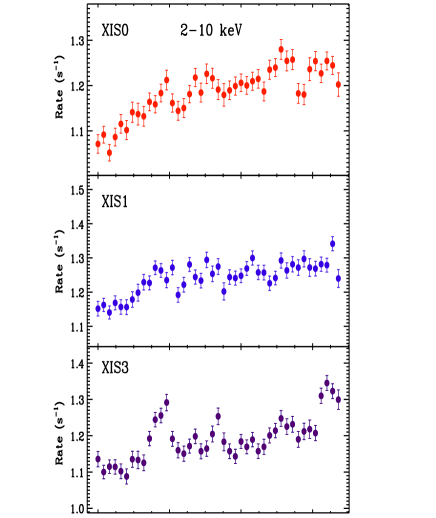
Figure 1 shows the Suzaku XIS0-3 light curves of 3C 382 at soft and hard X-rays, respectively, with the flux in bins of 5760 sec (1 orbit). The data from the three detectors are plotted on separate panels for comparison. Weak flux variations are seen in both energy bands for all three detectors, with small-amplitude variations of the order of few percent. When the ratio of the counts in the two energy bands is plotted against time or total count rate, there is no evidence for spectral variability. We note the presence of two possible short time-scale flares of 5% amplitude in the XIS 3. We ascribe them to spurious instrumental fluctuations. However, as discussed in the Appendix, they have a negligible influence on the spectral analysis of the average spectrum reported here. Aside from the small apparent flares, the overall shape of the light curves of the different XIS detectors is consistent, with each showing a gradual increase in counts over the Suzaku observation.
The variability analysis was repeated for the XMM-Newton EPIC data, despite the short exposure affected by the large background flares. No evidence for flux changes was found. Table 2 reports the soft (0.5–2 keV) and hard (2–10 keV) fluxes of 3C 382 from the Suzaku and XMM-Newton observations. The reported fluxes are both observed and corrected for any intervening absorption and were derived from the best-fit models to the 0.6–200 keV Suzaku+BAT and 0.5–10 keV EPIC pn spectra (see § 5.4 and § 6). Observed and absorption corrected luminosities are reported in Table 2 as well. Comparing both fluxes and luminosities in all energy bands, it is clear that the source was in similar intensity states at the epoch of the Suzaku and XMM-Newton observations.
5 The Suzaku Broad-Band Spectrum
The lack of significant spectral variability derived from a model-independent timing analysis of the XIS data (§ 4) indicates that the spectral properties of 3C 382 can be safely investigated using a time-averaged spectrum accumulated over the entire 116 ks exposure. This spectrum provides the largest signal-to-noise ratio available from this observation, allowing the most detailed spectral analysis of the Fe K line region and broad-band continuum, the main goals of our project.
All spectral fits were performed using XSPEC v.12.6.0. The
significance of adding free parameters to the model was evaluated with
the F-test.
We included only model components with a statistical probability 99%.
All uncertainties
quoted are 1 for one parameter of interest, unless otherwise
stated. The energy of the lines is reported in the source rest-frame,
if not otherwise stated. The data from the XIS CCDs were fitted
jointly, excluding the energy range E1.5–2 keV, around the Si K edge,
which is known to be affected by calibration issues (Koyama et al. 2007).
When fitting the broad-band spectrum, a constant factor was
introduced in the model to take into account the cross-normalization
between the different instruments. In particular, a constant factor
of 1.16 was adopted for the XIS/PIN and of 0.9 for the
PIN/BAT. Throughout the spectral analysis we always include a Galactic
absorption towards 3C 382 of cm-2 (e.g., Dickey & Lockman 1990; Kalberla et al. 2005).
The plan of the analysis is as follows. First, we consider the combined broad-band Suzaku and Swift BAT spectra in the E0.6–200 keV, excluding the Fe K band, and derive an estimate of the underlying X-ray continuum. Then, we consider also the Fe K band and perform a search for additional emission/absorption features in the spectrum. Subsequently, we perform fits to the full broad-band spectrum with a physical model including all the spectral components identified in the previous steps plus an additional relativistic line and smeared ionized reflection from the putative accretion disk. Finally, we test the simultaneous alternative modeling of the soft excess, Fe K lines and cold reflection with a second lowly ionized reflection component.
5.1 The Continuum Determination
The combination of the Suzaku and Swift BAT instruments provides an unprecedentedly wide and sensitive spectral coverage from 0.6 keV up to 200 keV. This is fundamental for a correct determination of the underlying X-ray continuum. From this analysis, we exclude the Fe K energy range, E5.5–7.5 keV, because, as discussed in the next section, the presence of spectral complexities in this interval can affect the best-fit continuum model.
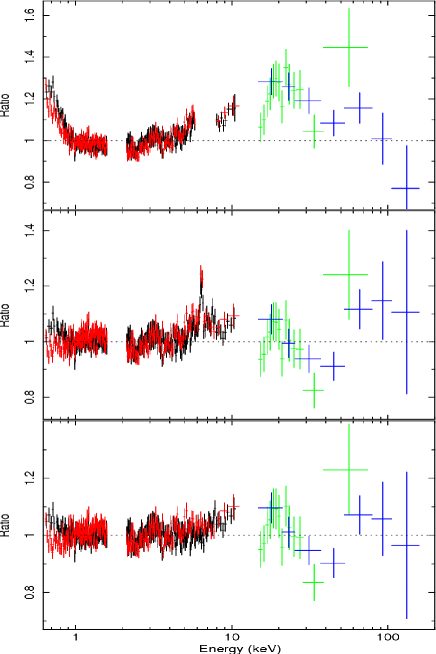
In the upper panel of Figure 2 we show the ratio of the combined XIS03, XIS1, PIN, and BAT spectra with respect to a Galactic absorbed power-law continuum. As seen, this simple model does not provide a sufficient parameterization of the data (5027/3166) and strong deviations are present at both low and high energies. The resultant power-law photon index is 1.88.
At energies lower than 2 keV there is evidence for a soft excess component. This is expected also from previous studies of 3C 382, see § 2. Following previous authors, we initially model the soft excess with a phenomenological blackbody with best-fit temperature 100 eV. This is highly required, with a 1407 for two additional model parameters. The alternative phenomenological modeling with a power-law provides a comparable fit. However, the physical interpretation of the resultant very steep photon index of 5 is more ambiguous and therefore in the following we keep the blackbody parameterization.
The excess flux in the upper panel of Figure 2 between 10–40 keV is
instead indicative of a reflection component. This is also required on
a physical basis by the presence of a narrow Fe K line
(e.g., Lightman et al. 1988), as discussed in the next section.
Therefore, we added a cold reflection component using pexrav in
XSPEC. We assume an inclination angle of 30∘,
typical for BLRGs, and standard solar abundances. This component is
highly required, with a 66 for two model
parameters, significant at 99.99%. The power-law continuum slope
is now 1.85, the high energy cut-off
Ec200–300 keV, and the reflection fraction from pexrav is
R0.36. The final fit is good, with
a reduced chi-squared very close to unity, 3554/3162.
The ratios of the spectra with respect to this best-fit continuum model, including
the Fe K band, are shown in the middle panel of Figure 2.
In conclusion, the broad-band X-ray continuum of 3C 382 is well parameterized by a Galactic absorbed power-law, plus a blackbody soft excess and a reflection component. We use this as the baseline continuum model for the successive search of additional emission/absorption spectral features.
5.2 Search for Emission/Absorption Spectral Features
Looking at the spectral ratios in the middle panel of Figure 2, weak
dips indicating absorption can be seen at E2 keV, as
well as further spectral complexities in the Fe K region. The BLRG
3C 382 is known to exhibit absorption features at energies below 2 keV
due to a warm absorber (Reynolds 1997), recently studied with the
Chandra and XMM-Newton gratings (Reeves et al. 2009; Torresi et
al. 2010). Despite the XIS lower resolution compared to the gratings,
absorption features are visible in Figure 2 (middle panel) around
0.8–1 keV, possibly due to ionized O and Fe L. We thus include a warm
absorber component in our fit, modeled by an XSTAR grid
(Kallman & Bautista 2001). Given the limited S/N and energy
resolution available with respect to the gratings studies, we fix the
gas outflow velocity to 1,000 km/s, consistent with what found by
Reeves et al. (2009) and Torresi et al. (2010). We assumed an ionizing
X-ray power-law with photon index 2 and turbulence velocity
of 500 km/s, similar to what assumed by Reeves et al. (2009).
The inclusion of the warm absorber component is highly significant, 30 for two additional parameters, corresponding to a detection probability 99.99%. We estimate a column density NH cm-2 and an ionization parameter log erg s-1 cm.
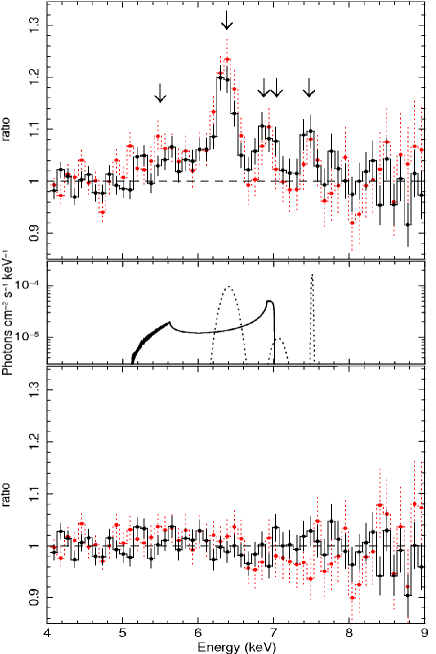
We now reintroduce the E5.5–7.5 keV energy band in the fits. Up to now the fit statistics is . Including the Fe K band, this changes to . The middle panel of Figure 2 and upper panel of Figure 3 show the presence of spectral complexities in the Fe K band. In particular, a prominent emission line is visible at rest-frame energy 6.4 keV, together with several other emission lines in the energy range 5.5–7.5 keV.
As a first step, we modeled these emission features with Gaussians. The most prominent line at E keV is clearly identified with the Fe K from lowly ionized, fluorescent material. The line is resolved, with a width of eV, equivalent width EW eV, and flux I ph s-1 cm-2. The inclusion of this feature yields a 233 for three additional model parameters, which corresponds to a detection probability 99.99%.
Next, we added the associated Fe K component. In the fit, the energy was fixed to the expected value of E7.06 keV, the width was set equal to that of the Fe K and its intensity to 13% of the Fe K (e.g., Molendi, Bianchi & Matt 2003 and references therein). The addition of the Fe K improves the fit by =13.
Three additional emission features are still present in the spectral residuals at energies of E5.8, 6.9, and 7.5 keV. To account for these, we added three more Gaussians to the model. The two lines at higher energies are not resolved. Their energies are at E keV and E keV and have equivalent widths of eV and eV, respectively. The is 21 and 19, for two additional model parameters, which correspond to detection probabilities of 99.99%. The lower energy line at E keV is instead broader and resolved, with a width of eV and equivalent width of eV. Its significance is higher, 58 for three additional parameters, corresponding to a detection probability 99.99%.
The fit with the five Gaussian lines is purely phenomenological, in order to have a first representation of the Fe K complex and a determination of the lines parameters and their significance. All the Gaussian lines are detected with a probability 99.99%. Concerning the identification of the three additional emission lines, the feature at 7.5 keV may well be identified with emission from lowly ionized Ni K, whose atomic transition energy is expected at E7.5 keV (e.g., Molendi, Bianchi & Matt 2003 and references therein). The two remaining lines at 6.9 keV and 5.8 keV are at energies not directly consistent with any significant atomic transitions and therefore have a less obvious physical interpretation. The closest atomic lines to the 6.9 keV line are the Fe XXV He (1s2–1s2p) at E6.7 keV and Fe XXVI Ly (1s–2p) at E6.97 keV (Kallman et al. 2004). However, the identification with one of these lines would require a blue/red-shift of 0.03c or 0.01c, respectively. The 5.8 keV line is even more mysterious, being out of the range expected for Fe K lines, from 6.4 keV up to 7 keV, depending on the ionization. If identified with Fe K emission, the large width and red-shift could suggest strong relativistic effects and an origin close to the central black hole (see next section).
The inclusion of the warm absorber and the emission lines in the Fe K band on the continuum model provides a very good fit, with a 4416/4167. Therefore, the final best-fit model of the combined broad-band Suzaku and Swift BAT spectrum of 3C 382 is rather complex and is composed by a Galactic absorber power-law continuum, a black body soft excess, a cold reflection component, a warm absorber and five Gaussian emission lines in the Fe K band. The best-fit parameters are reported in Table 3. The spectral ratios with respect to this model are shown in the lower panel of Fiure. 2.
5.3 A Relativistic Fe K Emission Line in 3C 382?
Inspection of Figure 3 (upper panel) suggests the intriguing possibility
that the 5.7 keV and 6.9 keV emission features represent two components
of a single, broader feature, i.e. a relativistic Fe K line. More
precisely, they would correspond to the broad red-wing and sharp
blue-peak components of such a line, respectively (e.g., Fabian et
al. 1989). As an initial test to this hypothesis we replaced these
two features with a single relativistic line component, diskline
in XSPEC (Fabian et al. 1989), in the model discussed in the
previous section and reported in Table 3. Therefore, now the Fe K band is
composed by three narrow emission lines, an Fe K and
associated Fe K and Ni K, and a broad relativistic line
(see middle panel of Figure 3).
The diskline model considers a non-rotating Schwarzschild black hole, with spin parameter 0. Given that the fit is not sensitive to the power-law emissivity profile, we assumed the typical value of (e.g., Nandra et al. 2007; de la Calle Perez et al. 2010; Patrick et al. 2010). However, we checked that a different choice of in the wide range from to 0 does not significanly change the parameters estimates reported below, being always consistent at the 90% level.
Interestingly, if the energy of the line is left free to vary, the fit yields a value larger than the expected 6.4 keV for neutral Fe K emission. The formal best-fit centroid is at E6.69 keV, ranging between 6.55 and 7.10 keV at 90% confidence. This indicates that the relativistic Fe K emission originates from ionized material, preferentially Fe XXV He at 6.7 keV rest-frame, but we can not clearly exclude also a contribution from Fe XXVI Ly at 6.97 keV. This supports earlier models claiming that the accretion disk in BLRGs is ionized (Ballantyne et al. 2002), and adds to previous evidence from the Suzaku observations of two other classical BLRGs, 3C 390.3 (Sambruna et al. 2009) and 3C 120 (Kataoka et al. 2007).
Thus, we performed fits assuming, in turn, either emission from Fe XXV or Fe XXVI. In both cases the fit is highly improved, 60 for 4 additional parameters, corresponding to a detection significance 99.99%. The middle panel of Figure 3 illustrates the best-fit model for the three Gaussians and the diskline profile. Assuming Fe XXV (Fe XXVI) emission, we obtain good constraints on the disk inclination (), on the inner and outer radii of the emitting region, ( ) and ( ). Indeed, a tight estimate of was expected from the 6.9 keV peak sharp fall to the blue (see Figure 3, middle panel), while the limited extension of the red “wing” indicates that the inner radius can not extend too further in close to the black hole. The equivalent width of the line is EW eV and the intensity I ph s-1 cm-2.
We stress that the inclusion of the warm absorber has a negligible effect on the Fe K parameters (e.g., Reeves et al. 2004 and references therein). This can be explained by the low level of ionization and small column density of the warm absorber, which implies that only the light elements (C, O, Mg, Ne) are contributing to the absorption at energies below 2 keV.
The final fit with the relativistic line profile is very good, 4435/4168 and the data/model ratio with respect to this model are shown in the lower panel of Figure 3. Given the high quality of the XIS data in 4–10 keV and good determination of the underlying continuum in the wide 0.6–200 keV band, we regard the detection of a broad, relativistic Fe K line in 3C 382 as robust. In support of this, we performed extensive calibration and background tests, which are described in the Appendix.
5.4 Detailed Modeling of the Relativistic Line and Ionized Reflection
Here we discuss in more details the modeling of the broad Fe K line and possible ionized reflection component in the broad-band 0.6–200 keV spectrum. We first examine the broad Fe K profile in light of the possibility that it could be due to a rotating (either prograde or retrograde) black hole. This is possible by using the relativistic line code relline of Dauser et al. (2010), which allows also the black hole spin to vary between 0.998 and 0.998. We use the final best-fit model discussed in § 5.2 and reported in Table 3, substituting the 5.7 keV and 6.9 keV emission lines with a single broad relativistic line.
The main parameters of relline are the rest-frame energy of the line, E, the power-law emissivity profile, , the black hole spin, , the inner and outer radii of the reflecting region, and , the disk inclination, , and the intensity of the emission line, . At first, all the above parameters were free to vary during the fit. Only , , , were constrained. We explored the parameter space in more detail, checking the effects of assuming different values. However, given the limited S/N of the present data and the complexity of the model, we are unable to constrain the spin, emissivity and energy all together. Nevertheless, good fits are obtained for 2–3. The line energy is E6.6–7 keV at 90%, confirming ionized emission. Similar fits are obtained assuming Fe XXV He at E6.7 keV or Fe XXVI Ly at E6.97 keV, with slightly smaller and in the latter case.
We also explored the dependence of the line shape on the black hole
spin by imposing that the inner radius coincide with the Innermost
Stable Circular Orbit (ISCO) of the disk. This corresponds to assuming that
the beginning of the reflection region is coincident with the inner radius of
the disk and that the latter extends down to the ISCO. The ISCO assumes the
following values depending on : 1.23, 6
and 9 for , and , respectively. A series of
fits were performed with the inner radius linked to the ISCO parameter in the
relline model in XSPEC, and leaving free to vary. However,
also in this case we can not still constrain all the parameters simultaneously
and find a clear deep minimum in the statistical distribution. For instance,
given the values in the intervals 1–3, E6.7–6.97 keV and
–, there are several minima, all within a
difference of a few in , and the fit does not reach a
stable convergence.
Therefore, despite the good quality of the present Suzaku data and the broad-band coverage up to 200 keV, no sensitive constraint was possible on the value of the black hole spin, i.e., we obtain similar fits for , , and . Detailed simulations show that much larger exposures are needed, 300 ks, to achieve the goal of measuring with sufficient accuracy to distinguish among a static, prograde or retrograde spinning hole.
Given the results described so far, in the remaining fits to the 0.6–200 keV spectrum of 3C 382 the broad Fe K line energy was fixed to E6.7 keV, 0, and , an intermediate value consistent with Seyferts (Nandra et al. 1997, Patrick et al. 2010, de la Calle Perez et al. 2010). Including this component, the fit is improved by 60 for 4 additional parameters, corresponding to a high detection probability 99.99%. This fit yields and , with . The line intensity is ph s-1 cm-2 and EW eV. This indicates that the broad, ionized Fe K line is produced from a narrow annulus of 10 and 20, i.e., at some distance from the black hole. We checked that a different choice of the in the range to does not change significantly the parameters estimates, being always consistent within the 90% errors.
As discussed above, the presence of ionized Fe K emission lines in the
energy range 6–7 keV provides strong motivation for including an
additional ionized reflection component to our baseline continuum
model. Sophisticated models are known in the literature that include
the proper number of emission lines expected for the fitted ionization
parameter, (e.g., Ross, Fabian & Young 1999; Ross & Fabian
2005; García & Kallman 2010). Two such models,
reflionx (Ross & Fabian 2005) and the more recent
xillver (García & Kallman 2010), are available in
XSPEC for detailed fits. We choose to use the latter, convolved
with the relconv model of Dauser et al. (2010), which takes
into account line blurring due to relativistic effects. We use a
xillver table with log0.8-3.8 erg s-1 cm, standard
solar abundances, and an incident ionizing power-law with
2. Consistent results were obtained using reflionx.
The free parameters of the relconv component are the power-law emissivity profile, inner/outer radii on the disk surface, spin, and inclination angle. The free parameters of xillver are instead the ionization level of the material and the normalization. During the first fits to the 0.6–200 keV spectrum, these parameters were left free to vary. The fits yielded 10 , 25 , inclination 30∘, and ionization parameter log3 erg s-1 cm, while the disk emissivity was less constrained and the spin was unconstrained. After performing a series of tests, we fixed , as no significant changes in the line and continuum parameters were observed within 90% uncertainties if the emissivity profile was left free to vary in the most probable range 2–3. We then linked in relconv, and performed three separate fits for , , and , to explore the dependence on the spin. A slightly better fit was obtained for the case of negative spin, with 2 and 5 higher with respect to the cases with zero or positive rotation. Thus, we conclude again that the quality of the current Suzaku data of 3C 382 does not allow us to constrain the sign of the black hole spin. Future deeper observations (300 ks) are needed to this end. However, given that the fit is slightly better for a spin of and that the overall model parameters are still consistent at the 90% whatever spin is assumed, in the following fits and in Table 4 we fix the spin to this value. The inclusion of the ionized reflection component improves the fit by for four additional model parameters, which correspond to a detection probability of 99.99%.
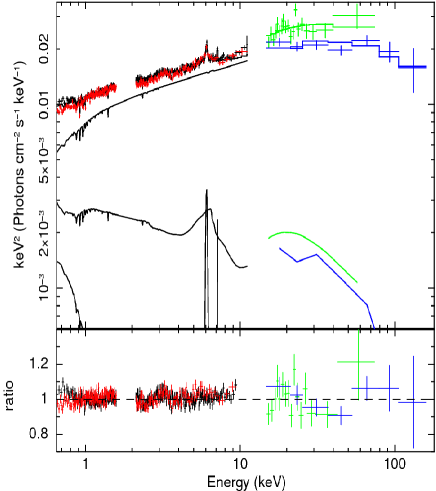
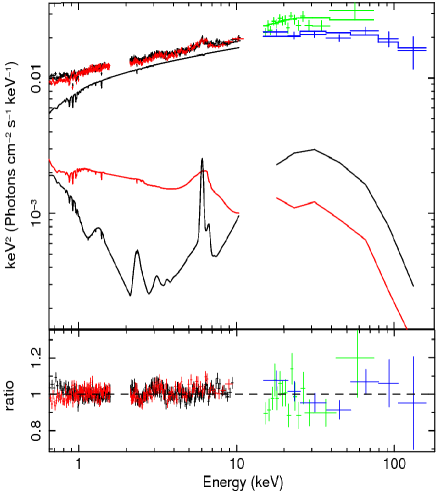
The estimated ionization of the disk reflecting material is log erg s-1 cm, consistent with the Fe ion population being dominated by Fe XXV, with the He at E6.7 keV being the most intense associated resonant line (e.g., Ross, Fabian & Young 1999; Ross & Fabian 2005; García & Kallman 2010). The fitted outer radius is and the inclination , consistent with the more simplistic fits using diskline or relline. The fit is very good, with a reduced chi-squared very close to unity, . The best-fit parameters of this broad-band fit are reported in Table 4, while the data, best-fit model and spectral ratios are shown in the left panels of Figure 4.
5.5 Two ionized reflection components in 3C 382?
It should be noted that the modeling of the soft excess with a simple black body component in the previous sections, besides providing a good representation of the data, might be difficult to explain from a physical point of view. In particular, from a systematic X-ray spectral analysis of PG quasars, Gierlinski & Done (2004) demonstrated that if the soft excess is modeled with a simple black body component, the resultant temperature is in the narrow range 100–200 eV, despite the large range in Eddington luminosities and black hole masses of the sources. The temperature is also too high to be directly associated with standard Shakura-Sunyaev accretion disks. This suggests a possible atomic origin for the soft excess and a promising alternative physical explanation is in terms of a blurred ionized reflection component (e.g., Crummy et al. 2006). However, the modeling of the soft excess is still required after the inclusion of the ionized disk reflection component in the previous section. When parameterized with a black body, it still provides a high improvement of the fit, 538 for two model parameters, which corresponds to a detection probability 99.99%.
The presence of an additional mildly ionized reflection component is required to self consistently model the Fe K/K, Ni K emission lines and reflection hump. In particular, the energy of the Fe K is 6.4 keV for a wide range of ionization, from Fe I to Fe XVII (Kallman et al. 2004). This gives rise to the possibility of simultaneously modeling the soft excess, Fe K lines and reflection hump with an additional reflection component. Therefore, we performed a test replacing the previous pexrav, black body and Fe K Gaussian emission lines with a cutoff power-law continuum and an additional xillver reflection component. To account for the velocity broadening, we convolved the latter with a Gaussian profile with the same width of the Fe K emission line, i.e., 90 eV, which corresponds to FWHM10,000 km/s (see Table 4).
The best-fit values are reported in Table 5. The power-law continuum, warm absorber and relativistic highly ionized reflection parameters are essentially unchanged. The ionization parameter of the mildly ionized reflection is log erg s-1 cm. This is consistent with Fe XIII–XVII being the most abundant Fe ions (Kallman et al. 2004; García, Kallman & Mushotzky 2011). As shown in the right panels of Figure 4, this provides a very good fit, with 4467 for 4174 degrees of freedom. The fit is only slightly worse than that with the model in Table 4. The reduced is 1.06 and 1.07 using the previous and present model, respectively. However, the present model has the strong advantage to physically self-consistently explain all the main spectral features in the broad-band spectrum with the lowest number of model components. This result is remarkably similar to what observed for local Seyfert galaxies (e.g., Nandra et al. 2007; de la Calle Perez et al. 2010; Patrick et al. 2010).
The reflection fraction is conventionally used to estimate the relative contribution of the reflection component with respect to the power-law continuum emission. This parameter is directly derived when using the pexrav model in XSPEC, as in Table 3 and Table 4. This is related to the solid angle covered by the reflecting gas as . However, anisotropies, obscuration and relativistic effects close to the black hole can all influence this simple conventional relation for AGN, to the point that it can become physically meaningless (Crummy et al. 2006; García, Kallman & Mushotzky 2011). Therefore, we define a phenomenological reflection flux fraction, , as the ratio between the unabsorbed 0.5–100 keV flux of the reflection component and continuum. Its value is still comparable to the conventional parameter, (García, Kallman & Mushotzky 2011).
As reported in Table 5, this fraction is about 0.1 for both highly and mildly ionized reflection components, which means that each of them contributes 10% on the overall broad-band spectrum. In particular, the mildly (highly) ionized component contributes 20% (30%) in the 0.5–2 keV, 5% (10%) in the 2–10 keV and 10% (5%) in the 10–200 keV with respect to the power-law continuum (see Figure 4 right, upper panel).
Due to the wide-band coverage allowed by the BAT, very good constraints can be obtained on the power-law continuum energy cutoff. The latter value of 180 keV is completely consistent for both models presented in this section and § 5.4, see Table 4 and Table 5. This clearly suggests a thermal disk-corona origin for the primary power-law. Thus, it is unlikely that the X-ray power-law continuum of 3C 382 is due to a jet.
In conclusion, the broad-band 0.6–200 keV spectrum of 3C 382 can be described by a very complex model composed by a Galactic absorbed power-law continuum, a black body soft excess, a warm absorber, an Fe K emission line and related Fe K, a Ni K emission line, a mildly ionized reflection component and a relativistic smeared ionized reflection component. Alternatively, it can be well represented also by a Galactic absorbed cutoff power-law continuum, a warm absorber and two ionized reflection components: a mildly ionized one which simultaneously reproduces the narrow Fe K emission line, soft excess and high energy hump and a highly ionized one which reproduces the broad relativistic Fe K line. These two models are indistinguishable from a statistical point of view, but the latter provides a more physically self-consistent representation of the data, with the lowest number of model components.
6 The XMM-Newton Spectrum
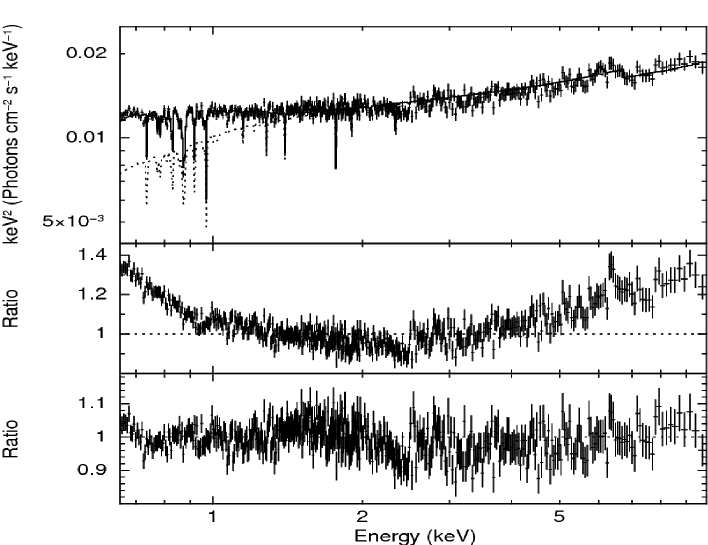
The spectral analysis of the EPIC pn observations was carried out using the heasoft v. 6.5.1 package. As shown in Figure 5, the overall 0.6-10 keV pn spectrum is very similar to the XIS one, albeit at lower S/N due to the lower exposure (factor 6) which compensates for the larger EPIC effective area compared to the XIS cameras. The ratios against a Galactic absorbed power-law continuum are reported in the middle panel of Figure 5. As we can see, the fit is very poor () and the power-law photon index is . Intense emission residuals are present at low and high energes, similar to the Suzaku ones in the upper panel of Figure 2. These deviations indicate the presence of a soft excess and a reflection components.
Because of the lower quality of the data and the spectral similarities, and because the source was in similar intensity states at both epochs (Table 2), we assumed for the EPIC pn the best-fit model previously derived for the Suzaku data from the fits to the broad-band spectrum discussed in § 5.2 and reported in Table 3. We assumed only a cold reflection component modeled with pexrav and fixed the cut-off energy and reflection fraction to their best-fit values. We also assumed only the presence of the narrow Fe K/K emission lines, as indicated by the data.
The fit to the EPIC pn data with this model is good, 1567/1448. The best-fit model and spectral ratios are reported in the upper and lower panels of Figure 5, respectively. The power-law continuum photon index is . The EPIC data confirm the presence of a strong soft excess, with a blackbody temperature k eV and normalization . The warm absorber is also detected, with column density cm-2 and ionization parameter log erg s-1 cm, consistent with Suzaku (§ 5.2).
An unresolved (100 eV) Fe K line is detected at E keV, with a flux ph s-1 cm-2 and EW eV. Due to the lower S/N of the pn data, there is no clear evidence for the associated Fe K and Ni lines present in the XIS data, or for a broad, relativistic Fe K line at 6.67 keV. The 90% upper limit for the latter is EW130 eV.
In summary, an archival 20 ks XMM-Newton EPIC pn observation of 3C 382 was analyzed and found consistent with the best-fit model to the Suzaku XIS data. The observed and intrinsic (corrected from any intervening absorption) fluxes and luminosities in the 0.5–2 keV and 2–10 keV bands from the EPIC pn data are reported in Table 2.
7 Summary of Observational Results
This paper presented a 116 ks Suzaku observation of the Broad-Line Radio Galaxy 3C 382 (=0.057). A shorter (20 ks), unpublished XMM-Newton EPIC exposure was discussed, as well as a Swift BAT spectrum from integrating 5-years of survey observations. The main results of the data analysis are:
The soft X-ray spectrum - Below 2 keV, the XIS data indicate the presence of a warm absorber, with parameters consistent with those derived from the analysis of a previous Chandra HETGS spectrum. The soft excess previously observed is confirmed by both Suzaku and XMM-Newton with an increase in flux between the two epochs of 10%. This component can be well modeled by a phenomenological black body with 100 keV, but a more physical parameterization suggests a possible origin from mildly ionized reflecting material.
The Fe K Region - An intense narrow Fe K emission line is detected at E6.4 keV, together with the associated Fe K component. An additional weak unresolved emission line at E7.5 keV is tentatively observed, possibly identifiable with Ni K. However, more interestingly, a prominent Fe K line with a relativistic profile is found; its center energy is consistent at 90% confidence with emission from ionized Fe, either or both FeXXV/FeXXVI in the energy range 6.55–7.10 keV. The profile is consistent with emission from a disk annulus between inner and outer radii and , respectively, for an assumed disk emissivity . An ionized disk reflection model was included to parameterize this component in the broad-band spectrum.
The spectrum at energies 10 keV - The data at medium and hard X-rays are well described by a power law with , cutting off around E keV. Above 10 keV, contributions from both mildly and highly ionized reflection are present. Each of them contribute 10% on the overall broad-band continuum, but the mildly ionized one has an higher impact at E10 keV.
8 Discussion
This paper presents new results from the analysis of our Suzaku as well as archival XMM-Newton and Swift BAT observations of 3C 382, one of the “classical”, best-studied BLRGs from optical and radio samples. The combination of the Suzaku and BAT data provides an unprecedented sensitive coverage in the energy range 0.6–200 keV, useful to disentangle the various contributions to the total nuclear X-ray emission. At first sight, the broad-band X-ray spectrum of 3C 382 is remarkably Seyfert-like with most, if not all, the characteristics of a typical nearby radio-quiet AGN: a power-law continuum, a warm absorber, soft excess, relativistic Fe K line, and a reflection bump above 10 keV. While typically radio-loud in other wavelengths, with giant radio lobes and a radio-to-optical Spectral Energy Distribution typical of other BLRGs (e.g., Grandi et al. 2001), 3C 382 appears exclusively radio-quiet from an X-ray spectroscopy perspective.
The intrinsic photon index we measure for 3C 382 after accounting for the reflection components is 1.8, similar to most radio-quiet Seyfert 1s observed with Suzaku (e.g., Patrick et al. 2010). Previous observations of 3C 382 at X-rays (§ 2) established that the photon index varies in unison with the flux, in the sense of a softer spectrum for increasing X-ray intensity (Gliozzi et al. 2007 and references therein), a trend 3C 382 shares with radio-quiet, non-jetted AGN. Together with the constraints on the high-energy cutoff of the primary power law, this implies that thermal Comptonization dominates the emission below 100 keV in 3C 382, supporting the idea that the bulk of the X-ray continuum does not originate in a jet. At present, only an upper limit is reported to the gamma-ray GeV emission at the location of 3C 382 in the Fermi 15-months catalog (Abdo et al. 2010). This suggests that the contribution of a jet to the higher energies is weak, or occurs with a small duty cycle. Future Fermi monitoring will be necessary to shed light on the jet activity at high energies from the core of 3C 382.
The high quality and low background of the XIS data allows us to model with high fidelity the Fe-K emission. We confirm the presence of a narrow line at an energy of 6.4 keV, identified with the narrow component of the Fe K line. A similar narrow component, consistent with emission from the Broad Line Region (BLR), was detected in 3C 390.3 (S09) and 3C 120 (Kataoka et al. 2007), two of a handful of well-known, nearby BLRGs observed with Suzaku and is regularly observed in Seyfert 1s (Patrick et al. 2010; Nandra et al. 2007). This line can be modeled with a mildly ionized reflection component with log 1.5 erg s-1 cm (Table 5), which can also simultaneously explain the observed soft excess and part of the reflection hump. This contributes 10% on the power-law continuum.
From the width of the line of FWHM10,000 km/s and assuming that the material is in Keplerian motion in the gravitational potential well of the super-massive black hole, with estimated mass M M☉ (Marchesini et al. 2004), we can derive a typical distance of 0.3 pc. The similarity of the Fe K line width with that of the broad H line in the optical spectrum (Eracleous & Halpern 1994) and the distance on sub-pc scales possibly suggest an origin of this reflecting material from the BLR. Using the distance estimate in the definition of the ionization parameter (Tarter, Tucker & Salpeter 1969), where is the average absorber number density and is the source X-ray ionizing luminosity integrated between 1 Ryd and 1000 Ryd (1 Ryd=13.6 eV), we can derive the density of the material at that location. The absorption corrected ionizing luminosity of 3C 382 is erg s-1. Substituting this value, we can estimate the density of the material of cm-3.
Moreover, we also detected a weak emission line at E7.5 keV, most probably ascribable to Ni K fluorescence emission line from the same material of the Fe K. In particular, the Fe K is expected to be more intense than the Ni K due to the higher cosmic abundance of iron with respect to nickel, about 20 times (Molendi, Bianchi & Matt 2003; Yaqoob & Murphy 2011). However, the ratios of the intensities of the two emission lines suggest a possible slight overabundance of nickel and/or an underabundance of iron of a factor of 2 with respect to the standard solar values (e.g., Anders & Grevesse 1989; Grevesse et al. 1996). Unfortunately, we note that the treatment of Ni lines is not included in the present version of the xillver code (March 2010). However, the possible slight underabundance of iron or overabundance of Ni has negligible effects, within the 1 errors, on the parameters of the mildly ionized reflection component.
Our most interesting result from the Fe K region modeling is the detection of a relativistic profile for the broad component of the Fe K line, confirming a previous tentative ASCA result (Reynolds 1997; S99). The Suzaku data quality is sufficient to provide tight constraints on the disk parameters, albeit in a model-dependent way, in particular on the inner and outer radii of the emitting region and the disk inclination. We find that the bulk of the reprocessing in 3C 382 occurs in a small disk annulus, , located at a distance from the central black hole and at an inclination 25∘–30∘. Substituting the average distance of 15 in the ionization parameter equation and the estimated value of log3 erg s-1 cm (Table 5), we can derive a density for the associated highly ionized reflection component of cm-3. This is a realistic estimate for the inner parts of an accretion disk in AGN (García, Kallman & Mushotzky 2011).
A similar finding - that the innermost disk regions do not contribute to the Fe K emission – was previously reported for other broad-lined radio-loud AGN, the BLRGs 3C 120 and 3C 390.3 (Kataoka et al. 2007, S09), and the quasar/BLRG 4C+74.26 (Larsson et al. 2008). In these sources the inner radius of the Fe K emission was determined to be around 10–50 from fits to the Suzaku data. Thus, a pattern is starting to emerge, whereas the innermost regions of the accretion disk in broad-lined radio-loud AGN do not contribute to the Fe K emission.
A number of plausible physical scenarios have been put forth to explain the above lack of Fe K reprocessing in the innermost radii of the BLRG disks (see S09 and discussion therein). These include a highly ionized ion torus/ADAF occupying the inner disk, obscuration by the base of a jet, or lack of illumination of the inner radii of the disk by the primary power law, due to a mildly beamed source of continuum. An additional possibility is offered in the context of the “flux-trap” scenario (Reynolds et al. 2006; Garofalo 2009).
It is generally believed that jet power is, at least in part, linked to the spin of the central black hole. Radio-loud AGNs have been claimed to harbor rapidly spinning black holes (e.g., Nemmen et al. 2007, and references therein). A scenario for jet power production is provided by the “flux trap” model (Reynolds et al. 2006; Garofalo 2009), which suggests that the plunging region between accretion disks and black holes is fundamental in producing strong, spin dependent, horizon-threading magnetic fields, and therefore powerful jets. Noteworthy, it has been demonstrated that the Blandford & Znajek (1977; BZ) mechanisms is maximized for black hole spin (retrograde) and stronger jets/outflows are expected in this case (Garofalo 2009). This is a direct consequence of the fact that the radius of marginal stability for retrograde black holes, rg for , is much larger than in prograde, rg for , and therefore the plunging region is more extendend and the flux-trapping effect is magnified. In principle, this could be directly tested with X-ray spectroscopy because in the two cases the relativistic Fe K line profile changes significantly (Garofalo, Evans, & Sambruna 2010).
As discussed in § 5.3 and § 5.4, we tested the retrograde/prograde scenario by performing spectral fits to the data with a model that allows the black hole spin to assume negative values (Dauser et al. 2010). While the fit is statistically satisfactory, unfortunately the spin parameter is unconstrained due to the insufficient S/N ratio of the data. However, because of the shape of its Fe K line, 3C 382 qualifies as the best candidate so far for determining the black hole spin in a radio-loud AGN through Fe K line spectroscopy. Longer exposures with Suzaku are required.
3C 382 shares with two other BLRGs (3C 390.3 and 3C 120) the evidence in its X-ray spectrum for emission from an ionized disk, with similar ionization parameters . This supports the previous suggestion by Ballantyne et al. (2002) that ionized disks play a significant role for the X-ray emission of powerful radio-loud AGN. Evidence for ionized material in the nuclear regions of radio-loud AGN is also provided by the detection of extremely ionized outflows/winds with velocities 10,000 km/s, and properties similar to radio-quiet AGN outflows (Tombesi et al. 2010a,b; see also below).
Finally, we compare the X-ray properties of 3C 382 and other BLRGs observed with Suzaku to Seyfert 1s. We started this comparison in our previous paper on 3C 390.3 (S09), where we outlined the average BLRG properties – X-ray photon index, Fe K line widths, and cold reflection strengths – with the then available most current X-ray data for Seyferts from XMM-Newton EPIC observations (Nandra et al. 2007). We noted how the XMM-Newton data for radio-quiet AGN suggested a much larger spread of reflection fractions and line widths for Seyferts than in the ASCA and RXTE era, and how this spread lead to a blur in the distinction between radio-loud and radio-quiet sources. In particular, in BLRGs X-ray reflection and continuum properties occupy one end of the distribution for Seyferts, with significant overlap. We concluded that the division between radio-loud and radio-quiet AGN was blurred, as far as their X-ray spectral properties were concerned (S09).
A more proper comparison is now possible thanks to the recent publication of Suzaku and Swift BAT observations for a relatively large (6 sources) sample of Seyfert 1s (Patrick et al. 2010). From an accurate modeling of the 0.6-100 keV spectra using both cold and ionized reflection models, Patrick et al. (2010) found broad relativistic profiles for the Fe K emission lines in most Seyferts, with average equivalent width for the sample of EW=11919 eV and ionized emission lines at 6.7 and 6.97 keV being relatively common. Intriguingly, the Fe K emission seems to arise from tens of rg from the central black hole (see also Nandra et al. 2007); fits with models allowing the black hole spin to vary, although in the 0–1 range only, yield typically intermediate values, . Both cold and ionized reflection is required to describe the data above 10 keV; the cold reflection fraction, however, varies from source to source from less than 0.4 up to 2.5 (see Table 4 in Patrick et al. 2010). The intrinsic X-ray photon index is , consistent with Comptonization models. However, the ionization parameter of the ionized disk reflection seems to be lower in the Seyferts, consistent with neutral or lowly ionized Fe, while interestingly so far the BLRGs seem to suggest high ionization disk lines (He and H-like iron), although based on small number statistics so far.
Thus, comparison of the broad-band 0.6–200 keV spectra of BLRGs and Seyfert 1s obtained with Suzaku and the BAT confirm and reinforce the conclusion (S09) that there is a continuum of X-ray properties between the two AGN subclasses, with radio-loud sources clustered at one end of the distribution. An important consideration, however, is that in both subclasses – aside for a few egregious examples – the innermost rg of the accretion disk do not contribute significantly to Fe K emission. The reason for this may be different in the two subclasses, and would remain of central importance for the radio-loud/radio-quiet AGN division.
Another major progress since S09 is the discovery that radio-loud AGNs have ionized, outflowing material from the central nuclei, similar to Seyferts (e.g., Tombesi et al. 2010a,b), contrary to what stated in S09 based on the then available evidence. Indeed, our Suzaku observations of 5 BLRGs provided evidence for ultra-fast disk outflows in 3/5 sources (Tombesi et al. 2010b) with velocities c, kinetic power erg s-1, and mass outflow rates comparable to the accretion rates. As mentioned above and in § 2, 3C 382 itself presents evidence for a highly ionized, kpc-scale outflow through a series of soft X-ray absorption features detected with the Chandra and XMM-Newton gratings (Reeves et al. 2009; Torresi et al. 2010), although with a much lower velocity of 1,000 km/s. The presence of ionized material along the line of sight is puzzling and its relation with the relativistic jet must be studied in much detail. As already discussed in Tombesi et al. (2010b), we did not detect any significant highly ionized Fe K absorption line in the present observation of 3C 382.
The overlapping X-ray continuum and reflection properties of BLRGs and Seyferts point to a common accretion flow structure, with similar radiative processes in place that account broadly for the X-ray emission. The reason why powerful, relativistic jets are present in BLRGs but not in Seyferts with similar engines could very well be identified in a process unrelated to the accretion dynamics – i.e., the black hole spin. Several theoretical studies along this line are underway, and the wealth of high-quality data that Suzaku continues to provide is essential to test the model predictions in the X-ray band, paving the way for the upcoming high-precision spectroscopy with the Astro-H observatory.
Appendix A Background and Calibration tests for the XIS
We performed detailed background and calibration tests for the three XIS detectors to exclude possible issues affecting the Fe K region, and thus the results of our modeling described above. Background contamination could alter the profile of the Fe line; however, for the 3C 382 observation analyzed here, we estimate that the background contribution to 0.6–10 keV is negligible, amounting to 4–8% of the source counts.
It is well known that the XIS CCDs contain a 55Fe calibration source, located on two corners of the XIS chips, which produces a characteristic X-ray line from Mn K at E5.895 keV. Its intrinsic width is 50 eV and it is used to calibrate the energy and width of the iron line (Koyama et al. 2007). We can clearly exclude any possible significant contamination of the broad line detected at the rest-frame energy of E5.8 keV from this calibration source on board the XIS. In fact, we checked the images of the three separate XIS cameras and find that the source is located in the center of the CCD, far from the calibration sources, which are in two corners. Moreover, the observed energy of the broad line is at E5.45 keV, which is not consistent with that expected from the calibration source, and the calibration line is intrinsically narrower compared with the 400 eV of the 3C 382 feature.
As already discussed in § 3.1 the combined XIS-FI and XIS-BI fit is supported by the consistency of the power-law slope and 2–10 keV flux within 2%. Moreover, as already reported in § 4, we checked that the presence of two low amplitude (5%) spikes in the XIS 3 light curve, see Figure 1, have negligible effects on the overall spectral analysis. This is expected from the fact that we focused on the average spectrum and the weak short time-scale spikes involved less than 20% of the exposure. These are most probably ascribable to weak instrumental fluctuations. We directly analyzed the three XIS cameras separately and ensured that there is an agreement at 1% for both the power-law continuum slope and 2–10 keV flux between the XIS 0 and XIS 3 and at 2% between the front illuminated XIS 0-3 and back illuminated XIS 1.
Finally, the spectra of the individual XIS camera were fitted separately for a consistency check of the emission line parameters. Unfortunately, the quality of the individual camera spectra does not allow us to leave all line parameters free to vary during the fit. Using the best-fit model determined from the analysis of the joint spectra (see Table 3), and freezing the lines energies and widths, we find that the EWs of the emission lines are always consistent at 90% among the separate XIS instruments and the combined XIS-FI and XIS-BI fit.
References
- (1)
- (2) Abdo, A. A., et al. 2010, ApJ, 720, 912
- (3) Anders, E., & Grevesse, N. 1989, Geochim. Cosmochim. Acta, 53, 197
- (4) Antonucci, R. 1993, ARA&A, 31, 473
- (5) Ballantyne, D.R., Ross, R.R., & Fabian, A. C. 2002, MNRAS, 332, L45
- (6) Ballantyne, D.R. 2007, Mod. Phys. Lett. A, 22, 2397
- (7) Barr, P., & Giommi, P. 1992, MNRAS, 255, 495
- (8) Baumgartner et al. 2010, ApJS, submitted
- (9) Blandford, R. D., & Znajek, R. L. 1977, MNRAS, 179, 433
- (10) Blandford, R.D. 1985, in Active Galactic Nuclei, ed. J.E.Dyson, Manchester Univ. Press: Manchester, p. 281
- (11) Boldt, E. 1987, PhR, 146, 215
- (12) Braito, V., Reeves, J. N., Sambruna, R. M., & Gofford, J. 2011, arXiv:1102.5234
- (13) Crummy, J., Fabian, A. C., Gallo, L., & Ross, R. R. 2006, MNRAS, 365, 1067
- (14) Dauser, T., Wilms, J., Reynolds, C. S., & Brenneman, L. W. 2010, MNRAS, 409, 1534
- (15) de La Calle Pérez, I., et al. 2010, A&A, 524, A50
- (16) Dickey, J. M., & Lockman, F. J. 1990, ARA&A, 28, 215
- (17) Dower, R. G., Bradt, H. V., Doxsey, R. E., Johnston, M. D., & Griffiths, R. E. 1980, ApJ, 235, 355
- (18) Eracleous, M. & Halpern, J.P. 1994, ApJS, 90, 1
- (19) Eracleous, M. & Halpern, J.P. 1998, ApJ, 505, 577
- (20) Eracleous, M., Sambruna, R.M., & Mushotzky, R.F. 2000, ApJ, 537, 654
- (21) Fabian, A. C., Rees, M. J., Stella, L., & White, N. E. 1989, MNRAS, 238, 729
- (22) García, J., & Kallman, T. R. 2010, ApJ, 718, 695
- (23) García, J., Kallman, T. R., & Mushotzky, R. F. 2011, arXiv:1101.1115
- (24) Garofalo, D. 2009, ApJ, 699, 400
- (25) Garofalo, D., Evans, D. A., & Sambruna, R. M. 2010, MNRAS, 406, 975
- (26) Gierliński, M., & Done, C. 2004, MNRAS, 349, L7
- (27) Gliozzi, M., Sambruna, R. M., Eracleous, M., & Yaqoob, T. 2007, ApJ, 664, 88
- (28) Grandi, P., Maraschi, L., Urry, C. M., & Matt, G. 2001, ApJ, 556, 35
- (29) Grevesse, N., Noels, A., & Sauval, A. J. 1996, Cosmic Abundances, 99, 117
- (30) Hardcastle, M. J., Alexander, P., Pooley, G. G., & Riley, J. M. 1998, MNRAS, 296, 445
- (31) Hartman, R. C., Kadler, M., & Tueller, J. 2008, ApJ, 688, 852
- (32) Kalberla, P. M. W., Burton, W. B., Hartmann, D., Arnal, E. M., Bajaja, E., Morras, R., Pöppel, W. G. L. 2005, A&A, 440, 775
- (33) Kallman, T. R., Palmeri, P., Bautista, M. A., Mendoza, C., & Krolik, J. H. 2004, ApJS, 155, 675
- (34) Kataoka, J. et al. 2007, PASJ, 59, 279
- (35) Koyama, K., et al. 2007, PASJ, 59, 23
- (36) Kokubun, M. et al. 2007, PASJ, 59, 53
- (37) Larsson, J., Fabian, A. C., Ballantyne, D. R., & Miniutti, G. 2008, MNRAS, 388, 1037
- (38) Lightman, A. P., & White, T. R. 1988, ApJ, 335, 57
- (39) Longair, M. S., & Seldner, M. 1979, MNRAS, 189, 433
- (40) Marchesini, D., Celotti, A., & Ferrarese, L. 2004, MNRAS, 351, 733
- (41) Martel, A. R., et al. 1999, ApJS, 122, 81
- (42) Matthews, T. A., Morgan, W. W., & Schmidt, M. 1964, ApJ, 140, 35
- (43) Molendi, S., Bianchi, S., & Matt, G. 2003, MNRAS, 343, L1
- (44) Nandra, K., O’Neill, P. M., George, I. M., & Reeves, J. N. 2007, MNRAS, 382, 194
- (45) Nemmen, R. S., Bower, R. G., Babul, A., & Storchi-Bergmann, T. 2007, MNRAS, 377, 1652
- (46) Patrick, A. R., Reeves, J. N., Porquet, D., Markowitz, A. G., Lobban, A. P., & Terashima, Y. 2010, arXiv:1010.2080
- (47) Prieto, M. A. 2000, MNRAS, 316, 442
- (48) Puschell, J. J. 1981, AJ, 86, 16
- (49) Reynolds, C. 1997, MNRAS, 286, 513
- (50) Reynolds, C. S., Garofalo, D., & Begelman, M. C. 2006, ApJ, 651, 1023
- (51) Reeves, J. N., Nandra, K., George, I. M., Pounds, K. A., Turner, T. J., & Yaqoob, T. 2004, ApJ, 602, 648
- (52) Reeves, J. N., Sambruna, R. M., Braito, V., & Eracleous, M. 2009, ApJ, 702, L187
- (53) Ross, R. R., Fabian, A. C., & Young, A. J. 1999, MNRAS, 306, 461
- (54) Ross, R. R., & Fabian, A. C. 2005, MNRAS, 358, 211
- (55) Sambruna, R.M., Eracleous, M., & Mushotzky, R. 1999, ApJ, 526, 60 (S99)
- (56) Sambruna, R.M., Eracleous, M., & Mushotzky, R.F. 2002, NewAR, 46, 215
- (57) Sambruna, R. M., et al. 2009, ApJ, 700, 1473 (S09)
- (58) Saunders, R., Baldwin, J. E., Rawlings, S., Warner, P. J., & Miller, L. 1989, MNRAS, 238, 777
- (59) Spergel, D. N., et al. 2003, ApJS, 148, 175
- (60) Strom, R. G., Willis, A. G., & Wilson, A. S. 1978, A&A, 68, 367
- (61) Tadhunter, C. N., Perez, E., & Fosbury, R. A. E. 1986, MNRAS, 219, 555
- (62) Tadhunter, C. N., Fosbury, R. A. E., & Quinn, P. J. 1989, MNRAS, 240, 225
- (63) Tarter, C. B., Tucker, W. H., & Salpeter, E. E. 1969, ApJ, 156, 943
- (64) Tombesi, F., Cappi, M., Reeves, J. N., Palumbo, G. G. C., Yaqoob, T., Braito, V., & Dadina, M. 2010, A&A, 521, A57 (Tombesi et al. 2010a)
- (65) Tombesi, F., Sambruna, R. M., Reeves, J. N., Braito, V., Ballo, L., Gofford, J., Cappi, M., & Mushotzky, R. F. 2010, ApJ, 719, 700 (Tombesi et al. 2010b)
- (66) Torresi, E., Grandi, P., Longinotti, A. L., Guainazzi, M., Palumbo, G. G. C., Tombesi, F., & Nucita, A. 2010, MNRAS, 401, L10
- (67) Urry, C.M. & Padovani, P. 1995, PASP, 107, 803
- (68) Yaqoob, T., & Murphy, K. D. 2011, MNRAS, 18
- (69)
| Satellite | OBSID | Date | Instrument | Net expo | Rate |
|---|---|---|---|---|---|
| (ks) | (cts/s) | ||||
| Suzaku | 702125010 | 2007 April 27 | XIS-FI | 116 | 2.399/1.219 |
| XIS-BI | 116 | 1.613/1.177 | |||
| PIN | 113 | 0.114 | |||
| XMM-Newton | 0506120101 | 2008 April 28 | EPIC pn | 21 | 15.650/4.220 |
| Swift | J1835.03240 | BAT | 4276 | 0.001 |
Note. — The count rates refer to each instrument separately and are in the 0.5–2/2–10 keV band for XIS-FI, XIS-BI and EPIC pn, 14–70 keV band for the PIN and 15–100 keV band for the BAT.
| Energy | Suzaku | XMM | ||
|---|---|---|---|---|
| (keV) | Flux | Lum | Flux | Lum |
| 0.5–2 | ||||
| 2–10 | ||||
| 15–200 | ||||
Note. — The observed (un-absorbed) flux is in units of erg s-1 cm-2. The observed (un-absorbed) luminosity is in units of erg/s.
| Pexrav | ||||
|---|---|---|---|---|
| Ec | ||||
| (keV) | (deg) | |||
| 30 | 4416/4167 | |||
| Warm absorber | ||||
| NH | log | |||
| ( cm-2) | (erg s-1 cm-2) | (km/s) | ||
| 1000 | ||||
| Black body | ||||
| T | Norm | |||
| (eV) | ()aaNormalization of the blackbody model in units of , where is the source luminosity in erg s-1 and the distance of the source in units of 10 kpc. | |||
| Gaussians | ||||
| E | EW | ID | ||
| (keV) | (eV) | ( ph s-1 cm-2) | (eV) | |
| Fe K | ||||
| Fe K | ||||
| Ni K | ||||
Note. — Energy of the line, rest-frame (observed frame). Errors are at the 1 level.
| Pexrav | ||||
|---|---|---|---|---|
| Ec | ||||
| (keV) | (deg) | |||
| 30 | 4430/4168 | |||
| Warm absorber | ||||
| NH | log | |||
| ( cm-2) | (erg s-1 cm-2) | (km/s) | ||
| 1000 | ||||
| Black body | ||||
| T | Norm | |||
| (eV) | ()aaNormalization of the blackbody model in units of , where is the source luminosity in erg s-1 and the distance of the source in units of 10 kpc. | |||
| Gaussians | ||||
| E | EW | ID | ||
| (keV) | (eV) | ( ph s-1 cm-2) | (eV) | |
| Fe K | ||||
| Fe K | ||||
| Ni K | ||||
| Relconv | ||||
| () | (deg) | |||
| Xillver | ||||
| log | Norm | |||
| (erg s-1 cm) | () | |||
Note. — Energy of the line, rest-frame (observed frame). Errors are at the 1 level.
| Cutoff power-law | |||
|---|---|---|---|
| Ec | |||
| (keV) | |||
| 4467/4174 | |||
| Warm absorber | |||
| NH | log | ||
| ( cm-2) | (erg s-1 cm-2) | (km/s) | |
| 1000 | |||
| Xillver (mildly ionized) | |||
| log | Norm | ||
| (erg s-1 cm) | () | ||
| 0.10 | |||
| Relconv | |||
| () | (deg) | ||
| Xillver (highly ionized) | |||
| log | Norm | ||
| (erg s-1 cm) | () | ||
| 0.11 | |||
Note. — Energy of the line, rest-frame (observed frame). Errors are at the 1 level.