Variations of Flux Intensity in Large Features and Spectral Lines of CVn in Ultraviolet ††thanks: Based on data from the satellite.
Abstract
Variation of intensity of the flux at the cores of large features and spectral lines of the classical magnetic CP star CVn in the ultraviolet spectral region from 1150 to 3200 Å is investigated. This study is based on the archival International Ultraviolet Explorer data obtained at different phases of the rotational cycle. The shapes of two light curves at 1375 and 1415 Å at the core of large feature at 1400 Å curves significantly differ. The light curve at 1375 Å show similar shape as in the ’pseudo-continuum’. The same behavior of the flux is at the cores of Si II resonance lines at 1260–64 and 1485 Å. While, the light curve at 1415 Å show the phase displacement of minimum of the flux. The phase displacement also is presented at the cores of Si II resonance lines at 1304–09 and 1485 Å. The minimal values of the amplitude of the flux variations are reached at the cores of the large features at 1560 and 1770 Å and at the cores of the strong Si II resonance lines. The flux at the cores of large feature at 1770 Å and Fe II resonance line at 1725–31 Å, within errors measurements, does not vary. The investigation of variability of the flux in the wings of line indicate that the fluxes, which formed in inner layers of atmosphere, are redistributed into outer layers of atmosphere of CVn.
Key words: stars: chemically peculiar – stars: individual: CVn – stars: variables: other.
1 Introduction
The magnetic Chemically Peculiar (mCP) star CVn (HD 112413, HR 4915) displays strong line profile variations in the visual spectral region, attributable to the non-uniform chemical abundance distribution on stellar surface, particularly of the lines of Fe, Cr and Ti (Khokhlova & Pavlova 1984), Eu, Cr and Si (Goncharskii et al. 1983) and O (Gonzalez & Artru 1994). Ryabchikova et al. (1999) report the first identification of the Eu III 6666.347 line in spectrum CVn. Later Kochukhov et al. (2002) used the new magnetic Doppler Imaging code to reconstruct the magnetic field geometry and surface abundance distributions for six chemical elements of this star.
The study in the ultraviolet have been restricted to much lower resolution, usually without resolving individual stellar lines (e.g., Leckrone & Snijders 1979). Hensberge et al. (1986) identified the ions Mg II Si II, Cr II, Mn II, Fe II, Fe III, Co II, Ni II, Yb II and W II in the mid-ultraviolet spectrum of CVn, which has been obtained with the BUSS (Balloon-Borne Ultraviolet Spectrograph). High-dispersion IUE observations of the two resonance lines of Mg II, at 1650 and 1942 Å, were investigated by Leckrone (1984) for two normal stars, six HgMn stars and for the magnetic variable CVn. The last star possesses moderately strong Hg II resonance lines, confirming its classification as Hg-rich, but its magnesium anomaly is less pronounced than that of the MgMn stars. Fuhrmann (1989) investigated the high-resolution spectra of the CP star HR 465. For comparison purposes, the spectra of some other stars, including CVn, were discussed as well. The author have noted that the C II resonance doublet at 1334.5–1335.7 Å are comparatively weak in the spectrum of CVn.
To quantify the ultraviolet variations of the C IV doublet at 1548, 1550 Å, Shore et al. (1987) have formed the photometric line index, expressed in magnitudes. Later, Sokolov (2000, 2006) had introduced the analogous photometric indices in order to derive the variations of the total absorption in the broad features at far-UV spectral region. Unfortunately, these indices depends strongly upon the stability of the intensity of the near continuum. Based on the fact that the IUE Newly Extracted Spectra (INES) data are presented in absolute units, it is possible to investigate the variations of the fluxes at the cores of the large features and spectral lines. Recently, such attempt was made by Sokolov (2010) for mCP star 56 Ari. Another mCP star is CVn for which there are enough IUE data in order to investigate the variability of the flux at the cores of the large features and spectral lines. This is done in the present paper.
2 Observational Data and Analysis
2.1 IUE spectra
The IUE spectra used in this study are low-resolution echelle spectra obtained with a resolution of about 6 Å. Additionally, the ’rebinned’ spectra from high-dispersion images of CVn were used, as well. In all cases, the spectra were obtained through the large aperture (9.5′′ 22′′). Finally, we analyzed 22 SWP, 10 LWR and 6 LWP spectra, distributed quite smoothly over the period of rotation. The description of these IUE spectra in detail is done by Sokolov (2011).
2.2 Data analysis
To analyze the IUE spectra of CVn we used the linearized least-squares method. An attempt was made to describe the light curves in a quantitative way by adjusting a Fourier series. The method has already applied to the IUE data of CVn and has shown the very good descriptions of the monochromatic light curves in the ’pseudo-continuum’ (Sokolov 2011). Thus, the observations were also fitted by a simple cosine wave:
| (1) |
where is a flux for the given and the is Julian date of the observation. The and are zero epoch and rotational period of Farnsworth (1932) ephemeris, respectively. The coefficients of the fitted curves define the average distribution of energy over the cycle of the variability while the coefficients define the semi-amplitude of the flux variations for the given .
3 Identification of Large Features and Spectral Lines in the Spectrum of CVn
In the far-UV spectral region silicon appears as the main absorber with the strong resonance lines at 1260–64, 1304–09, 1485, 1526–33 Å (see Fig. 2 of Sokolov 2011). It should be noted that the blend at 1304–09 Å has two major contributors: the resonance doublet and the autoionising multiplets (Artru & Lanz 1987). According to Artru & Lanz (1987), the strong lines in the spectrum of CP stars appear from C II at 1334 Å and Al II at 1671 Å, which is close to a strong C I at 1657 Å line. Fe II form a depression at 1725–31 Å and Cr II produces line at 1434 Å. Although in the case of CVn the line from C II at 1334 Å is not detectable at this resolution. Moreover, the C II resonance doublet at 1334.5–1335.7 Å are comparatively weak at the high-resolution spectrum of this star (Fuhrmann 1989).
In previous study of the star 56 Ari we identified which elements are responsible for depressions of the flux centered at 2140, 2250, 2540, 2607, 2624 and 2747 Å (Sokolov 2010). The synthetic spectrum calculation showed that Fe II appears as the main absorber for these depressions. On the other hand, the same synthetic spectrum calculation showed that mainly Fe, Cr and Ni are responsible for depression of the flux at 2140 Å. Comparison of the average energy distribution of CVn with the average energy distribution of 56 Ari showed that the depressions of the flux centered at 2140, 2250, 2540, 2607, 2624 and 2747 Å also is presented in the spectrum of CVn. It is well known that Mg II resonance lines at 2795, 2798 and 2803 Å are responsible for depression of the flux at 2800 Å. This depression is not detectable at low-resolution mode in the spectrum of CVn. Prominent depressions of the flux in the near-UV spectral region are indicated in Fig. 1 with their identification. In order to compare the average distributions of energy of CVn and 56 Ari, the fluxes of 56 Ari were increased by the factor ten on Fig. 1.
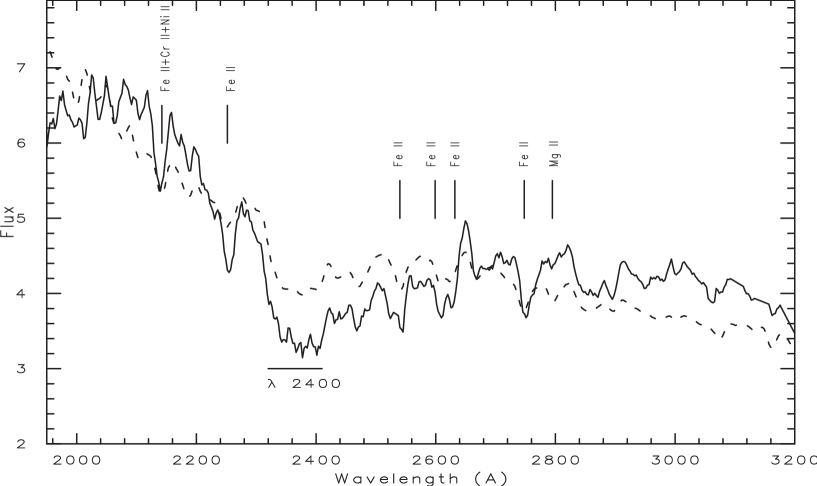
Four large features at 1400, 1560, 1770 and 2350–2400 Å, which are strongly enhanced in the spectrum of CP stars, are well seen in spectrum of CVn. Lanz et al. (1996) have given strong arguments supporting the idea that the intense autoionization resonanses of Si II could explain the features at 1400 and 1560 Å in the spectrum of CP stars. On the other hand, they were unable to identify the depression of the flux at 1770 Å. Another element may cause this strong depression. Comparison of the IUE high resolution spectrum of 56 Ari with the full synthetic spectrum as well as those including lines from only one element showed that the iron is responsible for depression of the flux at 1770 Å (see Fig. 9 of Sokolov 2006). It is necessary to note that this depression is considerably increased in spectrum of CVn than in spectrum of 56 Ari. The large feature at 2350–2400 Å which are strongly enhanced in the spectrum of CP stars, are well seen in spectrum of CVn. The lines of iron peak elements have a particularly important contribution to opacity at 2350–2400 Å. Adelman et al. (1993) have given strong arguments supporting the idea that a large number the lines of iron can explain the feature at 2350–2400 Å. Many CP stars have here a very pronounced depression of the flux compared to normal stars (Stepień & Czechowski 1993).
4 Average Flux Determination at the Cores of Large Features and Spectral Lines in the Spectrum of CVn
To measure the absorption at the cores of large features, the spectra were processed using the spectral reduction software spe developed by S. Sergeev at the Crimean Astrophysical Observatory (CrAO). The program allows measuring the average intensity of the flux and corresponding error in any selected rectangular spectral region. For the large features at 1560 and 1770 Å spectral regions are 10 Å wide, while for the largest feature at 1400 Å two spectral regions were selected and centered at 1375 and 1415 Å. On the other hand, for the large feature at 2350–2400 Å the spectral region was used with 50 Å wide and centered at 2375 Å.
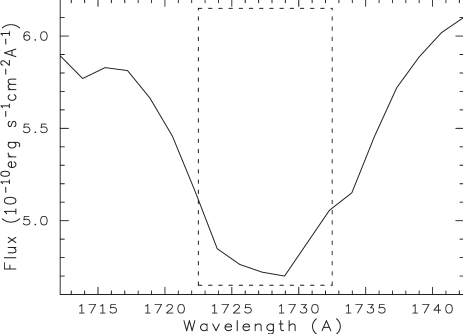
The resonance doublets of Si II and Fe II lines are looked as depressions in the IUE low-resolution spectrum of CVn, as illustrated by Fig. 2. Thus, the average intensity of the flux at the cores of the spectral lines was computed by averaging five nearest fluxes for a given :
| (2) |
where is equal 1.676 Å for SWP camera and is equal 2.669 Å for LWR and LWP cameras. As far as the errors in are concerned, we computed them by taking into account the the errors in the fluxes as presented in INES , according to the standard propagation theory of errors. In order to check reliability of the average intensity of the flux at the cores of the spectral lines, the spectra were also processed using program spe. Experience showed that within errors of measurements the average intensity of the fluxes computed by program spe and by using equation 2 are the same.
4.1 Variations of Large Features
Figure 3 exhibits the variations of the average intensity of the fluxes at the cores of large features versus the rotational phase. First of all, the shapes of two light curves at the core of large feature at 1400 Å significantly differ. The minimum of the light curve at 1375 Å is reached at phase 0.05 while the minimum of the light curve at 1415 Å is at phase 0.26. Although, the amplitudes of two light curves at 1375 and 1415 Å are approximately the same and are equal to 0.41 and 0.32 , respectively. According to the model computation of Lanz et al. (1996), two features at 1400 and 1560 Å are connected with the intense autoionization resonance of Si II. Qualitative comparison of the light curves at 1375 and 1560 Å shows the good agreement. The minimum of the light curve at 1375 Å is reached at phase 0.05 while the minimum of the light curve at 1560 Å is at phase 0.10. Also, the amplitudes of two light curves at 1375 and 1560 Å are approximately the same and are equal to 0.41 and 0.38 , as illustrated by Fig. 3.
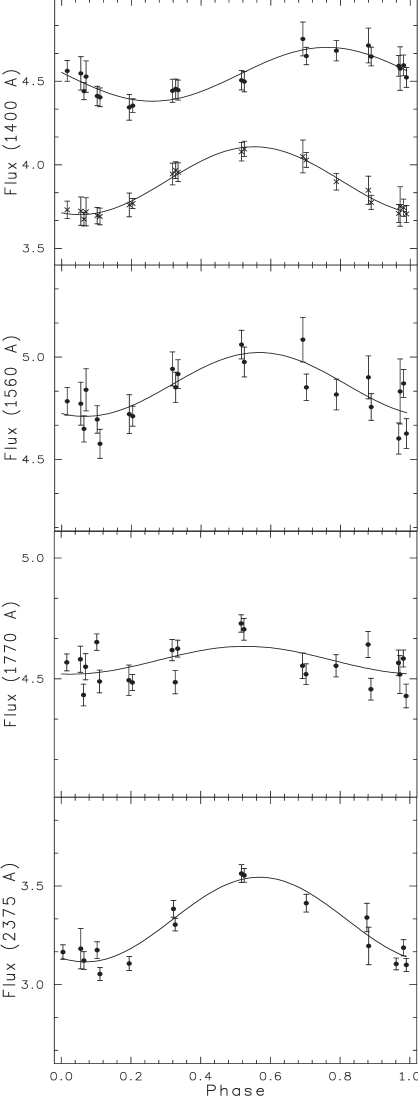
The identification of two features at 1770 and 2375 Å are connected with a large concentration of iron lines (see Sect. 3). The flux variations at the cores of the features at 1770 and 2375 Å also significantly differ. Thus, the amplitude of the light curve at the core of the feature at 1770 Å is equal to 0.11 . Practically, the flux at the core of this feature, within errors measurements, does not vary. On the other hand, the amplitude of the light curve at the core of the feature at 2375 Å is equal to 0.43 . Although, the shapes of light curves are approximately the same, as illustrated by Fig. 3. One can see, that the behavior of the flux is different at the cores of large features, even if the same element is responsible for the features. This puzzling situation was one of the incentives for studying the variations of the flux at the cores of the Si II resonance lines and the depressions for which is responsible a concentration of Fe II lines.
4.2 Variations of Si II Resonance Lines
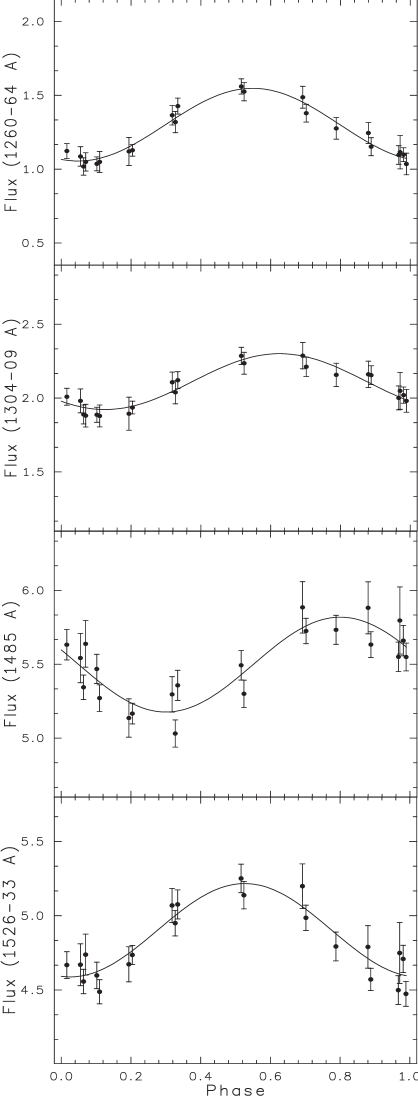
Even for the normal stars, Si II appears as the main absorber with the strongest resonance lines recognizable at 1260–64, 1304–09, 1485, 1526–33 Å (Artru & Lanz 1987). Figure 3 exhibits the variations of the flux at the cores of these depressions versus the rotational phase. Note that the vertical scales are the same for each part of the figure. One can see from Fig. 3, the light curves have the similar shapes in cores of resonance lines at 1260–64 and 1526–33 Å. The minima of the light curves at 1260–64 and 1526–33 Å are reached at phases 0.05 and 0.02, respectively. The similar behavior also shows the nearest monochromatic light curves in the ’pseudo-continuum’ (see Fig. 3 of Sokolov 2011). Also, the amplitudes of the light curves at the cores of the depressions at 1260–64 and 1526–33 Å are in the good agreement and are equal to 0.49 and 0.63 , respectively. It should be noted that the similar shape shows the light curve at 1375 Å. On the other hand, the minima of the light curves at 1304–09 and 1485 Å are reached at phases 0.12 and 0.30, as illustrated by Fig. 3. Although, the minima of the monochromatic light curves are reached at phase 0.0 in the nearest ’pseudo-continuum’. Moreover, the amplitudes of the light curves are different at 1304–09 and 1485 Å and are equal 0.38 and 0.64 , respectively. It should be noted that the similar shape shows the light curve at 1415 Å. The monochromatic light curves in the near-UV spectral region with 2505 Å in the ’pseudo-continuum’ also shows such behavior. The near-UV spectral region is quite important in order to investigate the variability of the flux at the cores of Fe II lines.
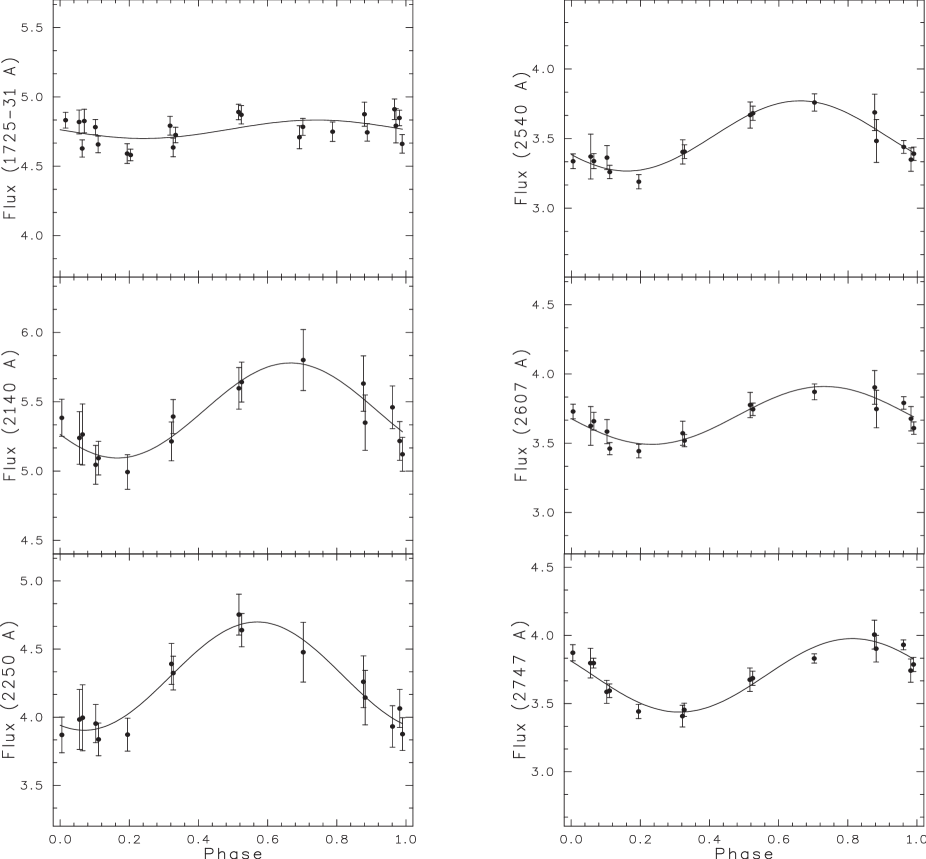
4.3 Variations of Fe II Lines
In the far-UV spectral region Fe II doublet at 1725–31 Å gives only one depression of the flux (Artru & Lanz 1987). The synthetic spectrum calculation showed that Fe II appears as the main absorber of the flux at 2250, 2540, 2607, 2624 and 2747 Å (see Sect. 3). Additionally, the depression of the flux at 2140 Å was included in our investigation. On the other hand, two depressions of the flux at 2607 and 2624 Å showed the same behavior. Thus, we have included in our investigation only the depression of the flux at 2607 Å. Figure 4 exhibits the variations of the average intensity of the flux at the cores of Fe II lines versus the rotational phase. Note that the vertical scales are the same for each part of the figure. As can be seen on the graphs of Fig. 4, the variability of the flux at the cores of Fe II lines shows by about the same behavior as the monochromatic light curves with 2505 Å in the ’pseudo-continuum’ (see. Fig. 3 of Sokolov 2011). The light curves at the cores of of Fe II lines are showing the phase displacement of the minimum of the flux from 0.07 at 2250 Å to 0.31 at 2747 Å. Additionally, the minimum of the light curve at the core of of Fe II lines at 2140 Å is at phase 0.16. Although, the amplitude of the light curve at 2140 Å is big enough and is equal to 0.69 . Possibly, it is because mainly three chemical elements (Fe, Cr, Ni) are responsible for this depression. The monochromatic light curves in the ’pseudo-continuum’ only with 2505 Å shows the same phase displacement of the minimum of the flux. It should be noted that the amplitudes of the light curves here are bigger than at the cores of Fe II lines. On the other hand, the light curve at the core of Fe II resonance line at 1725–31 Å where the amplitude is equal to 0.13 . As at the core of large feature at 1770 Å, the flux does not vary at the core of this line. Although, the variability of the flux in the nearest ’pseudo-continuum’ is significant. Thus, the amplitudes of the monochromatic light curves at 1690 and 1794 Å are equal 0.41 and 0.51 , respectively.
4.4 Variations of Lyman-Alpha Line
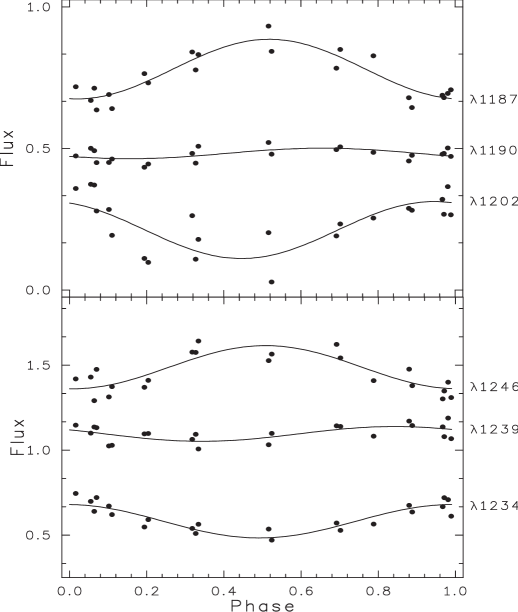
Leckrone & Snijders (1979) have compared Lyman-alpha () profiles of CVn at two phases 0.0 and 0.5, using data. The authors have drawn the conclusion that brightness variations at the core of line are anomalous with respect to the adjacent ultraviolet regions. In addition, they noted that coverage of the complete cycle by a future space instrument will be necessary to establish the specific phasing of these variations. Based on the fact that the star is enough bright ( = 2.90), the IUE data have allowed to investigate behavior of the monochromatic light curves in short-wavelength and long-wavelength sides from the core of line. Several monochromatic light curves in the wings of line at different wavelengths were formed. Figure 5 exhibits the variations of the flux in short-wavelength and long-wavelength sides of line versus the rotational phase. As can be seen on the graphs of Fig. 5 the monochromatic light curves have identical shapes in short-wavelength and long-wavelength sides of line. The light curves at 1187 and 1246 Å show the minimum and maximum of the flux at phases 0.0 and 0.5, respectively. Note that the monochromatic light curves in the ’pseudo-continuum’ show the same behavior in the far-UV spectral region. These monochromatic light curves are most removed from the line center of at 1215 Å. On the other hand, the monochromatic light curves at 1202 and 1234 Å show the minimum and maximum of the flux at phases 0.5 and 0.0, respectively. Also, the light curve in the filter shows the same behavior in the visual spectral region (Pyper 1969). While, the variation of the flux at 1190 and 1239 Å is practically zero over the period of rotation. In other words, the so-called ’null wavelength regions’ is also disposed in these wavelengths. It should be noted that the fluxes at the cores of line varies with the small amplitudes at 1213 Å for two CP stars CU Vir and 56 Ari (Sokolov 2000, 2006).

5 Discussion
Our result indicate that the variations of average intensity of the flux at the cores of large features and spectral lines show different behavior. First of all, the shapes of two light curves at 1375 and 1415 Å at the core of large feature at 1400 Å curves significantly differ. The minimum of the light curve at 1375 Å is reached at phase 0.05 while the minimum of the light curve at 1415 Å is at phase 0.26. Although, the difference in wavelength between these spectral regions is equal 40 Å. This puzzling situation was one of the incentives for studying the high-dispersion spectra of CVn in these spectral regions. In the top panel of Fig. 6 two high-dispersion spectra are plotted in the spectral region near 1375 Å. These spectra SWP27894 and SWP15828 were obtained at the phases 0.064 (dashed line) and 0.524 (full line), respectively. From Fig. 6 we see that the fluxes of the spectrum SWP27894 systematically lower than the fluxes of the spectrum SWP15828. In the bottom panel of Fig. 6 two high-dispersion spectra are plotted in the spectral region near 1415 Å. These spectra SWP04813 and SWP27880 were obtained at the phases 0.204 (dashed line) and 0.702 (full line), respectively. Again, we can see that the fluxes of the spectrum SWP04813 lower than the fluxes of the spectrum SWP27880. The comparisons of the high-dispersion spectra in the spectral regions of the broad feature at 1400 Å are in agreement with phase diagrams obtained from the low-dispersion spectra (see Fig. 3). Although, the nature of such behavior of the fluxes in the spectral regions at 1375 and 1415 Å still unclear. Possibly, the influence of different species of spectral lines can play a some role.
The light curves at the cores of Si II resonance lines at 1260–64 and 1526–33 Å show the similar shapes as in the ’pseudo-continuum’. While, the light curves at the cores of Si II resonance lines at 1304–09 and 1485 Å show the phase displacement of minimum of the flux. On the other hand, the flux at the cores of large feature at 1770 Å and Fe II resonance line at 1725–31 Å, within errors measurements, does not vary. Moreover, the light curves at the cores of of Fe II lines show the phase displacement of minimum of the flux from 0.07 at 2250 Å to 0.31 at 2747 Å.
The vertically dependent abundance stratification in CP stars are suggested by many authors (e.g., Ryabchikova 2008, and references therein). This effect may influence our results, because the effective depth at which the fluxes is formed at 2000 Å can differs from the effective depth at which the fluxes is formed at 2505 Å. We can expect that the flux comes from upper layers of atmosphere at the cores of some large features and depressions than the flux coming from the nearest ’pseudo-continuum’ in the spectral region with 2000 Å. Therefore, possibly, some large features and depressions show the displacement of position of minimum of the flux, though the flux in the nearest ’pseudo-continuum’ does not show such displacement. Although, the spectrum in the ’pseudo-continuum’ is also blocked by a great number of spectral lines of various chemical elements.
The main thing is that the energy blocking by silicon bound-free transitions and iron bound-bound transitions decreases the flux in the UV spectral region. The blocked flux appears in the visual and the red parts of the spectrum. Such an explanation is supported by the anti-phase relationship of light curves in the visual and the UV spectral regions. Probably, our investigation indicates that not only this mechanism may influence on the redistribution of the flux in atmosphere of CVn. The fluxes, situated in the wings of line at different distances from its center, and hence formed at different depths in stellar atmosphere. The investigation of variability of the flux in the wings of line indicate that the fluxes, which formed in inner layers of atmosphere, are redistributed into outer layers of atmosphere of CVn. Therefore, it should be some layer in atmosphere of the star where the fluxes do not vary over the period of rotation. Although, the independent investigation of line variations for others CP stars is needed in order to confirm our result.
6 Conclusions
The archival IUE spectrophotometric data of CVn have permitted to analyze the light variations at the cores of large features and spectral lines. The variations of intensity of the flux at the cores of large features and spectral lines show different behavior. The influence of different species of spectral lines play a some role in the different regions at 1375 and 1415 Å of the large feature 1400 Å. The light curve at 1375 Å show similar shape as in the ’pseudo-continuum’. The same behavior of the flux is at the cores of Si II resonance lines at 1260–64 and 1485 Å. While, the light curve at 1415 Å show the phase displacement of minimum of the flux. The phase displacement also is presented at the cores of Si II resonance lines at 1304–09 and 1485 Å. The same phase displacement is at the cores of the Fe II depressions in the spectral region with 2505 Å. But, the variability of the flux at the cores of the Fe II depressions in this spectral region is the same as in the ’pseudo-continuum’.
The minimal values of the amplitude of the flux variations are reached at the cores of the large features at 1560 and 1770 Å and at the cores of the strong Si II resonance lines at 1260–64, 1304–09 and 1485 Å. The flux at the cores of large feature at 1770 Å and Fe II resonance line at 1725–31 Å, within errors measurements, does not vary.
The investigation of variability of the flux in the wings of line indicate that the fluxes, which formed in inner layers of atmosphere, are redistributed into outer layers of atmosphere of CVn. Although, the independent investigation of line variations in the high-resolution mode is needed in order to confirm our result.
References
- 1 S.J. Adelman, C.R. Cowley, D.S. Leckrone, S.W. Roby, G.M. Wahlgren, 1993, Astrophys. J., 419, 276,
- 2 M.-C. Artru, T. Lanz, 1987, Astron. Astrophys., 182, 273,
- 3 G. Farnsworth, 1932, Astrophys. J., 75, 364,
- 4 K. Fuhrmann, 1989, Astron. Astrophys. Suppl. Ser., 80, 399,
- 5 A.V. Goncharskii, T.A. Ryabchikova, V.V. Stepanov, V.L. Khokholova, A.G. Yagola, 1983, Soviet Astr., 14, 652,
- 6 J.F. Gonzalez, M.-C. Artru, 1994, Astron. Astrophys., 289, 209,
- 7 H. Hensberge, J. Van Santvoort, K.A. Van der Hucht, T.H. Morgan, 1986, Astron. Astrophys., 158, 113,
- 8 V.L. Khokhlova, V.M. Pavlova, 1984, PAZh, 10, 337,
- 9 O. Kochukhov, N. Piskunov, I. Ilyin, I. Tuominen, 2002, Astron. Astrophys., 389, 420,
- 10 T. Lanz, M.-C. Artru, M. Le Dourneuf, T. Hubeny, 1996, Astron. Astrophys., 309, 218,
- 11 D.S. Leckrone, M.A.J. Snijders, 1979, Astrophys. J. Suppl. Ser., 39, 549,
- 12 D.S. Leckrone, 1984, Astrophys. J., 286, 725,
- 13 D.M. Pyper, 1969, Astrophys. J. Suppl. Ser., 18, 347,
- 14 T. Ryabchikova, N. Piskunov, I. Savanov, F. Kupka, V. Malanushenko, 1999, Astron. Astrophys., 343, 229,
- 15 T. Ryabchikova, 2008, Cont. Ast. Obs. Skalnaté Pleso, 38, 257,
- 16 S.N. Shore, D.N. Brown, G. Sonneborn, 1987, Astron. J., 94, 737,
- 17 N.A. Sokolov, 2000, Astron. Astrophys., 353, 707,
- 18 N.A. Sokolov, 2006, Mon. Not. R. Astron. Soc., 373, 666,
- 19 N.A. Sokolov, 2010, Astrophys. Space Sci., 330, 37,
- 20 N.A. Sokolov, 2011, this issue, p. 390
- 21 K. Stepień, W. Czechowski, 1993, Astron. Astrophys., 268, 187,