Direct measurement of cell wall stress–stiffening and turgor pressure in live bacterial cells
Abstract
We study intact and bulging Escherichia coli cells using atomic force microscopy to separate the contributions of the cell wall and turgor pressure to the overall cell stiffness. We find strong evidence of power–law stress–stiffening in the E. coli cell wall, with an exponent of , such that the wall is significantly stiffer in intact cells ( MPa and MPa in the axial and circumferential directions) than in unpressurized sacculi. These measurements also indicate that the turgor pressure in living cells E. coli is kPa.
Many cellular-scale processes in biology, such as cell growth, division and motility, necessarily involve mechanical interactions. Recent theoretical work in bacteria has led to a number of physically–realistic models of bacterial cells Furchtgott et al. (2011); Sun et al. (2010); Jiang and Sun (2010). However, in many instances, precise, direct measurements of the mechanical properties of cellular components in live cells are lacking.
The cell envelope in most bacteria is made of one or two layers of membrane and a rigid cell wall consisting of a network of peptidoglycan (PG) polymers. These two materials serve different cellular functions. The semi-permeable plasma membrane maintains a chemical separation between the cell interior and the surrounding medium. The large concentration of solutes in the cytoplasm generates an osmotic pressure, termed turgor pressure, that pushes the plasma membrane against the cell wall. The cell wall, on the other hand, defines the cell shape and constrains the volume under turgor.
The magnitude of the turgor pressure under physiological conditions has been estimated using several techniques: by collapsing gas vesicles in rare species of bacteria Holland and Walsby (2009), by AFM indentation Arn (2000); Yao et al. (2002), and by calculating the total chemical content of the cytoplasm Cayley et al. (2000). The estimated pressure values vary by more than an order of magnitude, from to Pa. While mechanical experiments, such as AFM indentation, are the most direct probes, separating the mechanical contributions of the wall and pressure has not been previously possible and thus these experiments may only provide an upper bound on the true turgor pressure.
Similarly, the elasticity of the cell wall has been difficult to probe in individual, live cells. Most previous mechanical measurements on the cell wall have been performed using chemically isolated walls, termed sacculi, that may be altered from the native state, or on large bundles of cells Mendelson et al. (2000). Yao et al. reported an anisotropic elasticity of MPa and MPa in the axial and circumferential directions relative to a cell’s rod-shape using single flattened E. coli sacculi adhered to a substrate Yao et al. (1999). Thwaites and coauthors probed the elastic modulus of macroscopic threads of many Bacillus subtilis sacculi in humid air and found that the modulus varied from to MPa depending on the humidity and salt concentration Thwaites and Mendelson (1985, 1989); Mendelson and Thwaites (1989). Attempts to probe whole–cell elasticity have also been made using AFM indentation of Myxococcus xanthus cells Pelling et al. (2005) and optical–tweezer bending of Borrelia burgdorferi sacculi Dombrowski et al. (2009).
In addition, because the PG material is essentially a cross-linked polymer mesh, it is expected to exhibit a substantial amount of stress–stiffening Gardel et al. (2004); Koenderink et al. (2006); Tharmann et al. (2007); Broedersz et al. (2008); Kim et al. (2009). Unpressurized sacculi thus provide a poor platform for estimating the wall elasticity in live cells. Boulbitch et. al. modeled the cell wall as a deformable hexagonal mesh and predicted a load-dependent elasticity with a power–law stress–stiffening exponent of about one Boulbitch et al. (2000). Thwaites and coauthors found about an order of magnitude change in the thread modulus upon loading, although it is unclear how to interpret measurements from these very large, multi–sacculus objects performed in air Thwaites and Mendelson (1985, 1989); Mendelson and Thwaites (1989).
Mechanical indentation of live cells is likely the most direct method for probing these sorts of mechanical properties. Under external perturbation, however, the cell wall and turgor pressure have mixed contributions to the response, making it hard to independently estimate these two quantities. By studying a bulging strain of E. coli, we are able to simultaneously determine both the wall elasticity and the turgor pressure and reveal their dependence [Fig. 1].
Briefly, we first obtain the turgor pressure of individual bulging cells from the bulge radius and indentation stiffness using AFM and fluorescence microscopy [Fig. 1(a-e)]. Then, from the size and stiffness of the cell body, we are able to extract the elasticity of the cell wall under tension using numerical methods. The variation in turgor pressure among bulging cells allows us to probe the mechanical properties of the PG over a broad range of stresses. Additional experiments using non–bulging cells yields the turgor pressure and wall modulus of E. coli under physiological conditions. More details regarding the experimental procedures are described in the supplemental materials 111See supplemental material at http://link.aps.org/supplemental/… for details regarding experimental methods and theoretical derivations..
Several lines of evidence indicate that the cell wall in bulged cells is not significantly different than in non–bulged cells. First, bulging is a discrete event that is completed within a few seconds. Second, the cell stiffness remains constant in the presence of vancomycin until the sudden bulging event when the stiffness drops dramatically [Fig. 1(f)]. Taken together, these indicate that the mechanical properties of the cell wall as a whole are unaffected by drug treatment except at the precise location of fracture and bulging.
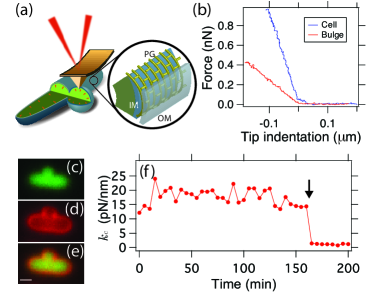
GFP molecules are able to move between the bulge and the cell interiors [Fig. 1(c)], indicating that cytoplasmic objects smaller than at least 3–4 nm are free to exchange between these compartments. Because the turgor pressure overwhelmingly results from the concentration of small solutes, the pressure in the cell and bulge can be considered the same. We calculate this pressure from the stiffness of the bulge by modeling the bulge as a liquid vesicle and the shape of the AFM tip as a cone 11footnotemark: 1.
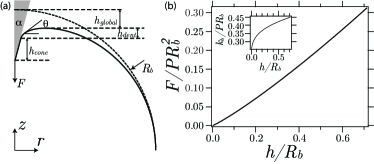
Briefly, the total indentation size for an indentation force , a bulge of radius , an indenter half–conical angle of and pressure is given by 11footnotemark: 1
| (1) |
where the bulge surface tension , , and . The indentation, , has a nearly linear dependence on the indentation force [Fig. 2(b)]. Under experimental conditions where , m, kPa and nN, the dimensionless spring constant varies from 0.35 to 0.38 [Fig. 2 (b) inset].
For each bulging cell, we measure and use the model to obtain the reduced stiffness as shown in the inset of Fig. 2(b). From the mechanical measurements of the bulge stiffness and radius, we then calculate the turgor pressure in that particular cell. We then use this value to estimate the circumferential surface tension experienced by the cell wall, , where is the cell radius 222Circumferential quantities are denoted as while axial quantities are denoted as ..
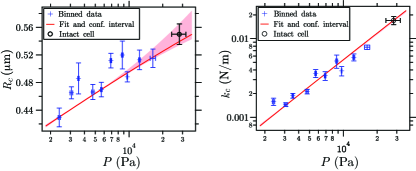
Figure 3 shows the cell radius, , and stiffness, , as functions of the pressure derived from bulge indentation. Both radius and stiffness are positively correlated with the turgor pressure. We further determined the size and stiffness of non–bulging cells to be m and N/m, respectively 333The size and stiffness of a similar strain of E. coli that does not carry the imp4213 mutation was within 10% of the values for the imp- strain, indicating that increased outer membrane permeability does not have a large effect on the turgor pressure or cell wall elasticity..
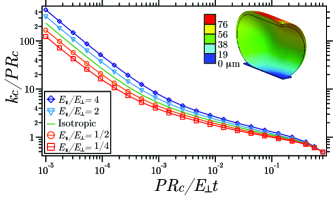
The indentation stiffness of the cell wall is governed by terms associated with stretching and bending of the PG as well as terms related to the surface tension. While the bending energy of the wall has been shown to be negligibly small Arn (2000), we cannot ignore the stretching energy of the PG network and thus analysis of the cell indentation data is more complicated than for bulge indentation. To address this problem, we used finite–element calculations of the force–indentation relation for an inflated cylindrical shell [Fig. 4 inset].
Rather than attempting to estimate the elastic parameters for each measured cell, we generated a numerical model for the radius, , and stiffness, , in the presence of stress–stiffening and performed a global fit to all the cellular indentation data. This procedure and the fitting results are sketched below, while in depth derivations and modeling details are provided in the supplemental materials 11footnotemark: 1.
We incorporate stress–stiffening in the cell wall by describing the nonlinear elasticity of the PG network as a power law in the turgor pressure, . is the Young’s Modulus at reference pressure (fixed at 5 kPa, in the middle of the range of measured bulge pressures), and is the stress–stiffening exponent. Here, the nonlinearity is only dependent on the pressure in a given cell and we ignore the much smaller change in stress caused by AFM indentation. The independent parameters and , where is the thickness of the cell wall, fully define the nonlinear elasticity. These two quantities, combined with the radius of a cell at the reference pressure, , make up the fitting parameters for interpreting bulged cells. Our global fit additionally includes the radius and stiffness data from the non–bulged, intact cells which introduces one additional free parameter: the physiological turgor pressure.
The radial expansion, , can be solved implicitly from the following equation as derived in the supplemental materials 11footnotemark: 1
| (2) |
The dimensionless quantity describes the magnitude of inflation under pressure.
Calculation of the cell stiffness under pressure, , is significantly more complicated. The dimensionless stiffness, , depends only on as can be found from scaling arguments 11footnotemark: 1, and monotonically decreases as the cylinder is inflated due to the relative magnitudes of surface tension and shell bending [Fig. 4 green line]. However, stress stiffening adds an extra complication due to an anisotropy inherent in a cylindrical geometry; the surface tension in the circumferential and axial directions of a cylinder are different by a factor of 2. Therefore, the Young’s modulus, which is a function of surface tension, is orthotropic. We simulated indentation of pressurized cylinders with several different values for the elastic anisotropy, [Fig. 4]. For a given pressure, the anisotropy can be calculated 11footnotemark: 1 and the correct relationship between the dimensionless stiffness and the radial inflation can be interpolated using the curves shown in Fig. 4. Combined with the radial expansion function, this is sufficient to solve for .
The results of a global fit of the functions and to the experimental data are shown in Fig. 3. The best fit yields parameter estimates of N/m, , nm and a turgor pressure kPa. At this turgor pressure, using the estimated cell wall thickness nm Yao et al. (2002), the cell wall Young’s moduli are MPa and MPa.
Previous work using AFM indentation of bacteria has been used to quantify turgor pressure and cell wall elasticity Arn (2000); Yao et al. (2002). In that work, the relationship between linear indentation and surface tension was established, but the stretching of the cell wall was neglected or at most underestimated. Our study, which independently measures the turgor pressure and cell stiffness, suggests that cell wall stretching and surface tension contribute similar amounts to the indentation stiffness. This is most evident in the difference in the ratio for membrane bulges, , and cells, . This difference arises from the fluidity of lipid membranes; while the bulge can redistribute material to minimize stress, the rigid cell wall can not. For the cell wall, therefore, the overall stiffness depends on stretching even in a tension-dominated regime.
Mendelson and others introduced a pressure–independent, tube–bending method to quantify cell wall elasticity Mendelson et al. (2000). Wang et al. bent live E. coli cells and found their flexural rigidity to be Nm2 Wang et al. (2010). This result yields an axial cell wall Young’s modulus, including uncertainties in the wall thickness, of MPa, in agreement with our measurements. Using our numerical model, we combined this value of the axial modulus with the stiffness of intact cells measured using AFM indentation and estimate the turgor pressure in intact cells to be kPa. This bulge–free measurement further validates our estimate of the turgor pressure and cell wall stress–stiffening.
Polymer networks often exhibit a nonlinear stress-strain relation due to intrinsic geometric nonlinearities and a potential nonlinear force-extension relation of the individual polymers at finite temperature Gardel et al. (2004). Boulbitch et. al. modeled the PG network as a hexagonal mesh of rigid glycan subunits and elastic peptide cross-links. They predicted a power–law relationship between the axial elastic modulus and stress with a stiffening exponent of Boulbitch et al. (2000). We find a stiffening exponent of in the E. coli cell wall in quantitative agreement with the model and similar to observations from gram–positive Bacillus sacculus threads Thwaites and Mendelson (1989).
To summarize, we used AFM and fluorescent microscopy to probe the elastic properties of live E. coli cells using a system that allows us to separately probe pressure and elasticity. Our results indicate that the turgor pressure in live cells is kPa, or atm. This value is lower than previous chemical estimates of the pressure but similar to other mechanical measurements. Our data further indicate that the cell wall stress-stiffens. Stress–stiffening affords a unique mechanical advantage to cells by preventing abrupt cell shape changes during changes in external pressure or osmolarity while maintaining a relatively compliant cell elasticity under normal conditions.
Acknowledgements.
This research was supported by the Pew Charitable Trusts and NSF Award PHY-0844466. We gratefully thank Natacha Ruiz and Tom Silhavy for help in constructing cell strains and Ned Wingreen for helpful advise.References
- Furchtgott et al. (2011) L. Furchtgott, N. S. Wingreen, and K. C. Huang, Mol Microbiol (2011), 10.1111/j.1365-2958.2011.07616.x.
- Sun et al. (2010) S. X. Sun, S. Walcott, and C. W. Wolgemuth, Current Biology 20, R649 (2010).
- Jiang and Sun (2010) H. Jiang and S. X. Sun, Phys. Rev. Lett. 105, 028101 (2010).
- Holland and Walsby (2009) D. P. Holland and A. E. Walsby, Journal of Microbiological Methods 77, 214 (2009).
- Arn (2000) Phys Rev E Stat Phys Plasmas Fluids Relat Interdiscip Topics 62, 1034 (2000).
- Yao et al. (2002) X. Yao, J. Walter, S. Burke, S. Stewart, M. H. Jericho, D. Pink, R. Hunter, and T. J. Beveridge, Colloids and Surfaces B: Biointerfaces 23, 213 (2002).
- Cayley et al. (2000) D. S. Cayley, H. J. Guttman, and M. T. Record, Biophys J 78, 1748 (2000).
- Mendelson et al. (2000) N. H. Mendelson, J. E. Sarlls, C. W. Wolgemuth, and R. E. Goldstein, Phys Rev Lett 84, 1627 (2000).
- Yao et al. (1999) X. Yao, M. Jericho, D. Pink, and T. Beveridge, J Bacteriol 181, 6865 (1999).
- Thwaites and Mendelson (1985) J. J. Thwaites and N. H. Mendelson, Proc Natl Acad Sci U S A 82, 2163 (1985).
- Thwaites and Mendelson (1989) J. J. Thwaites and N. H. Mendelson, Int J Biol Macromol 11, 201 (1989).
- Mendelson and Thwaites (1989) N. H. Mendelson and J. J. Thwaites, J Bacteriol 171, 1055 (1989).
- Pelling et al. (2005) A. E. Pelling, Y. Li, W. Shi, and J. K. Gimzewski, Proc Natl Acad Sci U S A 102, 6484 (2005).
- Dombrowski et al. (2009) C. Dombrowski, W. Kan, M. A. Motaleb, N. W. Charon, R. E. Goldstein, and C. W. Wolgemuth, Biophys J 96, 4409 (2009).
- Gardel et al. (2004) M. L. Gardel, J. H. Shin, F. C. MacKintosh, L. Mahadevan, P. Matsudaira, and D. A. Weitz, Science 304, 1301 (2004).
- Koenderink et al. (2006) G. H. Koenderink, M. Atakhorrami, F. C. MacKintosh, and C. F. Schmidt, Phys Rev Lett 96, 138307 (2006).
- Tharmann et al. (2007) R. Tharmann, M. M. A. E. Claessens, and A. R. Bausch, Phys Rev Lett 98, 088103 (2007).
- Broedersz et al. (2008) C. P. Broedersz, C. Storm, and F. C. MacKintosh, Phys Rev Lett 101, 118103 (2008).
- Kim et al. (2009) T. Kim, W. Hwang, H. Lee, and R. D. Kamm, PLoS Comput Biol 5, e1000439 (2009).
- Boulbitch et al. (2000) A. Boulbitch, B. Quinn, and D. Pink, Phys. Rev. Lett. 85, 5246 (2000).
- Note (1) See supplemental material at http://link.aps.org/supplemental/… for details regarding experimental methods and theoretical derivations.
- Note (2) Circumferential quantities are denoted as while axial quantities are denoted as .
- Note (3) The size and stiffness of a similar strain of E. coli that does not carry the imp4213 mutation was within 10% of the values for the imp- strain, indicating that increased outer membrane permeability does not have a large effect on the turgor pressure or cell wall elasticity.
- Wang et al. (2010) S. Wang, H. Arellano-Santoyo, P. A. Combs, and J. W. Shaevitz, Proc Natl Acad Sci U S A 107, 9182 (2010).