Characterization of hexabundles: Initial results
Abstract
New multi-core imaging fibre bundles – hexabundles – being developed at the University of Sydney will provide simultaneous integral field spectroscopy for hundreds of celestial sources across a wide angular field. These are a natural progression from the use of single fibres in existing galaxy surveys. Hexabundles will allow us to address fundamental questions in astronomy without the biases introduced by a fixed entrance aperture. We have begun to consider instrument concepts that exploit hundreds of hexabundles over the widest possible field of view. To this end, we have compared the performance of a 61-core fully-fused hexabundle and 5 lightly-fused bundles with 7 cores each. All fibres in the bundles have m cores. In the fully-fused bundle, the cores are distorted from a circular shape in order to achieve a higher fill fraction. The lightly-fused bundles have circular cores and five different cladding thicknesses which affect the fill fraction. We compare the optical performance of all 6 bundles and find that the advantage of smaller interstitial holes (higher fill fraction) is outweighed by the increase in modal coupling, cross-talk and the poor optical performance caused by the deformation of the fibre cores. Uniformly high throughput and low cross-talk are essential for imaging faint astronomical targets with sufficient resolution to disentangle the dynamical structure. Devices already under development will have between 100 and 200 lightly-fused cores, although larger formats are feasible. The light-weight packaging of hexabundles is sufficiently flexible to allow existing robotic positioners to make use of them.
keywords:
instrumentation: miscellaneous:hexabundles – techniques: miscellaneous – methods: observational – instrumentation: spectrographs – techniques: imaging spectroscopy.1 Introduction
Current and planned cosmological surveys in the optical and infrared have fundamental limitations. Multi-fibre [e.g. 2dF (Colless et al., 2001) and SDSS (York et al., 2000)] and multi-slit [e.g. DEIMOS (Faber et al., 2003) and VIMOS (Le Fevre et al., 2003)] surveys have or will amass large catalogues of galaxies in order to deduce their global properties. However these suffer from biases introduced when a fixed angular size aperture such as a single fibre is used to observe galaxies, irrespective of the size, distance or morphology (see for example, fig.8 in Ellis et al., 2005). On the other hand, integral field units (IFUs) like TEIFU (Murray et al., 2000) and GMOS (Allington-Smith et al., 1997) or image slicers such as SINFONI (Eisenhauer et al., 2003) and NIFS (McGregor et al., 2003) spatially sample the spectra, giving morphological and dynamical information. However, current IFUs are restricted in the number of objects that can be observed. The ideal is to combine multi-object spectroscopy (MOS) positioning technology with IFUs. Hexabundles can do exactly that.
Hexabundles have up to many hundreds of closely-packed fibres to allow spatially resolved spectroscopy. They have several practical advantages. Firstly, they are not as sensitive as single-fibre devices to seeing and positioning errors and are unaffected by seeing losses. Secondly, they can be used with AO-corrected or natural seeing and in the optical or infrared. Thirdly, there is no need for microlens arrays, and the plate scale can be changed simply with a single macro lens. Fourthly, they can be used with conventional fibre positioning technology as imaging bundles to obtain spatial information in a survey of many thousands of galaxies. The resulting scientific gains over existing large galaxy surveys would then include the ability to investigate AGN triggering and feedback including outflows, galaxy merger rates and merger-induced processes, the substructure in gravitational lenses, stellar populations and abundance gradients, as well as tracing the build up of dark matter, stellar mass and angular momentum in galaxies. Decomposition of bulge and disk components would be possible for thousands of galaxies. Hexabundles are particularly effective for galaxies with asymmetries, multiple components, mergers and substructures including high redshift galaxies that are not yet formed into spheroids or disks but consist of clumpy merging components which would be poorly sampled with a single fibre spectrum. Differential binning of the fibres can also be applied, particularly for more distant objects where the brightness decreases rapidly away from the nucleus.
A 100,000 galaxy survey out to a redshift of 0.2 will be possible with hexabundles in the proposed FIREBALL instrument on ESOs Very Large Telescope (VLT). Currently the FLAMES instrument uses the OzPoz positioner to place 132 single fibres across a field, which then feed into the GIRAFFE spectrograph. The proposed FIREBALL upgrade would involve fifty hexabundles, with around 100-cores each sampling .
Hexabundles are not limited in the number of cores in each bundle, beyond the physical size of the bundle holder. So far we have made bundles up to 61 cores, but larger devices of several hundred cores would be suitable for multi-object positioners. In anticipated applications, the core will have per core. Then 61-core and 367-core bundles would have imaging areas and across respectively.
The main trade-off with the design of hexabundles is to have the largest fill-fraction (ratio of core area to total bundle area) possible without compromising the optical performance. The fill-fraction is affected by both the cladding thickness and how the fibres are packed together. Fibres that are fully-fused together have smaller gaps between cores giving a fill-fraction of over 90%, but are significantly distorted from a circular shape. On the other hand, lightly-fused fibres remain circular but have larger gaps between them, resulting in fill-fractions less than 87%.
This paper describes the performance tests of our first fully-fused and lightly-fused hexabundles with an aim to assess the trade-offs of fill-fraction versus optical performance. Section 2 describes the hexabundle devices, while the experimental method and data reduction are in section 3. Sections 4 and 5 have the results for the fully-fused 61-core hexabundles and the lightly-fused 7-core hexabundles respectively. Final conclusions on the comparison of the different types of hexabundles is in section 7.
2 Hexabundle devices
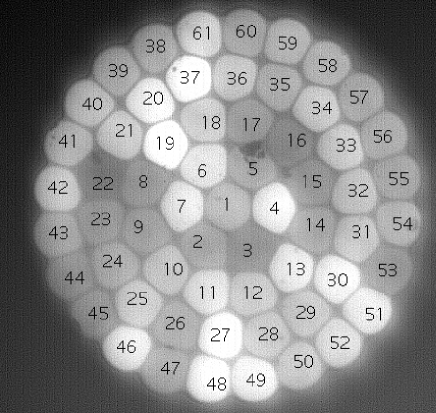
Six new hexabundle devices have been characterized. In each device, one end has multimode fibres with reduced cladding thickness, fused into a single element, which is the hexabundle. The fibres at the other end are loose and have normal cladding thickness. The first of these hexabundles consists of 61 fully-fused fibres without interstitial holes (Fig. 1) giving a fill-fraction of %. However, all but the central fibre are significantly distorted from a circular shape. The fibres are 4.5 m long and each fibre had core and cladding diameters of m and m respectively, before the cladding was etched away over a cm length where the fibres were then fused (further details of the manufacturing process can be found in Bland-Hawthorn et al., 2011). The resulting hexabundle has a diameter of m. On output, the 61 fibres are lined up in V-grooves between glass plates with three rows of 15 and one row of 16 fibres. The fibres in adjacent grooves in the same glass plate are separated by m.

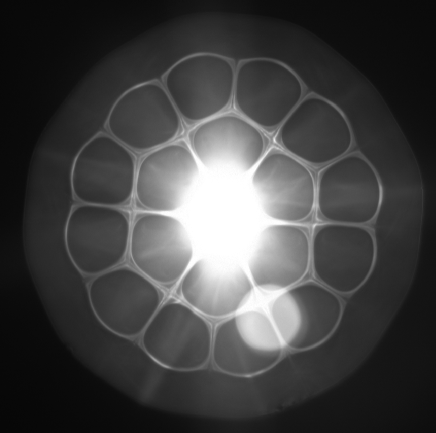
The remaining five hexabundles have seven lightly-fused fibres (with small interstitial holes) with cladding thicknesses of 1, 2, 4, 6 and m. The main difference to the previous bundle is that the fibres are circular rather than distorted in shape (see Fig. 2), resulting in lower fill-fractions. In these bundles, the output fibres are loose and were mounted into 35 parallel V-grooves on a plate with careful attention not to apply pressure to the fibres. We aim to investigate the effect of circular cores on the optical performance and consider the trade-off with fill-fraction. The different cladding thicknesses are used to assess the ideal balance between minimising cross-talk while maximising fill-fraction.
3 Experiment method and data reduction
Each of the bundles were tested for cross-talk, relative throughput and mode-dependent losses. It was crucial for the cross-talk tests in particular, to ensure that no stray light was getting into any core other than the intended target. Originally laser light was focussed into the individual fibre (output) end of the fibres while the hexabundle end was imaged with the camera. This has the advantage that the fibres could be separated so that no stray light from the laser could go into adjacent fibres. However, the light coming out of the multimode fibres at the hexabundle has a speckle pattern that is larger than the size of the core. This is because the different modes focus in slightly different planes outside of the polished bundle face so that all of the light out of the fibre cannot be focussed at the same time, resulting in an imaged spot size that has an apparent diameter of approximately 125% of the core diameter. An example of this effect is shown in Fig. 3. In any adjacent fibre it is impossible to distinguish light from this oversize speckle pattern from light leaked into the fibre through cross-talk.
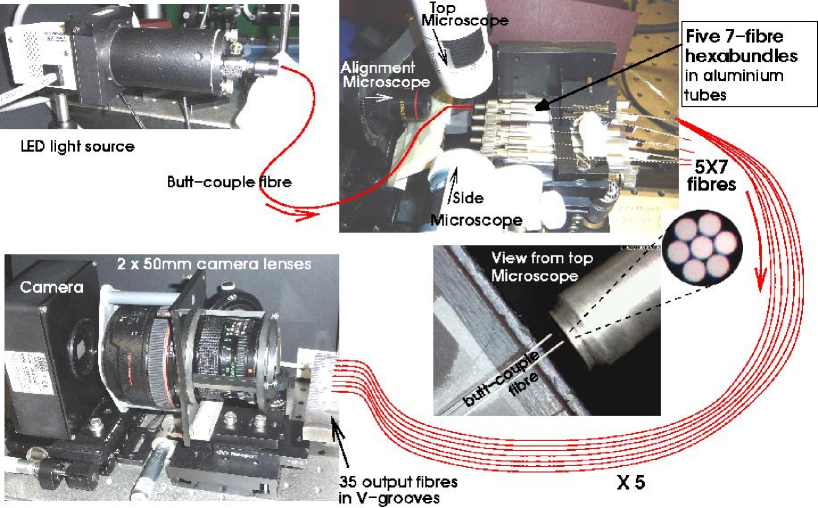
The final method adopted, as shown in Fig. 4, used an Oriel LED light source which was focussed into a m core fibre with a m diameter including cladding. This fibre was then butt-coupled to the m hexabundle cores (reversing the direction of the light through the fibres compared to the previous method - this is the direction the hexabundles will be used in astronomical applications). We mounted the butt-couple (input) fibre in a V-groove on a narrow plate that was attached to a tilt/rotation stage off to the side of the hexabundle mount. This minimised obstruction of the area around the hexabundle face so that the fibre could be adjusted to align perpendicular to the hexabundle face. The narrow plate could then slot in from the side between the hexabundle and a microscope with the fibre bending abruptly away to the side. This allowed the microscope to be positioned close enough to image the hexabundle and input fibre at high enough magnification to be sure the input fibre was centred on a chosen fibre core within the hexabundle. The input fibre needed to be less than m from the hexabundle face to prevent light straying into adjacent fibres. The small outer diameter of the butt-coupled fibre was essential in order to not obscure the view of the hexabundle cores. Two other microscopes mounted above and side-on were used to ensure that the fibre was perpendicular to the hexabundle face in both axes. The maximum error contribution to the NA from the input alignment was . The output fibres were each imaged through a pair of large camera lenses onto an SBIG camera. A micrometer stage allowed the distance from the focus to the backfocus position of the camera to be accurately measured.
For all the measurements, the LED source light level was kept constant. Each measurement was done twice, once with a Bessel blue filter (centred on m) then with a Bessel red filter (centred on m) between the LED source and the focussing assembly. Time variation in the input light intensity plus variations in the SBIG camera response, were quantified with repeated images through one core of the bundle at time periods ranging from second to hours. The maximum variation in resulting integrated counts was % with typical values of %.
The relative throughput of every fibre in each bundle was measured by centring the input light on each fibre. For cross-talk measurements, the light was centred on a core while the surrounding fibres were imaged. FITS images from the SBIG camera were processed using the iraf astronomical data reduction software (Tody, 1986). Firstly each image was flat fielded. The background was fitted and subtracted in iraf radprof using an annulus with inner radius approximately 3 times the maximum radius of the fibre image. Then the total integrated counts were measured in iraf radprof by fitting the barycentre of the fibre image and selecting a fixed aperture size for all fibres that was large enough to include all the output from the fibre. The target fibre and the surrounding fibres were measured through the same size aperture.
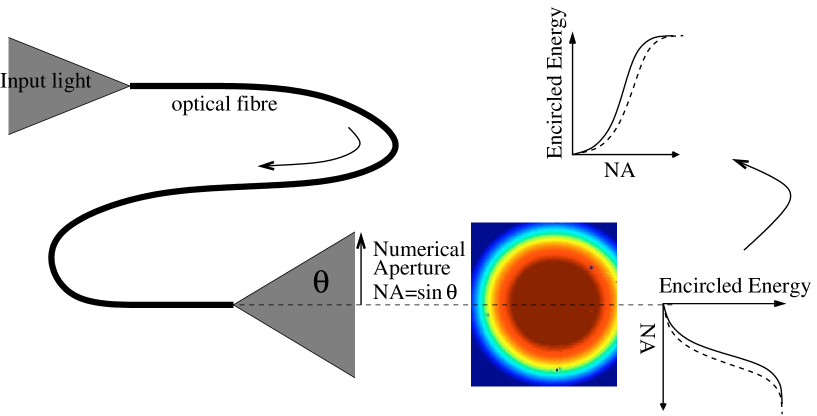
We also aimed to compare the performance of different fibres within the same bundle in terms of focal ratio degradation (FRD) or mode-dependent losses. FRD (e.g. Carrasco and Parry 1994) is a loss of optical entropy or non-conservation of éntendue due to mode mixing as light propagates down the fibre. This modal mixing causes the opening angle of the output beam to be larger than that of the input beam resulting in a wider encircled energy distribution (see Fig. 5). The modal coupling means that lower-order modes will “couple” to higher-order modes which have a larger angle at the output beam, hence a larger NA. In order to compare the consistency of the performance of different fibres within the same bundle, it was therefore important to ensure that all modes were filled on input. When the cores are distorted, under-filling the NA on input may mean the light couples into different modes at the input for different fibres, making it invalid to compare the distribution on output. Therefore we have filled the NA of the fibres to excite all possible modes, so that the output energy distribution across the output image in the back-focal plane can be directly compared for each fibre. The encircled energy profile at back-focus, will therefore be broader for higher modal coupling.
The camera was shifted to a known back-focal distance; selected to give sufficient pixels across the output fibre image to accurately fit an encircled energy profile. Using the known pixel size of the camera, an NA value was calculated from sin of the cone angle. This gives the effective output NA at each point across the image of the fibre. This NA value is used in the graphs to follow. After flat fielding, iraf radprof was used to fit the centre position along with the background and peak counts in each image profile. These initial values were then input into iraf pprofile, and the radially-collapsed encircled energy profile was fitted interactively. An iterative procedure was used to determine the background value to subtract and the peak counts in the profile until the background was flat and the encircled energy levelled at 100%. The encircled energy values could then be matched to the NA calculated for each radial pixel position in the image. The resulting plots of NA vs encircled energy will therefore be shifted to the right when there are worse mode-dependent losses (larger mode-dependent losses will give higher FRD).
4 61-core hexabundle performance
4.1 Encircled energy profiles
The encircled energy profile of each of the fibres in the 61-core hexabundle, was measured against the output NA. Fig.6 shows the encircled energy profiles through both the Bessell blue (m) and red (m) filters. The profiles through the red filter are at a lower NA than those through the blue filter because the shorter wavelengths have more modes and therefore a higher NA. While the average profiles of 16 cores get worse as the range of core numbers gets further from the bundle centre, there is a very large variation in encircled energy profiles from fibre-to-fibre, which will give inconsistent performance across the bundle for imaging and spectroscopy.
In order to quantitatively compare the encircled energy profiles, the drop in encircled energy compared to the central fibre was calculated for a nominal NA of 0.20. This NA is chosen because it is less than the total size of the output cone (output NA at 100% encircled energy). The maximum NA is truncated by mode-dependent losses out of the fibre, however the distribution of encircled energy within that cone will also be broadened by modal coupling, and more modal coupling is indicative of more FRD. Therefore, by selecting the encircled energy loss at an NA of 0.2, we are measuring the broadening of the profile due to modal coupling. The resultant drop in encircled energy ranges from less than 1% up to more than 25% for different fibres in the bundle. At 90% encircled energy, the up-conversion of NA is 0.10 for the worst fibre in both the blue and red filters.
To see if the deformation of each fibre affects the encircled energy profiles, the deformation was measured by fitting circles to the image shown in Fig. 1. The largest circle that does not include any cladding, and the smallest circle that includes all the core were fit to each core. The ratio of the diameters of these circles was used to define a ‘deformation ratio’. While this measure is subjective, in Fig. 7, the plot for deformation ratio against encircled energy drop shows a correlation with Spearman rank correlation coefficient of 0.34 (95% probability). Therefore, the fibres with the highest deformation ratio tend to have the largest encircled energy drop, indicating the highest modal coupling.

4.2 Cross-talk and throughput
Cross-talk was measured for 14 random fibres in the bundle by measuring the integrated counts in each adjacent fibre while the light was centred on the target fibre. The loss was not equally distributed into the adjacent fibres, with most target fibres showing the majority of the cross-talk into one or two of the adjacent fibres while in some cases the counts were more than 100 times lower in other adjacent fibres. This was due partly to significant differences in the contact area and cladding width between different fibres. Such differences arise from the distortion of the fibres in the fully-fused bundle. The total loss into adjacent fibres was predominantly in the range of % (0.005-0.06dB) with one fibre at 4.2% with the blue filter, and one at 4.4% (0.2dB loss) in the red filter. The total cross-talk could not be evaluated in the outer row of the hexabundle because we have shown that the loss is unevenly distributed to adjacent fibres and therefore could not be assessed where there were no adjacent fibres on the outer edge. As the outer row of fibres include some of the most distorted profiles, the total cross-talk is likely to be above 0.2dB for some of those fibres. For example, the cross-talk from fibre 56 into just 55 and 57 is already a total of 0.17dB alone and therefore would be much higher if the losses could be measured on all sides.
In Fig. 7 there is an anti-correlation (with Spearman-rank test correlation coefficient of -0.65, and 99.9% probability) between the drop in encircled energy and the throughput. Throughput losses are a combination of higher cross-talk in the more distorted fibres and modal stripping (indicative of worse FRD). The encircled energy drop is not measured at the edge of the output light cone but at NA. FRD causes lower-order modes to be coupled to higher orders, broadening the beam to give this encircled energy loss. At the same time, the higher-order modes can be lost entirely and therefore the throughput is affected by worse modal stripping. The performance of different fibres within the same bundle is very inconsistent, making it ineffective as an imaging device. With the exception of one fibre with very high cross-talk, that performed differently to the others in every test, the encircled energy drop was also correlated with cross-talk with a Spearman Rank correlation coefficient of 0.60 (with % probability). It can also be seen that the throughput varied by a factor of five between each of the 61 cores which would have an impact on the accuracy of photometry in extended astronomical sources. It is clear that the more distorted fibres have lower throughput, worse cross-talk and higher encircled energy drop.

4.3 Cladding scatter
It was also noticed that when the input light was directed at the cladding between fibre cores, that light was then dispersed through the entire bundle. In an astronomical application, the component of an extended source that hit the cladding would result in all positional information being lost and the spectrum of that component of the object being added to every fibre across the field. By centring the light on the cladding between fibres 11 and 12, then measuring the counts in 6 fibres that were not adjacent, the counts were % of the counts in fibre 12 when the light was directed into fibre 12. Fibre 12 was chosen because the throughput counts in that fibre are average compared to the counts in each of the other 61 fibres. Based on an estimate of the cladding area covered by the light in this test compared to the total cladding area, up to 25% of the light in any one fibre could be scattered from cladding elsewhere in the bundle. This fraction would lead to unacceptable confusion in the spectroscopic imaging of an extended astronomical source.
The original aim of fully-fusing the bundle was to increase the fill-fraction to % . However, based on this performance, the gain in coverage across an object being imaged, is outweighed by the confusion in the spatial origin of the light at the spectrograph due to cross-talk and cladding scatter. Also, inaccuracies in photometry will result from the extreme differences in throughput across an image.
The next step was to consider the improvement in this performance if the hexabundle was lightly-fused so that the fibres remain circular at the expense of a slightly smaller fill-fraction.
5 Performance of the 7-fibre non-fully-fused hexabundles
We had five hexabundles made with cores that are lightly-fused. These have the advantage that the fibres are not distorted and therefore is expected to perform more consistently. In order to compare cross-talk for a given fill-fraction, they were made with cladding thicknesses of 1, 2, 4, 6 and m (see Bland-Hawthorn et al., 2011, for a discussion on the issues surrounding the manufacture of bundles with these cladding thicknesses). The aim was to test how thin the cladding could be before the cross-talk became too large.
5.1 Encircled Energy profiles
Fig. 8 shows the encircled energy profiles for the lightly-fused bundles. The profiles of each of the 7 cores in the 2, 4 and m clad bundles agree within errors, indicating consistent modal coupling performance across the bundle. This is in contrast to the large variation between cores in the fully-fused bundle (see Fig. 6). Each of the profiles in Fig. 8 have lower NA than (sit to the left of) the best performing fibre (central fibre) of the fully-fused bundle, indicating lower modal coupling (and therefore lower FRD) in the lightly-fused bundles. The m cladding bundle has a distribution of encircled energy profiles for the 7 cores that is slightly larger than errors, which may be due to mode stripping induced by the higher cross-talk. In this case the central core has worse NA than the other cores as would be expected from mode stripping based on the symmetry of the bundle.

5.2 Cross-talk and throughput
For each of the lightly-fused hexabundles, the relative throughput was measured for each of the 7 fibres, and the cross-talk was measured by summing the losses into the surrounding 6 fibres when light was directed down the central core.
Table 1 shows the cross-talk performance through the and band filters compared to the fill-fraction. While the hexabundles with 4, 6 and m clad fibres had no cross-talk down to the limit we could measure in our images, they also have a lower fill-fraction. The cross-talk was worse for the m clad bundle than for the m clad bundle, as expected. In the anticipated uses of these hexabundles (e.g. FIREBALL) the fibres would be /core - comparable to the best seeing at an excellent telescope site of , or average seeing at a good telescope site of . If the core is the size of the FWHM of a gaussian seeing profile, then 50% of the encircled energy will be in the central core and % in the adjacent the surrounding cores. The m clad bundle has a total cross-talk of % (at m), which is % of the star light in the surrounding cores, but for the m clad bundle (with up to % cross-talk), approximately a tenth of the light in the surrounding cores will be cross-talk contamination. Therefore, at optical wavelengths, the m clad bundle is suitable for applications where the core size is comparable to the FWHM, and the m clad bundle may also be suitable if there are several cores within the FWHM of the seeing profile. In the infrared, longer wavelengths will cause the cross-talk to be worse and thicker cladding would be required.
When the light was directed at the cladding, there was no detectable transmission of that light into all the cores as was seen with the “cladding scatter” in the fully-fused bundle (see section 4.3).
| Clad | Fill | Cross-talk | |||
|---|---|---|---|---|---|
| fract. | (m) | (m) | |||
| (m) | % (dB in brackets) | ||||
| 1 | 0.87 | 1.4 (0.06) | 4.76 (0.21) | ||
| 2 | 0.84 | 0.25 (0.011) | 0.39 (0.017) | ||
| 4 | 0.78 | () | () | ||
| 6 | 0.72 | () | () | ||
| 8 | 0.67 | () | () | ||
For the two bundles for which the cross-talk was measurable above the noise limit, the variation in the cross-talk values for the 6 surrounding fibres was at worst a factor of 4. This is significantly lower than the factor of we found for the 61-core fully-fused hexabundle. We attribute this to the uniformly circular fibres in the lightly-fused bundles which have equal contact areas with adjacent cores.
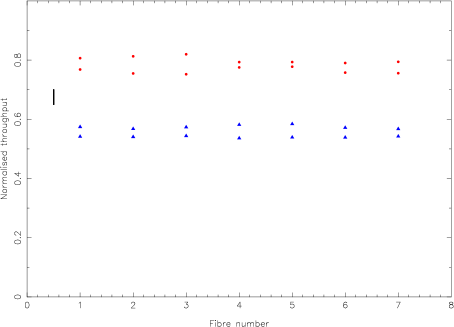
The even, circular-nature of the fibres in the lightly-fused bundles has also resulted in a much more uniform throughput from fibre-to-fibre. In Fig. 7 the variation in throughput between different fibres in the fully-fused bundle was up to %. However, the lightly-fused bundles showed at worst 24% variation between fibres in any bundle for a given filter. Typically the variation was a lot less than this, as shown in Fig. 9.
6 Conclusion
We have compared the performance of a 61-core fully-fused hexabundle to that of 5 lightly-fused bundles with varying cladding thickness. The distortion of the cores in the fully-fused bundle was found to significantly increase cross-talk, reduce throughput and increase mode-dependent losses. The throughput varied by a factor of 5 between different cores in the bundle, while the cross-talk reached over 4% in the worst core. The up-conversion in NA from the best (central) core to the worst was 0.1 at 90% encircled energy. The performance of the lightly-fused cores was better in every respect, and we attribute that to the uniformly circular cores. The throughput varied by at most 24% and the modal coupling results were consistent between the 7 cores in each bundle within errors. After comparing the cross-talk to the cladding thickness, we found that m cladding bundle had % cross-talk in the and bands while still having a fill-fraction of 84%. While the fill-fraction of the fully-fused bundle is %, the superior optical properties of the lightly-fused bundles outweighed the gain in fill-fraction.
Acknowledgements
We would like to thank Roger Haynes for valuable discussions and input. JJB and JBH are supported by ARC grant FF00776384 which supports the Astrophotonics programme at the University of Sydney.
References
- Allington-Smith et al. (1997) Allington-Smith J. R., Content R., Haynes R., Lewis I.J., 1997, Proc. SPIE 2871, 1284
- Bland-Hawthorn et al. (2011) Bland-Hawthorn J. et al., 2011, Optics Express, 19, 2649
- Colless et al. (2001) Colless M. M. et al., 2001, MNRAS, 328, 1039
- Eisenhauer et al. (2003) Eisenhauer F. et al., 2003, Proc. SPIE 4841, 1548
- Ellis et al. (2005) Ellis S. C., Driver S. P., Allen P. D., Liske J., Bland-Hawthorn J., De Propris R., 2005, MNRAS, 363, 1257
- Faber et al. (2003) Faber S. M. et al., 2003, Proc. SPIE 4841, 1657
- Le Fevre et al. (2003) Le Fevre O., et al., 2003, Proc. SPIE 4841, 1670
- McGregor et al. (2003) McGregor P. J., et al., 2003, Proc. SPIE 4841, 1581
- Murray et al. (2000) Murray G. J., et al., 2000, Proc. SPIE 4008, 611
- Tody (1986) Tody D., 1986, Proc. SPIE 627, 733
- York et al. (2000) York D. G., et al., 2000, AJ, 120, 1579