Active Galactic Nucleus Pairs from the Sloan Digital Sky Survey.
I. The Frequency on 5–100 kpc Scales
Abstract
Galaxy–galaxy mergers and close interactions have long been regarded as a viable mechanism for channeling gas toward the central supermassive black holes (SMBHs) of galaxies which are triggered as active galactic nuclei (AGNs). AGN pairs, in which the central SMBHs of a galaxy merger are both active, are expected to be common from such events. We conduct a systematic study of 1286 AGN pairs at with line-of-sight velocity offsets km s-1 and projected separations kpc, selected from the Seventh Data Release of the Sloan Digital Sky Survey (SDSS). This AGN pair sample was drawn from 138,070 AGNs optically identified based on diagnostic emission line ratios and/or line widths. The fraction of AGN pairs with kpc kpc among all spectroscopically selected AGNs at is 3.6% after correcting for SDSS spectroscopic incompleteness; 30% of these pairs show morphological tidal features in their SDSS images, and the fraction becomes % for pairs with the brightest nuclei. Our sample increases the number of known AGN pairs on these scales by more than an order of magnitude. We study their AGN and host-galaxy star formation properties in a companion paper.
Subject headings:
black hole physics – galaxies: active – galaxies: interactions – galaxies: nuclei – quasars: general1. Introduction
Binary supermassive black holes (SMBHs) are thought to be a generic outcome of galaxy–galaxy mergers in the hierarchical paradigm of structure formation (Begelman et al., 1980; Milosavljević & Merritt, 2001; Yu, 2002), given that most massive galaxies harbor central SMBHs (Kormendy & Richstone, 1995; Richstone et al., 1998). If both SMBHs accrete material during the same stage of a galaxy–galaxy merger, they can be identified as a pair of active galactic nuclei (AGNs). However, it is difficult to predict from first principles when one and in particular both SMBHs become active during a merger (e.g., Shlosman et al., 1990; Armitage & Natarajan, 2002; Wada, 2004; Dotti et al., 2007). The frequency of AGN pairs can constrain models involving galaxy merger rates and tidally-triggered AGN activity (Yu et al., 2011). Their host-galaxy properties may offer clues to the external and internal conditions under which both SMBHs can be activated during galaxy–galaxy tidal encounters.
When two galaxies merge, the two SMBHs in-spiral, form a bound binary, and harden, before they finally coalesce (Begelman et al., 1980). The coalescence of binary SMBHs is expected to be the strongest source of gravitational waves in the universe, the detection of which would directly test general relativity and could probe SMBH populations out to the early universe (Thorne, 1987; Haehnelt, 1994; Holz & Hughes, 2005). However, there is still little direct observational evidence for small-separation ( pc) gravitationally bound binary SMBHs on Keplerian orbits (see e.g., the review of Colpi & Dotti 2009). 0402+379 is the only unambiguous case known. This object was detected by Very Long Baseline Interferometry as a pair of flat-spectrum radio point sources with a projected separation of 7 pc (Rodriguez et al. 2006; Valtonen et al. 2008). At the early stages of a merger, large-separation (kpc to tens of kpc) AGN pairs where the galactic potential dominates can readily be spatially resolved at cosmological distances. They provide boundary/initial conditions for small-separation pairs. By characterizing the large-separation population, we may gain indirect but useful information on the small-separation population.
There are an increasing number of examples of interacting AGN pairs with kpc to tens-of-kpc separations. Such objects have been identified in the X-ray (e.g., Komossa et al., 2003; Ballo et al., 2004; Bianchi et al., 2008; Piconcelli et al., 2010; Mazzarella et al., 2011) the radio (e.g., Owen et al., 1985), or the optical (e.g., Barth et al., 2008; Comerford et al., 2009b; Green et al., 2010; Liu et al., 2010a). However, most of the known cases of kpc-scale AGN pairs have been serendipitous discoveries. To systematically identify and characterize the population of AGN pairs, we selected 167 obscured AGNs with double-peaked narrow emission lines from a parent sample of 14,756 AGNs (Liu et al., 2010b) in the Sloan Digital Sky Survey (SDSS; York et al., 2000). Using higher resolution near-IR imaging and spatially resolved optical spectroscopy, we identified four kpc-scale AGN pairs among 43 of the 167 double-peaked AGNs (Liu et al., 2010a; Shen et al., 2011). While our work has demonstrated that the double-peak approach allows us to systematically identify kpc-scale AGN pairs, it has two inherent limitations. First, the approach is biased against pairs with line-of-sight (LOS) velocities smaller than 150 km s-1 due to the limited spectral resolution of SDSS spectra. Second, it is biased against pairs with separations a few kpc because pairs with projected separations larger than 3″ (the diameter of the SDSS fiber) will not fall within a single SDSS fiber.
To circumvent the limitations of the double-peak method and to build up the sample of AGN pairs along the merger sequence, we take a complementary approach to identify them. We start with a sample of spectroscopically identified AGNs and select physical pairs with special attention to those that are in mergers or close interactions. Because each AGN in a pair has a separate SDSS spectrum, the current approach is not limited by the SDSS spectral resolution or by the 3″ fiber size. The current sample is sensitive to an earlier stage, with separations of a few kpc to tens of kpc, of galaxy–galaxy mergers than is the double-peak approach. Such systems are quite scarce, so a statistically meaningful study requires homogeneous and large-area redshift surveys such as the SDSS. While galaxy pairs with projected angular separations smaller than 55″ cannot both be observed spectroscopically on the same SDSS plate due to the finite diameter of the fibers, those in the overlap regions of adjacent plates can both be spectroscopically observed (Strauss et al., 2002; Blanton et al., 2003).
The present paper is the first in the series in which we present a statistical sample of AGN pairs from the Seventh Data Release (DR7; Abazajian et al., 2009) of the SDSS. In §2 we describe sample selection, and discuss incompleteness and selection biases. We address the frequency of AGN pairs among the parent sample of optically identified AGNs in §3. We discuss the implications of our results in §4 and conclude in §5. In a companion paper (Liu et al. 2011a, hereafter Paper II), we will characterize host-galaxy recent star formation and BH accretion properties of the AGN pair sample presented here. Throughout we assume a CDM cosmology with , , and km s-1 Mpc-1.
2. Sample Selection
In this section we describe our approach to select AGN pairs. In §2.1, we construct a parent AGN sample optically identified from the spectroscopic sample of SDSS DR7. We then draw AGN pairs with LOS velocity offsets km s-1 and projected separations kpc (§2.2). To mitigate contamination due to pairs that are closely separated but are not interacting and to focus on AGN pairs that are unambiguously experiencing strong tidal encounters, we visually inspect the SDSS images of all AGN pairs and further identify a subset, which we call the “tidal” sample, that exhibits unambiguous morphological tidal features (§2.3). We discuss our sample completeness and selection biases in §2.4.
2.1. The Parent AGN Sample
Our parent AGN sample includes objects drawn from the SDSS “narrow-line”111The “narrow-line” classification here is not meant to be strict. Some AGNs in this sample show broad-line components as well (e.g., Hao et al., 2005b). AGN sample (Kauffmann et al., 2003a), broad-line AGNs (Hao et al., 2005b, a), narrow-line quasars (Zakamska et al., 2003; Reyes et al., 2008), and broad-line quasars (Schneider et al., 2010), all from the DR7222The narrow-line quasar sample of Reyes et al. (2008) was selected from a sample corresponding to 80% of the Data Release 6 (DR6) spectroscopic database (Adelman-McCarthy et al., 2008) so we may miss a small number of narrow-line quasars post DR6.. Below we describe the selection criteria for each population. The redshift cut for all objects is . The lower redshift limit is to balance the need to include nearby galaxies and to avoid redshifts where peculiar velocities can cause substantial deviations from Hubble flow; the upper redshift limit is to ensure H coverage in the SDSS spectra for AGN identification.
-
1.
Narrow-line AGNs. First, we select AGNs from the MPA-JHU SDSS DR7 galaxy catalog333http://www.mpa-garching.mpg.de/SDSS/DR7/ (see Aihara et al., 2011, for a description of the catalog) drawn from the SDSS DR7 spectroscopic database; this database includes 869,580 targets444Here and throughout, we quote the numbers of unique galaxies after excluding duplicate observations of the same galaxy. spectrally classified as galaxies by the specBS pipeline (Adelman-McCarthy et al. 2008; Aihara et al. 2011; see also discussion in Blanton et al. 2005) or quasars that are targeted as galaxies (Strauss et al., 2002; Eisenstein et al., 2001) and have redshifts . We adopt redshifts and stellar velocity dispersions from the specBS pipeline. Additional spectroscopic and photometric properties such as emission-line fluxes and stellar masses are taken from the MPA-JHU data product. The emission line measurements are from Gaussian fits to continuum-subtracted spectra (Brinchmann et al., 2004; Tremonti et al., 2004). The MPA-JHU emission-line fluxes have been normalized to SDSS -band photometric fiber magnitude and have been corrected for Galactic foreground extinction following O’Donnell (1994) using the map of Schlegel et al. (1998). The stellar mass estimates are total stellar masses derived from population synthesis fits using the Bruzual & Charlot (2003) models to SDSS broadband photometry (Kauffmann et al., 2003b; Salim et al., 2007).
We have two selection criteria: (1) emission lines H, [O III] 5007, H, and [N II] 6584 must all be detected with signal-to-noise ratios (S/N) , and (2) the diagnostic emission-line ratios [O III] 5007/H and [N II] 6584/H suggest that the dominant excitation mechanism is from AGN rather than stellar photo-ionization (Baldwin et al., 1981; Osterbrock & Pogge, 1985; Veilleux & Osterbrock, 1987) according to the empirical criterion,
(1) as suggested by Kauffmann et al. (2003a). We address the effect of the adopted S/N threshold for emission-line detections on our results in §3. 129,277 objects meet these two criteria. The Kauffmann et al. (2003a) empirical criterion includes AGN–H II “composite” objects, which represent over half the sample. If we were to adopt instead the theoretical “starburst limit” suggested by Kewley et al. (2001),
(2) in order to exclude the AGN–H II composites, the sample would be reduced to 50,624 objects. We include composites in our analysis, because the results would be otherwise biased against starburst-dominated systems with moderate AGN activity. In a study of hard X-ray selected moderate-luminosity AGNs at from the Swift Burst Alert Telescope AGN sample (Tueller et al., 2010), Koss et al. (2010) find that 33% of AGNs in merging systems show composite or star-forming diagnostic lines. Similarly Goulding & Alexander (2009) found evidence of star formation in the optical emission lines of AGNs identified based on Spitzer infrared spectra of IR luminous galaxies.
-
2.
Narrow-line quasars. Second, we supplement the parent sample with 112 objects from the narrow-line quasar sample of Reyes et al. (2008). These objects satisfy our selection criteria for narrow-line AGNs but are not already contained in the MPA-JHU SDSS DR7 galaxy catalog because they were not part of the main spectroscopic galaxy sample.
-
3.
Broad-line AGNs. Third, we supplement the sample with broad-line AGNs selected by Hao et al. (2005b) extended to SDSS DR7. These are objects selected from the SDSS main galaxy sample (Strauss et al., 2002) at which have a broad H component (FWHM km s-1) from multi-Gaussian fits with a rest-frame H equivalent width (EW) Å. There are 9573 such objects at , and 3710 of them are included in the MPA-JHU DR7 AGN catalog or in the SDSS DR7 quasar catalog (see below). Hao et al. (2005b) show that the narrow-line components of most broad-line AGNs satisfy the Kewley et al. (2001) criteria for narrow-line AGNs. Given the purpose of this work, we supplement the parent AGNs with the new 5863 broad-line AGNs, and keep the 3710 overlaps in our “narrow-line” AGN category without labeling them more carefully. As shown by Reyes et al. (2008), it can be unclear whether an AGN is a narrow-line or a broad-line object when the broad component is relatively faint or when the forbidden emission lines have non-Gaussian profiles (such as extended wings and/or double peaks). The classification can be further complicated by the presence of scattered broad-line region light in obscured quasars (e.g., Zakamska et al., 2006; Liu et al., 2009).
-
4.
Broad-line quasars. We next supplement the parent AGNs with 2944 objects at from the SDSS DR7 quasar catalog (Schneider et al., 2010). The SDSS quasar catalog of Schneider et al. (2010) has a luminosity cut . There are quasars whose luminosities are too low to be included in the Schneider et al. (2010) quasar catalog but have extinction-corrected Petrosian mag consistent with the flux limit of the SDSS main galaxy sample (Strauss et al., 2002). To include those as well we searched through all objects targeted as “quasars” (Richards et al., 2002) at in the spectroscopic sample of SDSS DR7 and further supplemented the sample with 173 broad-line objects after rejecting stellar contaminants. These quasars are not included in the DR7 version of the broad-line AGN sample as they were not targeted as “galaxies” (Richards et al., 2002).
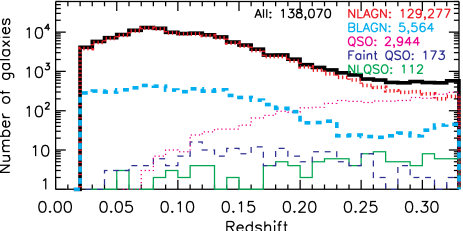
The resulting parent AGN sample consists of 138,070 optically selected AGNs at . We list the numbers of galaxies in each selection category in Table 2. Among the parent AGN sample, 94% are included in the MPA-JHU DR7 galaxy catalog, 2.9% of which are classified as broad-line AGNs according to Hao et al. (2005b) because they have weak FWHM km s-1 H components. This catalog serves as the starting point from which we draw the “pair” sample based on projected and radial separation criteria, and a subset which shows tidal features in SDSS images. To put our results on AGN pairs into context and to compare with “ordinary” AGNs, we also draw control AGNs from this parent sample (Paper II). Figure 1 shows the redshift distribution of the parent AGN sample and its sub-populations.
2.2. AGN Pairs
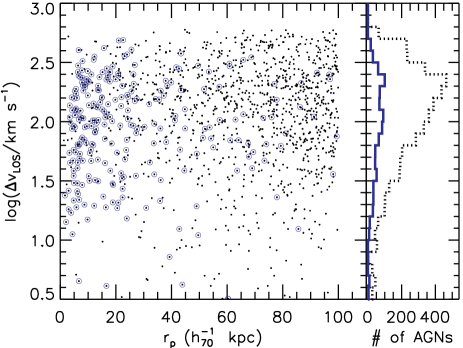
We select AGN pairs from our parent sample of AGNs based on the following criteria: (1) projected separation kpc and (2) LOS velocity difference km s-1. We choose 100 kpc to minimize contamination due to pairs that are closely separated but are not interacting while maintaining a large dynamical range in separation. 100 kpc is somewhat larger than the typical threshold values adopted in galaxy pair studies (e.g., Barton et al., 2000; Ellison et al., 2008; Darg et al., 2010). The velocity-offset threshold also balances contamination and statistics; it is comparable to the galaxy pairwise velocity dispersion for projected separations Mpc (e.g., Zehavi et al., 2002). While galaxy pairs with small projected separations and small velocity offsets are likely to be bound and merge within a Hubble time, the maximum velocity offset of an interacting galaxy pair depends on local environment. To check whether we missed a significant population of interacting galaxies with even larger velocity offsets, we show the distribution of of the AGN pairs in Figure 2. The distribution function drops sharply at km s-1 and the threshold value 600 km s-1 is on the tail of the distribution, verifying that the threshold is adequate.
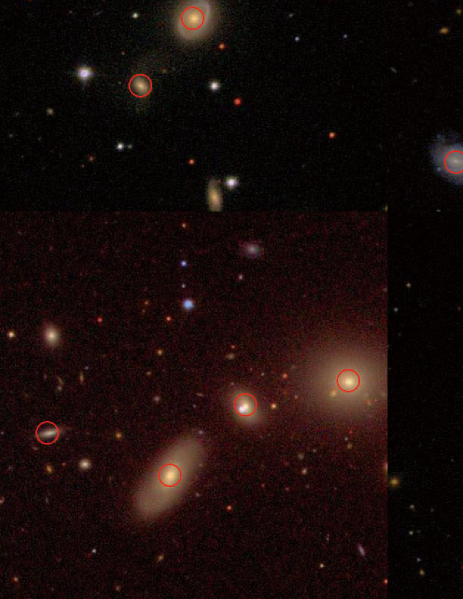
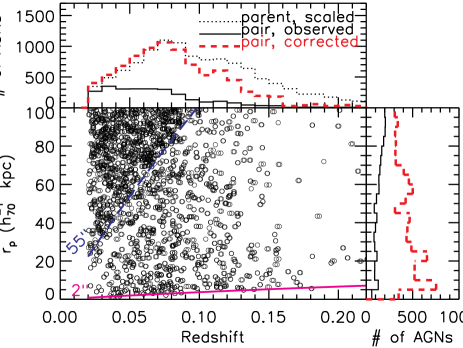
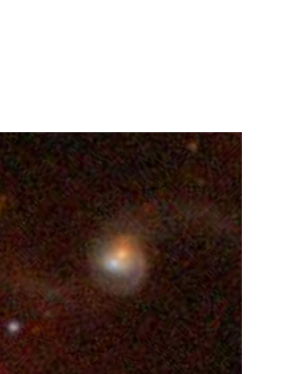
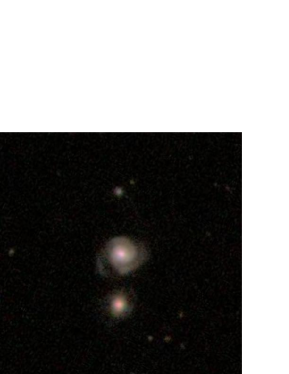
We visually inspected the SDSS images of all spectroscopically selected pairs and rejected 34 false positives due to multiple spectroscopic observations of different locations of the same galaxy. The final AGN pair sample includes 1286 systems with 1244 doubles, 39 triples, two quadruples, and one quintuple totalling 2616 AGNs. Figure 3 shows the SDSS images of six examples of AGN multiples, although they all have large separations without obvious tidal features. Using spatially resolved spectroscopic follow-up of AGN pairs in the sample with kpc and having a third close companion, Liu et al. (2011b) discover a kpc-scale triple AGN. In Table 1, we list basic photometric and spectroscopic measurements for all 1286 systems of AGN pairs or multiples. Figure 4 shows their distributions of redshift and projected separations. While the parent sample spans a redshift range of , only 24 pairs are found at mainly reflecting the sparseness of the parent AGN sample. To mitigate uncertainties due to small number statistics at the higher redshift end, we restrict our statistical analysis to the 2568 AGNs at .
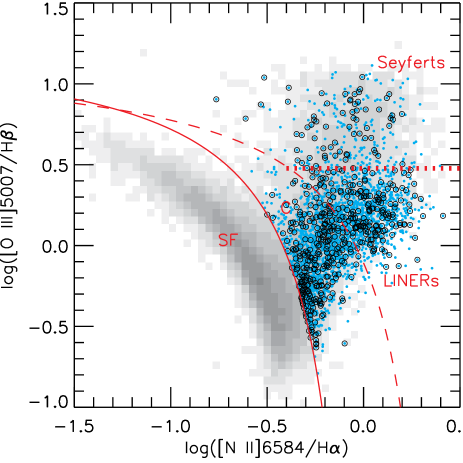
We show in Figure 5 the optical diagnostic line ratios [O III] 5007/H and [N II] 6584/H of AGNs in the pair sample that are contained in the MPA-JHU SDSS DR7 galaxy catalog. Sixty-three percent AGNs in the pair sample lie above the theoretical “starburst limit” of Kewley et al. (2001). In Paper II, we will use this sample to examine star formation and accretion properties in the host galaxies of AGN pairs and their correlations with pair separation.
| SDSS Designation | Plate | Fiber | MJD | Redshift | (′′) | ( kpc) | (km s-1) | (mag) | FAGN | Ftidal |
|---|---|---|---|---|---|---|---|---|---|---|
| (1) | (2) | (3) | (4) | (5) | (6) | (7) | (8) | (9) | (10) | (11) |
| J00:02:49.0700:45:04.8 | 0388 | 345 | 51793 | 5.9 | 9.5 | 63 | 16.08 | 0 | 3 | |
| J00:02:49.4400:45:06.7 | 0685 | 593 | 52203 | 5.9 | 9.5 | 63 | 16.43 | 1 | 3 | |
| J00:02:57.2100:07:50.5 | 0685 | 531 | 52203 | 45.4 | 76.0 | 109 | 16.15 | 2 | 2 | |
| J00:02:58.5900:08:31.0 | 0387 | 072 | 51791 | 45.4 | 76.0 | 109 | 16.67 | 2 | 2 | |
| J00:03:23.7401:05:47.3 | 1490 | 321 | 52994 | 12.2 | 22.4 | 22 | 17.98 | 2 | 2 | |
| J00:03:23.7401:05:59.5 | 0387 | 620 | 51791 | 12.2 | 22.4 | 22 | 17.42 | 2 | 2 | |
| J00:04:25.7809:58:54.4 | 0650 | 598 | 52143 | 24.1 | 49.1 | 53 | 16.41 | 0 | 2 | |
| J00:04:26.6609:58:34.4 | 0651 | 392 | 52141 | 24.1 | 49.1 | 53 | 16.57 | 2 | 2 | |
| J00:04:31.9201:14:11.7 | 0388 | 282 | 51793 | 42.3 | 70.1 | 45 | 17.22 | 0 | 0 | |
| J00:04:33.2501:13:34.4 | 1490 | 241 | 52994 | 42.3 | 70.1 | 45 | 18.47 | 2 | 0 |
Note. — The full table is available in the electronic version of the paper. Col.(1): SDSS names with J2000 coordinates given in the form of “hhmmss.ss+ddmmss.s”; Col.(2): Spectroscopic plate number; Col.(3): Fiber ID; Col.(4): modified Julian date; Col.(6): angular separation; Col.(7): transverse proper separation; Col.(8): line-of-sight velocity offset; Col.(9): SDSS -band model magnitude corrected for Galactic extinction; Col.(10): flag for sub-populations in the parent AGN sample (refer to §2 for details). “0” through “2” are for narrow-line AGNs contained in the MPA-JHU DR7 catalog, where “0” stands for Seyferts, “1” for LINERs, and “2” for composites, respectively, according to the Kewley et al. (2001) and Kauffmann et al. (2003a) criteria for separating AGNs and composites from H II regions, and the Ho et al. (1997) criterion for separating Seyferts from LINERs (Figure 5). “3” for narrow-line quasars in the Reyes et al. (2008) sample but not in the MPA-JHU DR7 catalog, “4” for broad-line quasars, and “5” for broad-line AGNs according to the Hao et al. (2005b) selection; Col. (11): flag from visual identification of tidal features (§2.3). “0” for “non-interaction”, “1” for “ambiguous”, “2” for “tidal”, and “3” for “dumbbell” systems.
2.2.1 Correction for SDSS Spectroscopic Incompleteness
Our sample of AGN pairs is incomplete for pairs with projected angular separations smaller than 55″ because both galaxies are required to have SDSS spectroscopic observations. Due to the finite size of the SDSS fibers, galaxy pairs with separations smaller than 55″ will not both be observed unless they fall in the overlap regions on adjacent plates (Strauss et al., 2002; Blanton et al., 2003). We correct for the fiber collision incompleteness by supplementing the observed AGN pairs with systems randomly drawn from those with separation smaller than 55″, where is the observed number of pairs. Neglecting the tiny fraction of triples and higher multiples, the ratio between the intrinsic and the observed pair fraction is
| (3) |
where 30% is the plate overlap fraction on the sky (Stoughton et al., 2002), is the ratio of pairs to isolated galaxies, is the SDSS spectroscopic completeness in the plate overlap region, and is the spectroscopic completeness in the un-overlapped region (Blanton et al., 2003). when . We show in Figure 4 the distributions of redshift and projected separations of AGN pairs after correction for SDSS spectroscopic incompleteness. The corrected redshift distribution of the pair sample is similar to that of the parent AGNs, except that the pair sample is incomplete for projected angular separation due to the imaging resolution limit of SDSS (the median PSF FWHM of SDSS DR7 images is in ; Abazajian et al. 2009). The corrected distribution function increases with decreasing (Figure 4).
2.3. AGN Pairs with Tidal Features
| Selection | Sub-sample | Parent | Pair | Tidal | Ambiguous | Dumbbell |
|---|---|---|---|---|---|---|
| (1) | (2) | (3) | (4) | (5) | (6) | (7) |
| NLAGN | 129277 | 2529 | 501 | 327 | 20 | |
| NLAGN-Kewley | 50624 | 1583 | 312 | 190 | 18 | |
| BLAGN | 5564 | 79 | 9 | 10 | 0 | |
| NLQSO | 112 | 1 | 1 | 0 | 0 | |
| QSO | 3117 | 7 | 1 | 2 | 0 | |
| , observed | NLAGN | 112242 | 2488 | 482 | 322 | 20 |
| NLAGN-Kewley | 44168 | 1555 | 299 | 186 | 18 | |
| BLAGN | 4595 | 78 | 8 | 10 | 0 | |
| NLQSO | 25 | 0 | 0 | 0 | 0 | |
| QSO | 279 | 2 | 0 | 1 | 0 | |
| , corrected | NLAGN | 112242 | 8116 | 2487 | 1377 | 118 |
| NLAGN-Kewley | 44168 | 5035 | 1552 | 802 | 106 | |
| BLAGN | 4595 | 236 | 42 | 33 | 0 | |
| NLQSO | 25 | 0 | 0 | 0 | 0 | |
| QSO | 279 | 11 | 0 | 5 | 0 |
Note. — Col.(1): selection criteria. The top block is the basic selection, the middle block is restricted to to mitigate uncertainties due to small number statistics at higher redshifts, and the bottom block is after correction for incompleteness due to fiber collisions (§2.2.1); Col.(2): subsamples in our selection of the parent AGN sample. “NLAGN”: narrow-line AGNs according to the Kauffmann et al. (2003a) criterion which is our default, “NLAGN-Kewley”: narrow-line AGNs according to the Kewley et al. (2001) criterion, “BLAGN”: broad-line AGNs, “NLQSO”: narrow-line quasars in the Reyes et al. (2008) sample but not in the MPA-JHU DR7 catalog, “QSO”: broad-line quasars. Refer to §2 for details of each population; Col.(3): number of AGNs in the parent AGN sample; Col.(4): number of AGNs in the pair sample (§2.2); Cols.(5)–(7): number of AGNs in the tidal, ambiguous, and dumbbell categories according to our visual classification of the SDSS images. For details of each category, refer to §2.3.
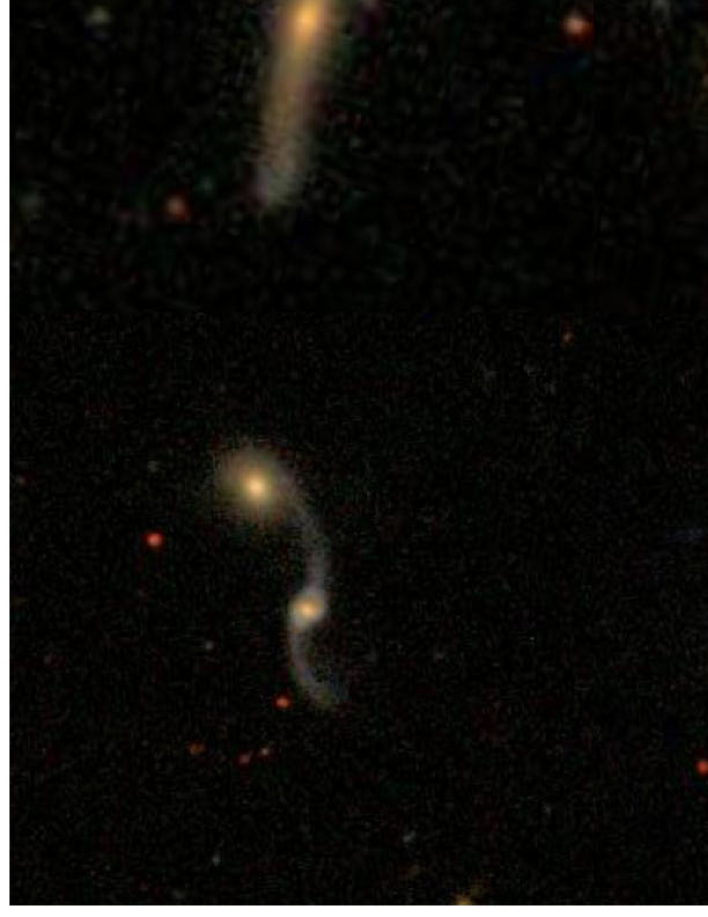
To mitigate contamination due to pairs that are closely separated but are not interacting and to focus on AGN pairs that are unambiguously experiencing strong tidal encounters, we further select from the AGN pair sample what we dub the “tidal” AGN pair sample by visually examining their SDSS images for optical tidal features such as bridges, tails, shells, or rings. We examine both the -color composite images (Lupton et al., 2004) and the calibrated FITS images in all five SDSS bands. We use visual identification as it should be more sensitive to low-surface-brightness (LSB) features and less subject to false positives than automated techniques like model fitting. While quantitative measures of mergers are more objective and yield reproducible results (e.g., Conselice, 2003; Lotz et al., 2004), they may introduce biases toward certain merger stages (e.g., the first pericenter passage and the final coalescence; Lotz et al., 2008).
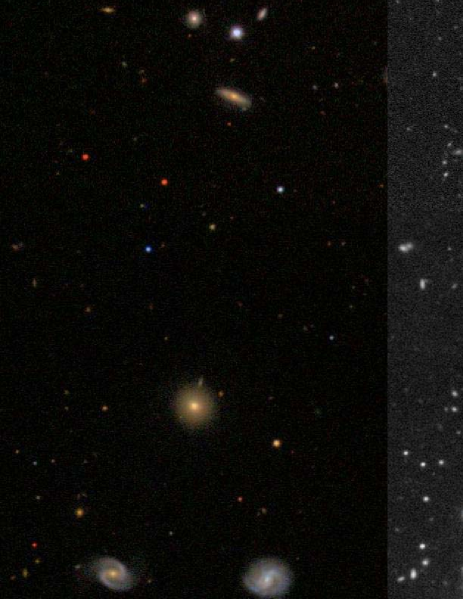
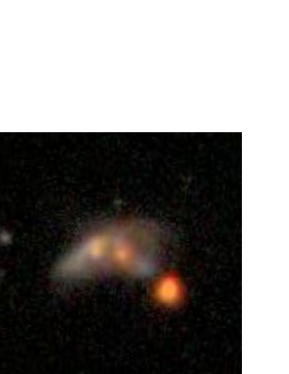
We assign each pair a flag of “tidal”, “ambiguous”, “dumbbell” (discussed below), or “non-interaction” as listed in Table 1. We summarize the numbers of AGNs in each category in Table 2. To mitigate uncertainty of the visual inspection, one of us (X.L.) classified each object in the pair sample five times, with the order of objects scrambled each time and not knowing the results from previous identifications. The identification among five trials is identical for % of the objects; for objects with different classifications from each round (using “0” for non-interaction, “1” for ambiguous, and “2” for “tidal”; there are few “dumbbell” systems and their classification was almost always the same), we take the median as the final result. By inspecting the SDSS single-scan images we found 245 AGN pairs with unambiguous tidal features. In Figure 6 we show SDSS -color composite images of 36 such examples chosen to span the whole range of separations. The system shown in the third column and second row of Figure 6 is Mrk 266, which is a luminous infrared galaxy at . Its northern nucleus is optically classified as a Seyfert 2, whereas the southern nucleus is a LINER. Its double AGN nature is confirmed by Chandra X-ray observations (Mazzarella et al. 2011; see also Brassington et al. 2007 and Wang & Gao 2010).
2.3.1 “Ambiguous” and “Dumbbell” Systems
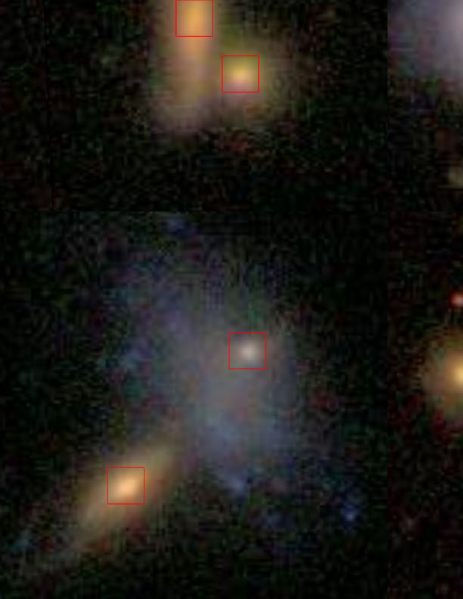
We excluded from our tidal sample those objects we call “ambiguous” pairs of AGNs in which both members exhibit ordered bar or spiral features but show no clear signs of galaxy–galaxy interactions. While these bar or spiral features could arise from galaxy–galaxy interactions, they may also be induced by internal instabilities. There are 169 “ambiguous” pairs and we show six examples in Figure 7. We rejected these pairs because they are not as convincing as pairs with clear merger-induced tidal features (such as disruptive asymmetries or tidal bridges).
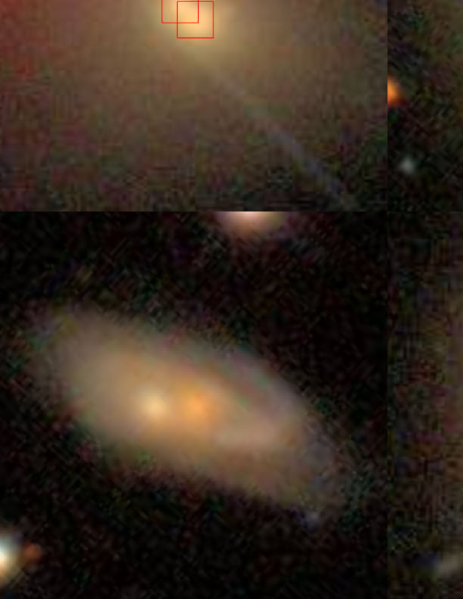
In addition, we excluded ten “dumbbell” systems (e.g., Valentijn & Casertano, 1988), which have double nuclei in a single host galaxy, but show no optical tidal features indicative of ongoing interactions between the two nuclei. Figure 8 shows six such examples. Three of the ten systems contain disk components, whereas the others have optical morphologies reminiscent of 3C75. 3C75 is a double radio source at the center of the galaxy cluster Abell 400 which shows evidence for interactions only in its twin radio jets (Owen et al., 1985; Lauer, 1988; Beers et al., 1992). We did not find evidence for interactions in the radio by examining the FIRST (Becker et al., 1995; White et al., 1997) images of the “dumbbell” pairs, although neither the spatial resolution nor sensitivity is high enough for a strong constraint.
2.3.2 Using the Co-added SDSS Stripe 82 Images to Identify Low-surface-brightness Features
Our identification for tidal features is limited by the surface brightness sensitivity and resolving power of the SDSS images. The limiting magnitude of individual SDSS scan images with a signal-to-noise ratio (S/N) of 5 is mag (in the AB system) for stars (Gunn et al., 1998). To quantify the number of interacting AGNs with LSB tidal features below the sensitivity of individual SDSS scan images (e.g., Smirnova et al., 2010), we examine the co-added images of a subset of AGNs that are located in the SDSS Stripe 82555http://www.sdss.org/legacy/stripe82.html. Stripe 82 is a sky region covering deg2 along the Celestial Equator in the Southern Galactic Cap, which the SDSS has imaged times, producing co-added images 2 mag more sensitive than individual scan images (Abazajian et al., 2009).
We find that 27% of AGN pairs (6 of 22 pairs) in the “ambiguous” category show tidal features in the co-added Stripe 82 images; the LSB missing fraction is lower ( 8.5%, 5 of 58 pairs) for the “non-interaction” category. Figure 9 shows two such examples. We correct for the LSB missing fraction using these estimates of the fraction of the “ambiguous” and “non-interaction” cases in what follows. The LSB correction factor depends on redshift, since the LSB feature detection is redshift dependent due to the limited image resolution. Here what we have estimated using the co-added images is the effective LSB correction factor averaged over the redshift range spanned by the sample, which should be a reasonable approximation as the redshift distribution of the Stripe 82 sub-sample is similar to the parent pair sample. We supplement the tidal AGN pair sample with the 11 pairs identified using the co-added Stripe 82 images. Our final AGN pair sample with tidal features consists of 256 AGN pairs. Table 2 lists the numbers of AGNs in each category. The fraction of AGN-H II composites with tidal features (out of all composites in AGN pairs) is consistent with that of the other AGNs (i.e., narrow-line AGNs that satisfy the Kewley et al. 2001 criterion plus those in the other AGN categories as discussed in §2) with tidal features (out of all the other AGNs in pairs). Among the 512 AGNs in the tidal sample, 501 AGNs are contained in the MPA-JHU SDSS DR7 galaxy catalog, whose diagnostic line ratios are shown in Figure 5; the other 11 objects are selected as either narrow-line or broad-line quasars. In the Appendix, we show the SDSS images and fiber spectra for three examples of AGN pairs with tidal features.
2.4. Selection Incompleteness
The primary factors that limit the sample completeness include the resolution and surface-brightness limits of SDSS photometry, fiber collisions, the limitations of visual identification of tidal features, and the heterogeneity of the parent sample.
Our approach is insensitive to AGN pairs in advanced mergers with nuclear separations that are too small to be resolved by the deblending algorithm of SDSS photometry (Lupton et al., 2001). Pairs with nuclear separations will not be included. At , 1″ corresponds to 2.7 kpc in the assumed cosmology and therefore the sample is incomplete for kpc. At the low-redshift end, the separation limit is set intrinsically by galaxy size, which is a function of stellar mass. AGNs in the pair sample have a median stellar mass log using the stellar mass estimates of Kauffmann et al. (2003b). The -band half light radius is observed to be 3.3 kpc for this stellar mass (Kauffmann et al., 2003c).
Our tidal sample does not include mergers at very early stages before the first pericenter passage; such objects have no detectable tidal features (Toomre & Toomre, 1972). In addition, the strength of the tidally induced features does not increase monotonically with decreasing separation when the merger advances to later stages; it also depends on the progenitor host-galaxy properties and orbital parameters. We keep these separation-dependent limitations and biases in mind when discussing our results, although we do not attempt to correct for them. Additional populations of mergers without discernable optical tidal features may include: minor mergers whose mass ratios are larger than 30 (Lotz et al., 2010), spheroidal mergers with large bulge-to-disk ratios (Mihos & Hernquist, 1996), and mergers on significantly retrograde orbits (Toomre & Toomre, 1972). Some of these biases are mass or morphology-dependent and therefore can be corrected for using control samples matched in galaxy stellar mass (Paper II).
3. Result: the Frequency of AGN Pairs with kpc kpc at
The fraction of AGN pairs with kpc kpc among the parent AGN sample at is 1.1% (1265 systems out of 117,141 AGNs) before correction for SDSS spectroscopic incompleteness and is 3.6% after correction. As the pair sample may contain false positives due to closely separated pairs that are not (yet) interacting, this serves as an upper limit for the intrinsic fraction of interacting AGN pairs.
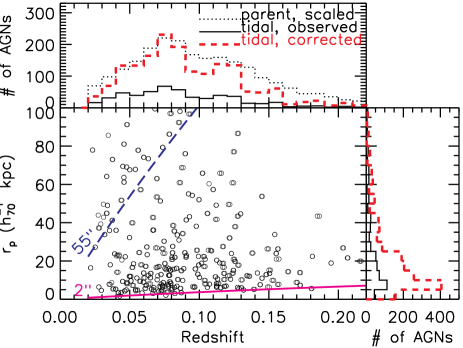
Figure 10 shows redshift versus transverse proper separation and the distributions of these two quantities for AGN pairs with tidal features. There are only nine pairs at . This apparent deficiency likely results mainly from the combination of fewer objects in the parent sample and the decreasing apparent size of tidal features with redshift. The redshift distribution of the tidal sample is roughly consistent with the parent sample both before and after correction for fiber collisions, except that the tidal sample is incomplete for smaller separation pairs (projected angular separation ). The number of tidal pairs found increases with decreasing (except for the bin at the smallest scales, which is affected by the resolution limit of SDSS photometry), a trend that is partly caused by the fact that closer pairs tend to show more prominent tidal features.
We estimate the fraction of AGN pairs with tidal features among the parent AGNs at as
| (4) |
where is the correction factor for spectroscopic incompleteness (Equation 3), is the number of galaxies in AGN pairs with tidal features identified in individual SDSS images, and are the numbers of galaxies classified as “ambiguous” and “non-interaction”, % and % are the correction factors for LSB features estimated based on our Stripe 82 experiment (§2.3.2), and is the number of AGNs in the parent sample. We find 0.3% before correction for spectroscopic incompleteness and 1.0% after correction. Because the tidal sample is incomplete for interacting AGN pairs without detectable tidal features, this serves as a lower limit for the intrinsic fraction of interacting AGN pairs.
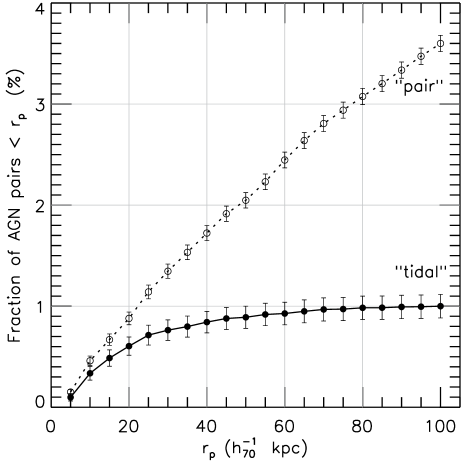
Figure 11 presents how our results vary as a function of upper limit of . Observations of statistical samples of inactive galaxy pairs suggest that kpc is the physical scale in projected separation below which galaxy pairs exhibit significantly higher star formation rates than field galaxies (e.g., Barton et al., 2000; Lambas et al., 2003; Alonso et al., 2004; Nikolic et al., 2004). The fraction of AGN pairs with kpc kpc is 1.3%, among which % show tidal features.
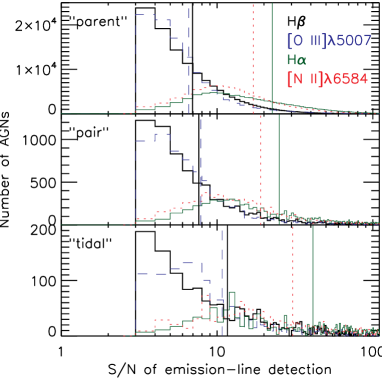
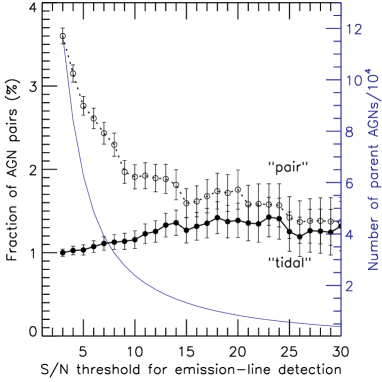
The fraction of AGN pairs we measure depends on the sensitivity of our AGN identification. We adopted an S/N of as our baseline value for the detection threshold of the diagnostic emission lines, H, [O III] 5007, H, and [N II] 6584, in the selection of narrow-line AGNs. We now address how the S/N threshold affects our results for the fraction of AGN pairs. The sample statistics are dominated by narrow-line AGNs (Table 2), and we thus neglect the effects of changing the selection criteria for the other AGN categories. In the left panel of Figure 12, we show the S/N distribution of the four diagnostic emission lines, for AGNs in the parent, pair, and tidal samples (both corrected for fiber incompleteness for the latter two), respectively. For these four emission lines, AGNs in the pair sample have similar S/N distributions to those of the parent AGN sample. On the other hand, AGNs in the tidal sample have larger emission-line S/N than do the parent AGNs; tidal AGNs have median emission-line S/N which are 1.5 times those of parent AGNs. This may be explained if AGN pairs with more prominent tidal features tend to exhibit stronger emission lines (and thereby have higher S/N detections). We increase the S/N threshold and redo the analysis. In the right panel of Figure 12, we show how the fraction of AGN pairs (and those with tidal features) varies with increasing S/N threshold. The fraction of AGN pairs drops from % at S/N to % at S/N. Because the pair and parent samples have similar S/N distributions, the pair fraction would scale if AGNs were uncorrelated (i.e., randomly paired), where denotes the total number of parent AGNs. The observed decay of pair fraction with decreasing is less steep than the uncorrelated case would predict. The fraction of AGN pairs with detected tidal features roughly stays constant with increasing S/N threshold, although we caution that it should be treated as a lower limit and the incompleteness due to the inspection of tidal features is likely higher at lower S/N, if AGN pairs with more prominent tidal features tend to exhibit stronger emission lines. At S/N, % of all AGN pairs show tidal features (Figure 12).
4. Discussion
4.1. Implications for AGN Pairs with Smaller Separations
The fraction of AGN pairs at with kpc kpc is 3.6% corrected for SDSS spectroscopic incompleteness. The pair fraction decreases to 1.0% if we restrict ourselves to those pairs that show clear tidal features in SDSS images. If we assume that (1) the fraction of observed pairs within a certain range of projected separations scales linearly with the time that a merger spends in that range, and (2) the probability that the two AGNs in a merger are simultaneously active does not strongly depend on the merging phase over the range of separations we are considering (i.e., a few kpc to tens-of-kpc scales), then the fraction of AGN pairs on tens-of-kpc scales can be related to the fraction on kpc scales as . The timescales are proportional to the length scales, so will be 0.1% or 0.4% using the tidal and full pair samples, respectively.
Several studies (Liu et al., 2010b; Smith et al., 2010; Wang et al., 2009) have found that % of SDSS AGNs show double-peaked profiles in [O III] 4959,5007 emission lines, in which the two velocity peaks are blueshifted and redshifted from the systemic velocity determined from stellar absorption lines. As shown in Shen et al. (2011), at least 50% of the double-peaked narrow emission lines are due to narrow-line region kinematics such as biconical outflows or rotating disks (e.g., Axon et al., 1998; Veilleux et al., 2001; Crenshaw et al., 2010), while 10% or more reflect the orbital motion of a merging pair of AGNs (e.g. Zhou et al., 2004; Comerford et al., 2009a). In the merging AGN pair scenario for those double-peaked AGNs, the projected angular separation of the two nuclei has to be smaller than 3′′ for both AGNs to be covered by a single SDSS fiber. This corresponds to kpc for the typical redshift of in the Liu et al. (2010b) sample. The fraction of AGNs in kpc-scale pairs we have inferred ( 0.1%–0.4%) suggests that only 10%–40% of AGNs with double-peaked narrow emission lines are merging systems. However, this should be treated as an upper limit, considering there are kpc-scale AGN pairs with LOS velocity offsets km s-1 and therefore will not be identified as SDSS double-peaked narrow-line AGNs. We caution that the estimate is highly uncertain since depends on merger parameters and the host-galaxy properties of AGN pairs. In addition, we use the Kauffmann et al. (2003a) criterion for diagnostic line ratios, whereas the Kewley et al. (2001) criterion was adopted in the Liu et al. (2010b) sample, whose S/N cut for spectral measurements was also more stringent. Nevertheless, Liu et al. (2010a) used follow-up observations to confirm four kpc-scale binary AGNs out of 43 double-peaked objects of the Liu et al. (2010b) sample (see also Shen et al., 2011), in broad agreement with our estimate of based on AGN pairs with broader separations.
4.2. Comparison with Binary Quasars
The fraction of quasars in pairs (with bolometric luminosities of erg s-1) with separations of tens to hundreds of kpc is % at (e.g., Hennawi et al., 2006, 2010; Myers et al., 2008; Shen et al., 2010). This is 8–30 times smaller than what we observe for the less luminous AGN pairs at . If we assume that (1) all luminous high-redshift quasars are triggered in galaxy-galaxy mergers, and (2) the two quasars in a pair shine at random, uncorrelated times, among all quasars the observed fraction of quasar pairs with separations of tens to hundreds of kpc will be roughly the ratio of the quasar lifetime and the time for two galaxies with this separation to merge . Both and span orders of magnitude in their parameter spaces. We speculate that the first of the two assumptions is likely valid for high-redshift luminous quasars, as mergers are arguably the most efficient mechanism to give rise to such high-mass accretion rates. The second assumption is valid, provided that the separations of observed quasar pairs (only a few of which are tens-of-kpc separations) are too large for galaxy–galaxy tidal interactions to be effective (the counterexample of an interacting quasar pair reported by Green et al. 2010 has a separation of 21 kpc which is at the lower bound of known quasar pairs). However, these two assumptions do not necessarily apply to the less luminous AGN pairs; their intrinsic accretion luminosities are roughly three orders of magnitude lower, and the typical projected separations in our sample are smaller by a factor of 10 than the high-redshift luminous quasar pairs. Our AGN pair sample (low-luminosity, low-redshift) and the (luminous, high-redshift) binary quasar samples probe populations at very different redshift and AGN-luminosity regimes, such that a useful direct comparison with the binary quasar samples cannot be made within our sample. In particular, the statistics of our sample is dominated by Seyfert galaxies (and mostly narrow-line Seyferts; Table 2).
4.3. What Fraction of Moderate-luminosity AGNs Are Triggered in Galaxy Interactions?
As above, if we assume that all moderate-luminosity AGNs were triggered in galaxy interactions and the two components in a pair shone at uncorrelated times, the fraction of AGNs in pairs with kpc kpc would roughly be the ratio between the typical lifetime of moderate-luminosity AGNs and the dynamical timescale of galaxy mergers with kpc kpc , which is 10% assuming yr and yr, larger than the 1%–4% value that we have found. This implies that only %–% of moderate-luminosity AGNs can be triggered in galaxy interactions. In addition, we will show in Paper II that the strengths of AGN activity are correlated between the two components in interacting pairs. This correlation suggests that the two SMBHs in a galaxy pair may tend to be activated simultaneously, making the expected fraction of AGN pairs even larger than . Thus, the observed fraction of AGN pairs suggests that fewer than %–% of moderate-luminosity AGNs are triggered in galaxy interactions.
5. Summary
We have selected a sample of 1286 AGN pairs (or multiples) with LOS velocity offsets km s-1 and projected separations kpc from 138,070 optical AGNs in SDSS DR7. Two hundred fifty-six pairs of these show unambiguous morphological tidal features in their SDSS images indicative of ongoing interactions. After correction for spectroscopic incompleteness, the fraction of AGN pairs with kpc kpc and km s-1 is 3.6% among the parent AGNs at . The fraction of AGN pairs that show tidal features is 1.0%.
The current study is a part of our continuing effort to systematically identify and characterize the populations of merging SMBHs at various stages. The sample that we have presented increases the number of known AGN pairs on – kpc scales by more than an order of magnitude, thanks to the statistical power of SDSS. It constitutes the starting point of a statistical analysis of their properties. In Paper II, we will examine the effects of tidal interactions on AGN pairs by quantifying their recent star formation and BH accretion activity as a function of pair separation, calibrated against a control sample of AGNs matched in both redshift and stellar mass distribution, and we will examine correlations between the interacting components.
Appendix A Examples of AGN Pairs with Tidal Features
In Figure 13, we show SDSS images and spectra for three examples of AGN pairs with tidal features. Note that for AGN pairs with small (kpc-scale) separations (e.g., the top object shown in Figure 13), we cannot rule out the possibility that one AGN is ionizing both galaxies (e.g., Liu et al., 2010a). High-resolution X-ray and/or radio observations can help better constrain the double or single AGN nature of these sources.


References
- Abazajian et al. (2009) Abazajian, K. N., et al. 2009, ApJS, 182, 543
- Adelman-McCarthy et al. (2008) Adelman-McCarthy, J. K., et al. 2008, ApJS, 175, 297
- Aihara et al. (2011) Aihara, H., et al. 2011, ApJS, 193, 29
- Alonso et al. (2004) Alonso, M. S., Tissera, P. B., Coldwell, G., & Lambas, D. G. 2004, MNRAS, 352, 1081
- Armitage & Natarajan (2002) Armitage, P. J., & Natarajan, P. 2002, ApJ, 567, L9
- Axon et al. (1998) Axon, D. J., Marconi, A., Capetti, A., Maccetto, F. D., Schreier, E., & Robinson, A. 1998, ApJ, 496, L75
- Baldwin et al. (1981) Baldwin, J. A., Phillips, M. M., & Terlevich, R. 1981, PASP, 93, 5
- Ballo et al. (2004) Ballo, L., Braito, V., Della Ceca, R., Maraschi, L., Tavecchio, F., & Dadina, M. 2004, ApJ, 600, 634
- Barth et al. (2008) Barth, A. J., Bentz, M. C., Greene, J. E., & Ho, L. C. 2008, ApJ, 683, L119
- Barton et al. (2000) Barton, E. J., Geller, M. J., & Kenyon, S. J. 2000, ApJ, 530, 660
- Becker et al. (1995) Becker, R. H., White, R. L., & Helfand, D. J. 1995, ApJ, 450, 559
- Beers et al. (1992) Beers, T. C., Gebhardt, K., Huchra, J. P., Forman, W., Jones, C., & Bothun, G. D. 1992, ApJ, 400, 410
- Begelman et al. (1980) Begelman, M. C., Blandford, R. D., & Rees, M. J. 1980, Nature, 287, 307
- Bianchi et al. (2008) Bianchi, S., Chiaberge, M., Piconcelli, E., Guainazzi, M., & Matt, G. 2008, MNRAS, 386, 105
- Blanton et al. (2003) Blanton, M. R., Lin, H., Lupton, R. H., Maley, F. M., Young, N., Zehavi, I., & Loveday, J. 2003, AJ, 125, 2276
- Blanton et al. (2005) Blanton, M. R., et al. 2005, AJ, 129, 2562
- Brassington et al. (2007) Brassington, N. J., Ponman, T. J., & Read, A. M. 2007, MNRAS, 377, 1439
- Brinchmann et al. (2004) Brinchmann, J., Charlot, S., White, S. D. M., Tremonti, C., Kauffmann, G., Heckman, T., & Brinkmann, J. 2004, MNRAS, 351, 1151
- Bruzual & Charlot (2003) Bruzual, G., & Charlot, S. 2003, MNRAS, 344, 1000
- Colpi & Dotti (2009) Colpi, M., & Dotti, M. 2009, ArXiv e-prints 0906.4339
- Comerford et al. (2009a) Comerford, J. M., et al. 2009a, ApJ, 698, 956
- Comerford et al. (2009b) Comerford, J. M., Griffith, R. L., Gerke, B. F., Cooper, M. C., Newman, J. A., Davis, M., & Stern, D. 2009b, ApJ, 702, L82
- Conselice (2003) Conselice, C. J. 2003, ApJS, 147, 1
- Crenshaw et al. (2010) Crenshaw, D. M., Schmitt, H. R., Kraemer, S. B., Mushotzky, R. F., & Dunn, J. P. 2010, ApJ, 708, 419
- Darg et al. (2010) Darg, D. W., et al. 2010, MNRAS, 401, 1043
- Dotti et al. (2007) Dotti, M., Colpi, M., Haardt, F., & Mayer, L. 2007, MNRAS, 379, 956
- Eisenstein et al. (2001) Eisenstein, D. J., et al. 2001, AJ, 122, 2267
- Ellison et al. (2008) Ellison, S. L., Patton, D. R., Simard, L., & McConnachie, A. W. 2008, AJ, 135, 1877
- Goulding & Alexander (2009) Goulding, A. D., & Alexander, D. M. 2009, MNRAS, 398, 1165
- Green et al. (2010) Green, P. J., Myers, A. D., Barkhouse, W. A., Mulchaey, J. S., Bennert, V. N., Cox, T. J., & Aldcroft, T. L. 2010, ApJ, 710, 1578
- Gunn et al. (1998) Gunn, J. E., et al. 1998, AJ, 116, 3040
- Haehnelt (1994) Haehnelt, M. G. 1994, MNRAS, 269, 199
- Hao et al. (2005a) Hao, L., et al. 2005a, AJ, 129, 1795
- Hao et al. (2005b) —. 2005b, AJ, 129, 1783
- Hennawi et al. (2010) Hennawi, J. F., et al. 2010, ApJ, 719, 1672
- Hennawi et al. (2006) —. 2006, AJ, 131, 1
- Ho et al. (1997) Ho, L. C., Filippenko, A. V., & Sargent, W. L. W. 1997, ApJS, 112, 315
- Holz & Hughes (2005) Holz, D. E., & Hughes, S. A. 2005, ApJ, 629, 15
- Kauffmann et al. (2003a) Kauffmann, G., et al. 2003a, MNRAS, 346, 1055
- Kauffmann et al. (2003b) —. 2003b, MNRAS, 341, 33
- Kauffmann et al. (2003c) —. 2003c, MNRAS, 341, 54
- Kewley et al. (2001) Kewley, L. J., Dopita, M. A., Sutherland, R. S., Heisler, C. A., & Trevena, J. 2001, ApJ, 556, 121
- Komossa et al. (2003) Komossa, S., Burwitz, V., Hasinger, G., Predehl, P., Kaastra, J. S., & Ikebe, Y. 2003, ApJ, 582, L15
- Kormendy & Richstone (1995) Kormendy, J., & Richstone, D. 1995, ARA&A, 33, 581
- Koss et al. (2010) Koss, M., Mushotzky, R., Veilleux, S., & Winter, L. 2010, ApJ, 716, L125
- Lambas et al. (2003) Lambas, D. G., Tissera, P. B., Alonso, M. S., & Coldwell, G. 2003, MNRAS, 346, 1189
- Lauer (1988) Lauer, T. R. 1988, ApJ, 325, 49
- Liu et al. (2010a) Liu, X., Greene, J. E., Shen, Y., & Strauss, M. A. 2010a, ApJ, 715, L30
- Liu et al. (2011a) Liu, X., Shen, Y., & Strauss, M. A. 2011a, ArXiv e-prints 1104.0951
- Liu et al. (2011b) —. 2011b, ApJ, 736, L7+
- Liu et al. (2010b) Liu, X., Shen, Y., Strauss, M. A., & Greene, J. E. 2010b, ApJ, 708, 427
- Liu et al. (2009) Liu, X., Zakamska, N. L., Greene, J. E., Strauss, M. A., Krolik, J. H., & Heckman, T. M. 2009, ApJ, 702, 1098
- Lotz et al. (2008) Lotz, J. M., Jonsson, P., Cox, T. J., & Primack, J. R. 2008, MNRAS, 391, 1137
- Lotz et al. (2010) —. 2010, MNRAS, 404, 575
- Lotz et al. (2004) Lotz, J. M., Primack, J., & Madau, P. 2004, AJ, 128, 163
- Lupton et al. (2004) Lupton, R., Blanton, M. R., Fekete, G., Hogg, D. W., O’Mullane, W., Szalay, A., & Wherry, N. 2004, PASP, 116, 133
- Lupton et al. (2001) Lupton, R., Gunn, J. E., Ivezić, Z., Knapp, G. R., & Kent, S. 2001, in Astronomical Society of the Pacific Conference Series, Vol. 238, Astronomical Data Analysis Software and Systems X, ed. F. R. Harnden Jr., F. A. Primini, & H. E. Payne, 269–+
- Mazzarella et al. (2011) Mazzarella, J. M., Iwasawa, K., Vavilkin, T., Armus, L., Kim, D.-C., Evans, A. S., Spoon, H., & Haan, S. 2011, AJ, submitted
- Mihos & Hernquist (1996) Mihos, J. C., & Hernquist, L. 1996, ApJ, 464, 641
- Milosavljević & Merritt (2001) Milosavljević, M., & Merritt, D. 2001, ApJ, 563, 34
- Myers et al. (2008) Myers, A. D., Richards, G. T., Brunner, R. J., Schneider, D. P., Strand, N. E., Hall, P. B., Blomquist, J. A., & York, D. G. 2008, ApJ, 678, 635
- Nikolic et al. (2004) Nikolic, B., Cullen, H., & Alexander, P. 2004, MNRAS, 355, 874
- O’Donnell (1994) O’Donnell, J. E. 1994, ApJ, 422, 158
- Osterbrock & Pogge (1985) Osterbrock, D. E., & Pogge, R. W. 1985, ApJ, 297, 166
- Owen et al. (1985) Owen, F. N., O’Dea, C. P., Inoue, M., & Eilek, J. A. 1985, ApJ, 294, L85
- Piconcelli et al. (2010) Piconcelli, E., et al. 2010, ApJ, 722, L147
- Reyes et al. (2008) Reyes, R., et al. 2008, AJ, 136, 2373
- Richards et al. (2002) Richards, G. T., et al. 2002, AJ, 123, 2945
- Richstone et al. (1998) Richstone, D., et al. 1998, Nature, 395, A14+
- Rodriguez et al. (2006) Rodriguez, C., Taylor, G. B., Zavala, R. T., Peck, A. B., Pollack, L. K., & Romani, R. W. 2006, ApJ, 646, 49
- Salim et al. (2007) Salim, S., et al. 2007, ApJS, 173, 267
- Schlegel et al. (1998) Schlegel, D. J., Finkbeiner, D. P., & Davis, M. 1998, ApJ, 500, 525
- Schneider et al. (2010) Schneider, D. P., et al. 2010, AJ, 139, 2360
- Shen et al. (2010) Shen, Y., et al. 2010, ApJ, 719, 1693
- Shen et al. (2011) Shen, Y., Liu, X., Greene, J. E., & Strauss, M. A. 2011, ApJ, 735, 48
- Shlosman et al. (1990) Shlosman, I., Begelman, M. C., & Frank, J. 1990, Nature, 345, 679
- Smirnova et al. (2010) Smirnova, A. A., Moiseev, A. V., & Afanasiev, V. L. 2010, MNRAS, 408, 400
- Smith et al. (2010) Smith, K. L., Shields, G. A., Bonning, E. W., McMullen, C. C., Rosario, D. J., & Salviander, S. 2010, ApJ, 716, 866
- Stoughton et al. (2002) Stoughton, C., et al. 2002, AJ, 123, 485
- Strauss et al. (2002) Strauss, M. A., et al. 2002, AJ, 124, 1810
- Thorne (1987) Thorne, K. S. 1987, Gravitational radiation., ed. Hawking, S. W. & Israel, W., 330–458
- Toomre & Toomre (1972) Toomre, A., & Toomre, J. 1972, ApJ, 178, 623
- Tremonti et al. (2004) Tremonti, C. A., et al. 2004, ApJ, 613, 898
- Tueller et al. (2010) Tueller, J., et al. 2010, ApJS, 186, 378
- Valentijn & Casertano (1988) Valentijn, E. A., & Casertano, S. 1988, A&A, 206, 27
- Valtonen et al. (2008) Valtonen, M. J., et al. 2008, Nature, 452, 851
- Veilleux & Osterbrock (1987) Veilleux, S., & Osterbrock, D. E. 1987, ApJS, 63, 295
- Veilleux et al. (2001) Veilleux, S., Shopbell, P. L., & Miller, S. T. 2001, AJ, 121, 198
- Wada (2004) Wada, K. 2004, Coevolution of Black Holes and Galaxies, Published by Cambridge University Press, 186
- Wang et al. (2009) Wang, J., Chen, Y., Hu, C., Mao, W., Zhang, S., & Bian, W. 2009, ApJ, 705, L76
- Wang & Gao (2010) Wang, J., & Gao, Y. 2010, Research in Astronomy and Astrophysics, 10, 309
- White et al. (1997) White, R. L., Becker, R. H., Helfand, D. J., & Gregg, M. D. 1997, ApJ, 475, 479
- York et al. (2000) York, D. G., et al. 2000, AJ, 120, 1579
- Yu (2002) Yu, Q. 2002, MNRAS, 331, 935
- Yu et al. (2011) Yu, Q., Lu, Y., Mohayaee, R., & Colin, J. 2011, ArXiv e-prints 1105.1963
- Zakamska et al. (2003) Zakamska, N. L., et al. 2003, AJ, 126, 2125
- Zakamska et al. (2006) —. 2006, AJ, 132, 1496
- Zehavi et al. (2002) Zehavi, I., et al. 2002, ApJ, 571, 172
- Zhou et al. (2004) Zhou, H., Wang, T., Zhang, X., Dong, X., & Li, C. 2004, ApJ, 604, L33