11email: fpatat@eso.org 22institutetext: Institute of Astronomy RAS, 48 Pyatnitskaya Str.,119017, Moscow, Russia 33institutetext: Department of Astrophysics, University of Oxford, Oxford OX1 3RH, UK 44institutetext: European Organization for Astronomical Research in the Southern Hemisphere; Alonso de Cordova 3107, Casilla 19001 -Santiago 19, Chile 55institutetext: European Space Agency-Space Telescope Science Institute, 3700 San Martin Drive, Baltimore, MD 21218, USA
Connecting RS OPh to [some] Type Ia Supernovae
Abstract
Aims. Recurrent nova systems like RS Oph have been proposed as a possible channel to Type Ia Supernova explosions, based on the high mass of the accreting white dwarf. Additional support to this hypothesis has been recently provided by the detection of circumstellar material around SN 2006X and SN 2007le, showing a structure compatible with that expected for recurrent nova outbursts. In this paper we investigate the circumstellar environment of RS Oph and its structure, with the aim of establishing a firmer and independent link between this class of objects and Type Ia SN progenitors.
Methods. We study the time evolution of Ca ii, Na i and K i absorption features in RS Oph, before, during, and after the last outburst, using multi-epoch, high-resolution spectroscopy, and applying the same method adopted for SN 2006X and SN 2007le.
Results. A number of components, blue-shifted with respect to the systemic velocity of RS Oph, are detected. In particular, one feature strongly weakens in the first two weeks after the outburst, simultaneously with the disappearance of very narrow P-Cyg profiles overimposed on the much wider nova emission lines of H, He, Fe ii and other elements.
Conclusions. We interpret these facts as the signature of density enhancements in the circumstellar material, suggesting that the recurrent eruptions might indeed create complex structures within the material lost by the donor star. This establishes a strong link between RS Oph and the progenitor system of the Type Ia SN 2006X, for which similar features have been detected.
Key Words.:
binaries: symbiotic - novae, cataclysmic variables - stars: individual (RS Ophiuchi) - supernovae: general - supernovae: individual (SN 2006X, SN 2007le)1 Introduction
RS Ophiuchi is a symbiotic recurrent nova (Kenyon kenyon (1986)), that has undergone a number of recorded eruptions, with an inter-outburst period of 10-20 years. The binary system is composed by a K4-M0 red giant (RG) star in a 456 day orbit with a white dwarf (WD) of mass close to the Chandrasekhar limit (Dobrzycka & Kenyon danuta (1994); Shore et al. shore (1996); Fekel et al. fekel (2000); Brandi et al. brandi (2009)). For this reason, RS Oph has been proposed as the prototype for one of the possible channels to Type Ia Supernova explosions (see for example Hachisu & Kato hachisu00 (2000, 2001); Hernanz & José hernanz (2008)). The WD is supposed to accrete part of the material lost by the RG via stellar wind, until it reaches the conditions for thermonuclear burning at its surface. When this happens, the WD ejects 10-8 to 10-6 M⊙ at velocities of 5,000 km s-1 (Hachisu & Kato hachisu01 (2001); Yaron et al. yaron (2005)), producing a shock wave that propagates into the pre-existing RG wind and gives rise to strong X-ray emission, as observed in the 1985 eruption (Mason et al. mason87 (1987)). The last outburst of RS Oph took place on 2006 February 12.83 UT (Narumi et al. narumi (2006)), and prompt radio observations have shown that the nova ejection was bipolar (O’Brien et al. obrien (2006)). Besides confirming that the blast wave clearly deviated from spherical symmetry, the X-Ray data (Bode et al. bode06 (2006); Sokoloski et al. sokoloski (2006)) have indicated a low mass for the ejected material which, in turn, favors a high mass for the WD (1.4 M⊙), giving further support to the proposed connection between RS Oph and Type Ia progenitors (Sokoloski et al. sokoloski (2006)). One important question that remains unanswered, is whether the hot component of RS Oph is a O-Ne-Mg WD rather than a C-O WD, for there are no direct observations that could help to distinguish between the two. In this case, the WD would not experience a thermonuclear explosion, leading to a SN Ia, but rather undergo an electron-capture core collapse, producing a neutron-star remnant (Nomoto & Kondo nomoto (1991)), when its mass gets close to the Chandrasekhar mass.
In addition to the clear detection of circumstellar matter (CSM) very close to the system (O’Brien et al. obrien (2006); Sokoloski et al. sokoloski (2006)), Iijima (iijima (2008, 2009)) has reported the presence of a narrow Na i D absorption component, which is blue-shifted by about 33 km s-1 with respect to the systemic velocity of RS Oph. He proposed that this feature might arise in the wind of the RG, hence arguing for its circumstellar nature. Stimulated by this finding and by the detection of Na i D time-variant features in the Type Ia SN 2006X (Patat et al. patat (2007)), SN 2007le (Simon et al. simon (2009)), 1999cl (Blondin et al. blondin (2008)), and SN 2006dd (Stritzinger et al. max (2010)) we performed a thorough analysis using pre/post-outburst multi-epoch, high-resolution spectroscopy of RS Oph, whose results we are reporting here.
2 Observations and Data Reduction
RS Oph was observed in the pre-outburst, outburst and post-outburst phases using the Fiber-fed Extended Range Optical Spectrograph (FEROS; Kaufer et al. kaufer (1999)) mounted at the ESO-MPG 2.2m telescope. The pre-outburst data set was presented by Zamanov et al. (zamanov (2005)), while the outburst data are going to be thoroughly discussed in a forthcoming paper, to which we refer the reader for a full report on the high-resolution spectroscopic follow-up of RS Oph (Mason et al. in preparation). In order to cover the quiescence phase following the outburst, an additional set of data was obtained in February 2008, about two years after the 2006 eruption.
The instrument delivers a resolving power 48,000, covering the spectral range 3700–9200 Å. The data were processed by the FEROS pipeline, which includes the correction for Earth’s motion. The first set of data was obtained on four epochs between 672 and 530 days before the February 2006 outburst, whilst the second covers 5 epochs between 1.5 and 46.6 days after the eruption. Finally, RS Oph was observed on three consecutive nights about 740 days after the eruption, when the system was well back into the quiescence phase, and the mass accretion had resumed (Worters et al. worters (2007)). The spectra obtained on these three nights were stacked in order to increase the signal-to-noise ratio. The resulting spectrum is presented and discussed here for the first time.
A journal of the observations is given in Table 1. The presence and position of telluric lines, produced by H2O and O2 absorption bands, was checked using a synthetic spectrum computed by the Reference Forward Model111http://www.atm.ox.ac.uk/RFM/. Gas column densities were estimated using VPGUESS222VPGUESS was developed by J. Liske and can be downloaded at http://www.eso.org/jliske/vpguess/index.html, and refined with VPFIT333VPFIT was developed by R.F. Carswell and can be downloaded at http://www.ast.cam.ac.uk/rfc/vpfit.html.
Date MJD Phase Epoch Airm. Exp. Bar.Corr. (km s-1) (days) (s) (km s-1) 2004-04-11 53106.39 0.48 16.6 672.4 1.08 1200 +26.1 2004-06-05 53162.23 0.60 13.5 616.6 1.09 1200 +6.3 2004-06-06 53163.29 0.60 13.3 615.5 1.15 1200 +5.7 2004-08-31 53248.05 0.79 +4.1 530.8 1.13 1200 26.9 2006-02-14 53780.37 0.96 +16.1 +1.54 2.09 120 +24.7 2006-02-25 53791.37 0.98 +16.6 +12.54 1.57 30 +27.1 2006-03-07 53801.40 0.00 +16.7 +22.57 1.22 90 +28.4 2006-03-18 53812.42 0.03 +16.5 +35.59 1.10 180 +28.7 2006-03-31 53825.41 0.06 +15.7 +46.58 1.08 300 +27.9 2008-02-24 54520.35 0.58 14.5 +741.52 1.72 4840 +26.9 2008-02-25 54521.35 0.58 14.5 +742.52 1.75 4200 +27.0 2008-02-26 54522.36 0.58 14.5 +743.53 1.78 4650 +27.2
3 Inter- and/or circumstellar lines towards RS Oph
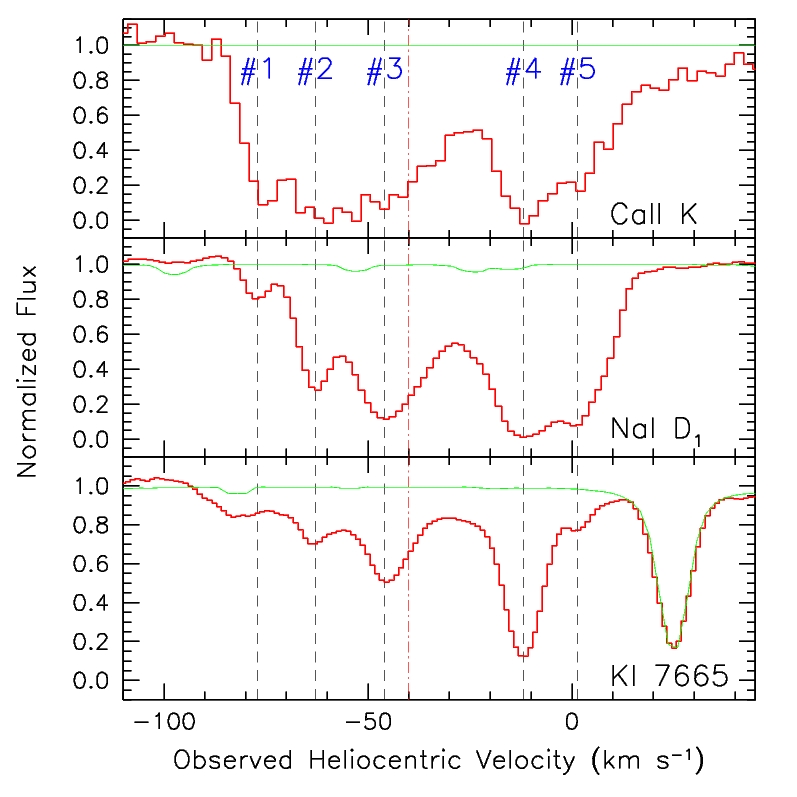
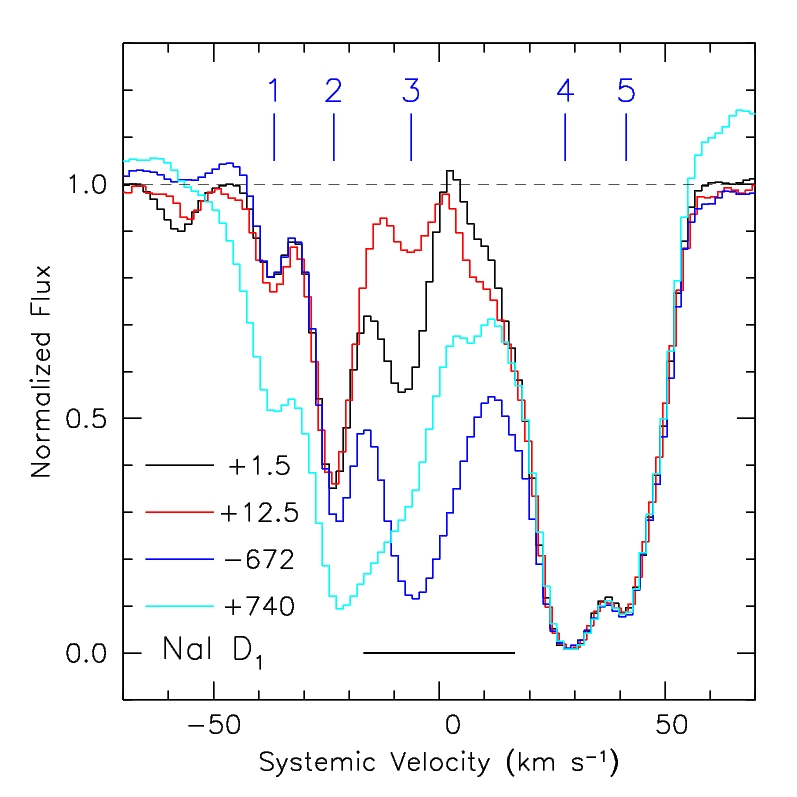
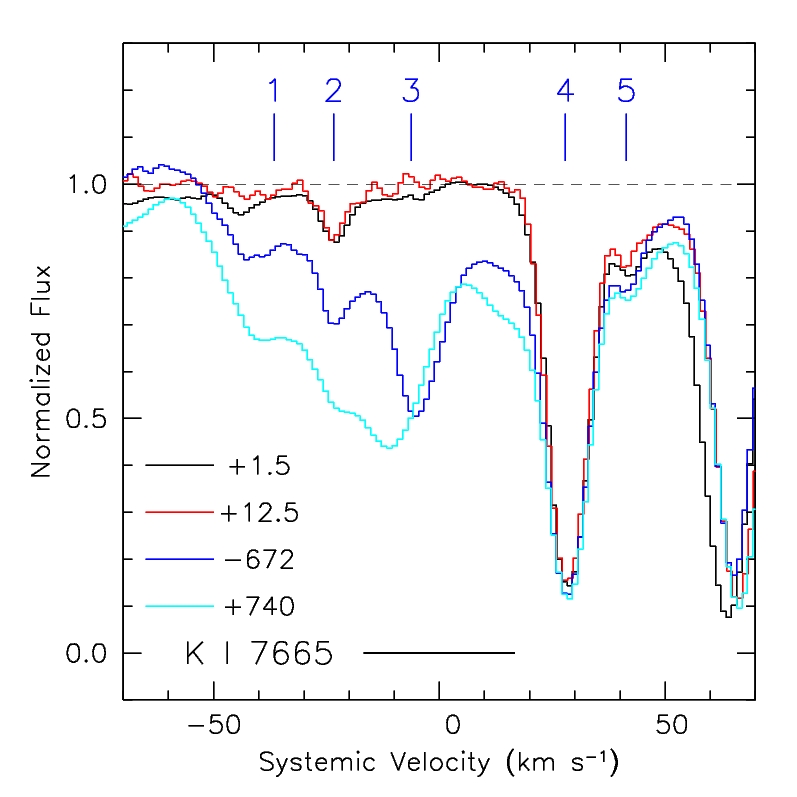
Pronounced Ca ii H&K, Na i D, K i 7665, and K i 7699 are detected in the high-resolution spectra of RS Oph, as it is shown in Fig. 1. While the K i 7699 profiles are rather severely affected by telluric absorptions, these are practically negligible for the other lines. Besides two intense features at heliocentric velocity 12 km s-1 (#4) and +2 km s-1 (#5), arising in the local spiral arm (Hjellming et al. hjellming (1986)), the data reveal at least three distinct components444In the spectra presented by Iijima (iijima (2008, 2009)), obtained on February 18.2 (+5.4) and 19.2 (+6.4) with a resolution 10,000, these components are severely blended. at 77 (#1), 63 (#2) and 46 km s-1 (#3), respectively. The same components, though with different intensities, are visible in all Ca ii, Na i, and K i features (Fig. 1). Besides those already mentioned, other shallower features are most likely present between 40 and 20 km s-1, but they contribute only marginally to the overall profile.
As the systemic velocity of RS Oph is 40.2 km s-1 (Fekel et al. fekel (2000); see also Brandi et al. brandi (2009)), components #1 to #3 must arise in material coming towards the observer, at velocities where no interstellar component is expected (Kerr & Westerhout kerr (1965); see also Cassatella et al. cassatella (1985); Hjellming et al. hjellming (1986); Snijders snijders (1987)).
This is a most intriguing fact, especially if it can be proven that these absorptions arise in the circumstellar environment. In this context, the first question to be answered is about the possible/probable presence of a photospheric absorption component, which may further complicate the picture.
4 The spectrum of the giant during quiescence
The spectral type of the donor star in the RS Oph system, based on the study of molecular bands in the near-IR, is uncertain and ranges from K4 III to M0 III (Mürset & Schmid muerset (1999)). The effective temperature is estimated to be in the range 4100–4400 K, and the metallicity is [M/H]=0.170.1. Additionally, the star is reported to show an anomalously high Li abundance (Wallerstein et al. wallerstein (2008); see also the discussion in Hernanz & José hernanz (2008) and Brandi et al. brandi (2009)).
Because of the presence of a hot component, the spectrum of the giant is heavily veiled (Bruch bruch (1986)), so that below 4000 Å this is dominated by the hot component, while at 5500 Å the contribution of the cool component is between 30 and 50% (Dobrzycka et al. danuta96 (1996)). For these reasons it is natural to expect the strong and wide photospheric Na i D lines typical of a cool giant to be visible in the composite spectrum555Marked Na i D lines, supposedly arising from the cool component, were reported by Bruch (bruch (1986)), with a global equivalent width of about 3 Å. Nevertheless, given the low resolution of Bruch’s data, most of the absorption he measured is most probably caused by the interstellar component..
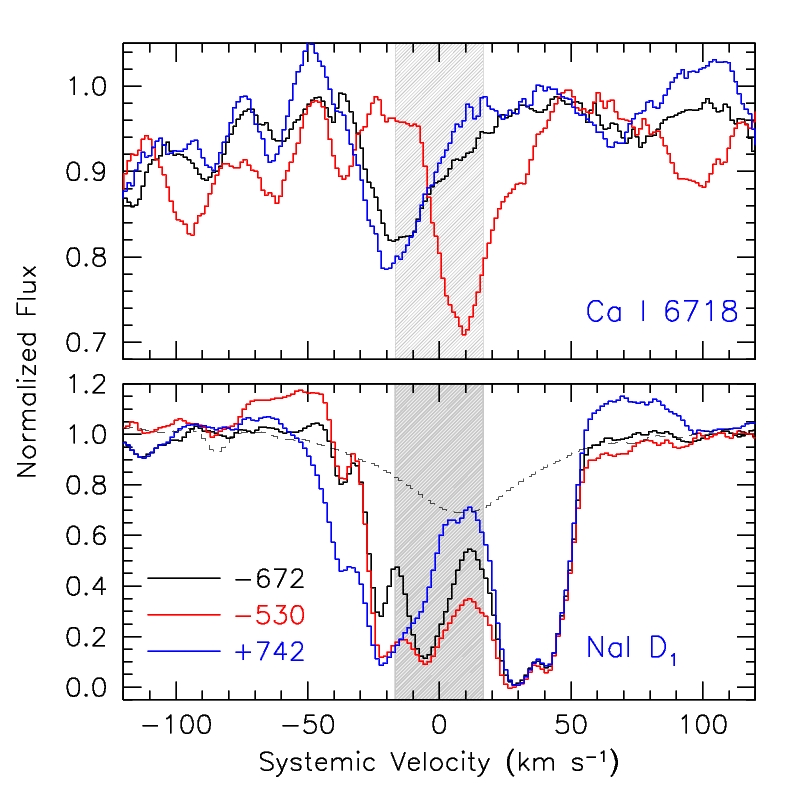
Therefore, a possible explanation for the changes in the Na i D absorption features during the quiescent phase (see Fig. 2, lower panel) is the variation of the lines in the M giant spectrum. These might be explained in terms of wavelength shifts due to the orbital motion, but also as intrinsic line variability. In fact, the hot components of symbiotic systems are known to heat the facing hemispheres of the red companion, hence producing temperature changes in their atmospheres large enough to change the lines shapes (see Kenyon et al. kenyon93 (1993) and references therein). Indeed, in the case of RS Oph both mechanisms might be at work. This is shown in the upper panel of Fig. 2, where we plotted the region of the Ca i 6718 line for the first (672 days) and the last (530 days) pre-outburst epochs in our data set. Besides the velocity shift observed between the two epochs (25 km s-1), the Ca I line shows a significant depth increase, a behavior that is common also to other stellar lines (like Li i 6707, very neatly detected in our spectra). This might explain, at least partially, the evolution of the Na i D absorption profiles observed during the quiescence phase (Fig. 2, lower panel).
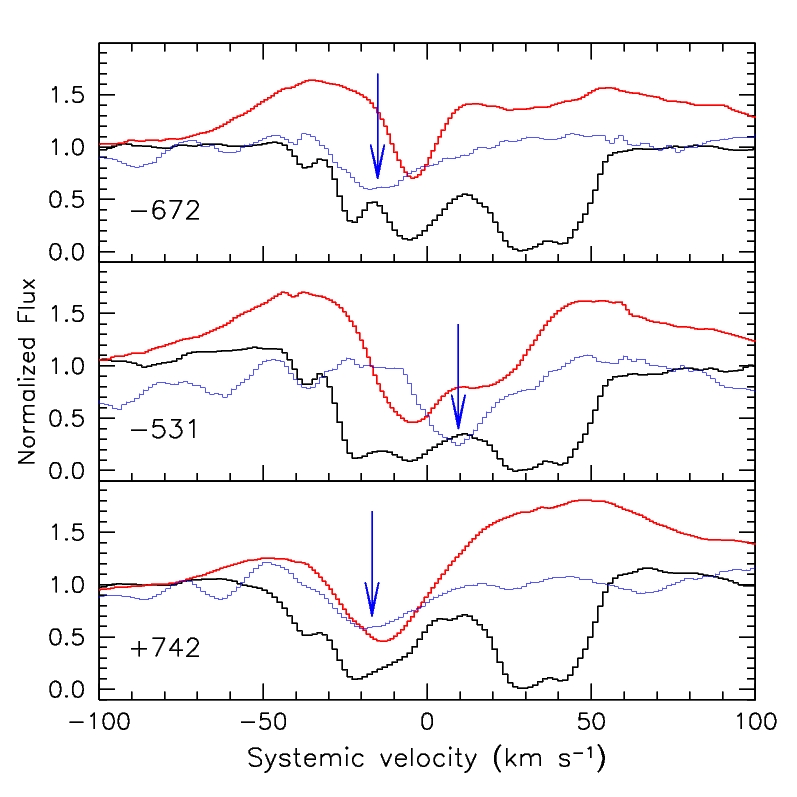
An important fact to be noticed is that Na i D and Ca ii H&K regions are most probably affected by the presence of components arising in the circumbinary environment, which are characterized by the complex profiles seen in other prominent lines like H and He (see for instance Zamanov et al. zamanov (2005); Brandi et al. brandi (2009)). Because of the presence of interstellar and possible circumstellar components, it is very difficult to distinguish these components in Na i D, Ca ii H&K, and K i lines. Nevertheless, this becomes feasible for other strong lines, where the circum/interstellar components are absent, like the near-IR Ca ii triplet. An example is presented in Fig. 3, where the evolution of Ca ii 8662.14 is compared to the one of Na i D1. The changes seen in the NIR-Ca ii lines are followed by those in the Na i profile and can be explained, at least partially, by the radial velocity shift of the M giant, traced by the Ca i 6718 line.
Therefore, during quiescence there certainly is a stellar component, possibly characterized by a complex structure, which affects the observed profile of the narrow absorption lines arising in the inter/circumstellar environment.
5 Evolution of absorption features during outburst
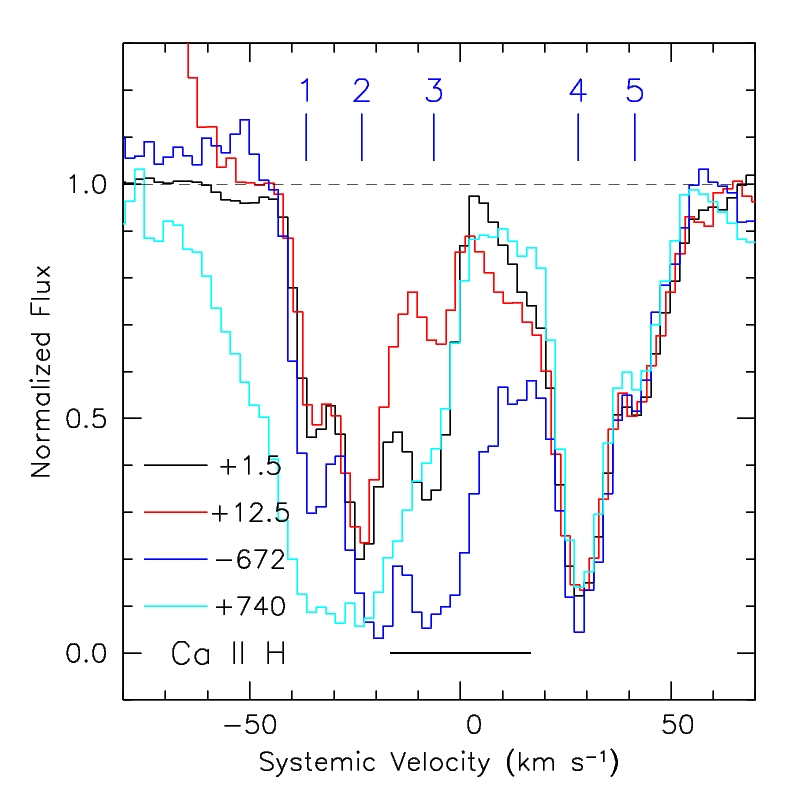
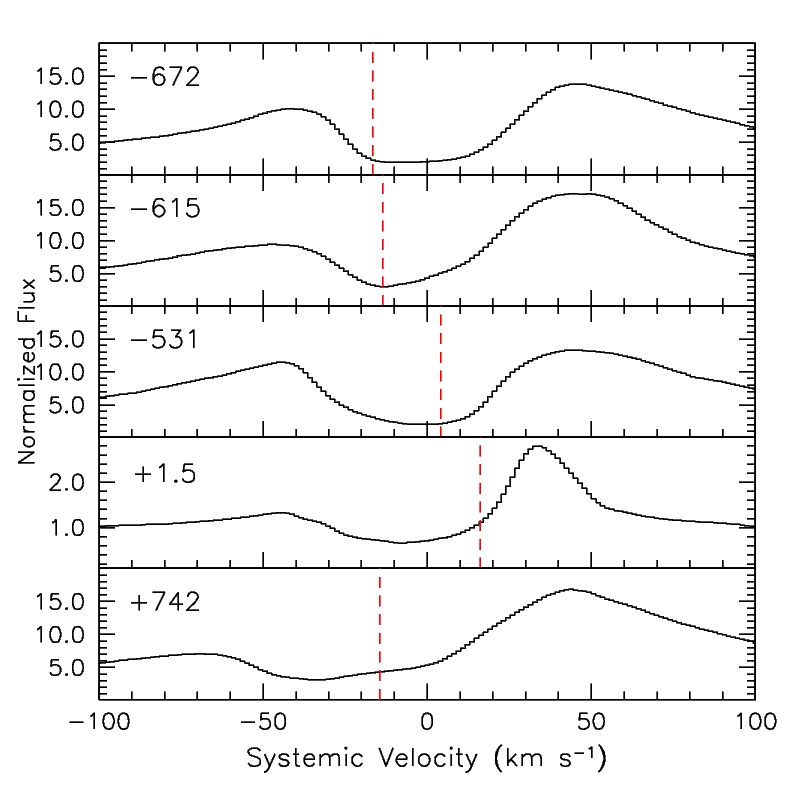
The time evolution during one pre-outburst (672 days), two outburst (+1.5, +12.5 days), and one post-outburst (+742 days) epochs is presented in Figs. 4, 5, 6 for Ca ii H, Na i D1, and K i, respectively. The most striking fact shown by these plots is the marked evolution of component #3.
For the specific case of Na i, in the pre-outburst epoch this component is almost completely saturated, while on day +1.5 its depth has decreased by about a factor 2. The line appears to have weakened further on day +12.5, after which it does not show any significant evolution up to the last epoch covered by our data (+46.6). The column density retrieved from component #3 changes from 12.9 on day 672 to 12.1 on day +1.5, to finally reach 11.3 on day +22.6, implying a variation of over a factor 30. The line width (=FWHM/1.665) derived for this component ranges between 3 and 4 km s-1 during the post-outburst epochs, while for the pre-outburst epoch the best fit gives 8.5 km s-1. This is a further indication that an additional component is present prior to outburst, most likely due to the M giant intrinsic absorption (see Sect. 4).
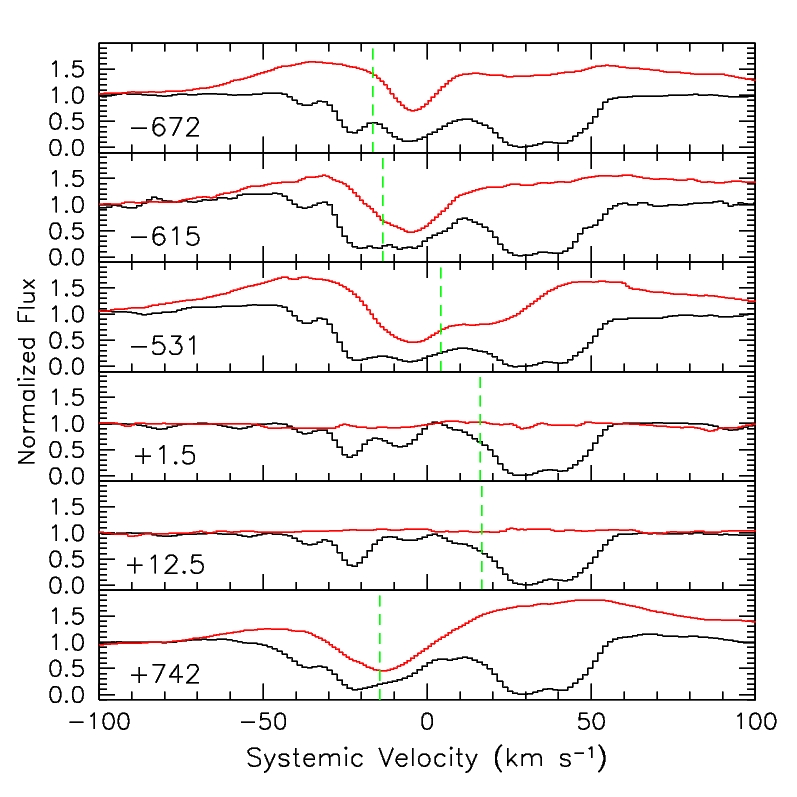
In general, the behavior seen in Ca ii H&K is very similar to that of Na i D, with component #3 clearly decreasing in intensity, both between the pre-outburst (672) and the first outburst (+1.5) epochs, and between the first two outburst epochs (+1.5, +12.5). Importantly, the pronounced evolution displayed during the first two weeks after the outburst clearly demonstrates that this cannot be attributed solely to the disappearance of the photospheric component. In fact, during these phases the overall luminosity of the system is 100 times larger than that of the M giant, making its relative contribution to the total spectrum negligible. This is illustrated in Fig. 7, where we plotted the comparison between the evolution of the near-IR Ca ii 8662 and Na i D1 across several of the epochs covered by our observations. While during quiescence the complex profile of Ca ii is clearly detected, this is completely missing during the outburst. On the contrary, barring the variation seen in component #3, the blue-shifted Na i components are always visible, ot all epochs. The same is true for the Ca ii H&K features.
Therefore, absorption components #1, #2 and #3 certainly arise outside of the stellar atmosphere, and outside the nova ejecta. In addition, the variation seen in component #3 tells us that at least that feature cannot be interstellar. In this respect, an even more conclusive argument about the nature of all blue-shifted features comes from a closer inspection of Fig. 6. At variance with what is seen for Na i D and Ca ii H&K, the K i absorptions disappear almost completely during the outburst (component #2 is still visible on days +1.5 and +12.5. See also Sect. 6). This definitely rules out an interstellar origin for these lines.
A hint to the physical mechanism responsible for the observed line variations comes from the following consideration. The variations appear to be stronger for species with lower ionization potentials: the largest changes are seen for K i (4.3 eV), while the weakest ones are observed for Ca ii (11.9 eV), with Na i (5.1 eV) showing an intermediate behavior. This suggests that the weakening of absorption features is related to a change in the ionization balance, induced by the radiation field produced by the nova and/or by the interaction between the nova ejecta and pre-existing, circumstellar material.
At variance with the SN case, where the system is completely disrupted by the explosion, the recurrent nova case offers the possibility of studying the CS environment also after the outburst. With the aid of the +742 epoch, obtained when the system is supposed to be back to the quiescence phase (Worters et al. worters (2007)), one can directly verify whether the outburst has modified the CSM in a sensible way. In this respect, the evolution shown in Figs. 4, 5, and 6 is revealing. Although the post-outburst epoch was obtained at a similar orbital phase of the pre-outburst epoch 672 (see Table 1), the profile is markedly different, with an enhanced absorption in the blue. This is common to Ca ii, Na i, and K i, pointing to a global modification of the circumstellar environment produced by the nova ejecta.
This conclusion is strengthened by the analysis of the H profile presented in Fig. 9. The post-outburst profile departs from that seen during the 3 pre-outburst epochs, in that the absorption extends far more into the blue, reaching a systemic velocity of about 60 km s-1. Given the evolution shown in the pre-outburst phases, it is evident that the variation seen on day +742 cannot be explained in terms of the pure orbital motion of the M giant. The question as to whether this is a transient phenomenon or a more stable perturbation of the circumstellar configuration will have to await for follow-up high resolution spectroscopy.
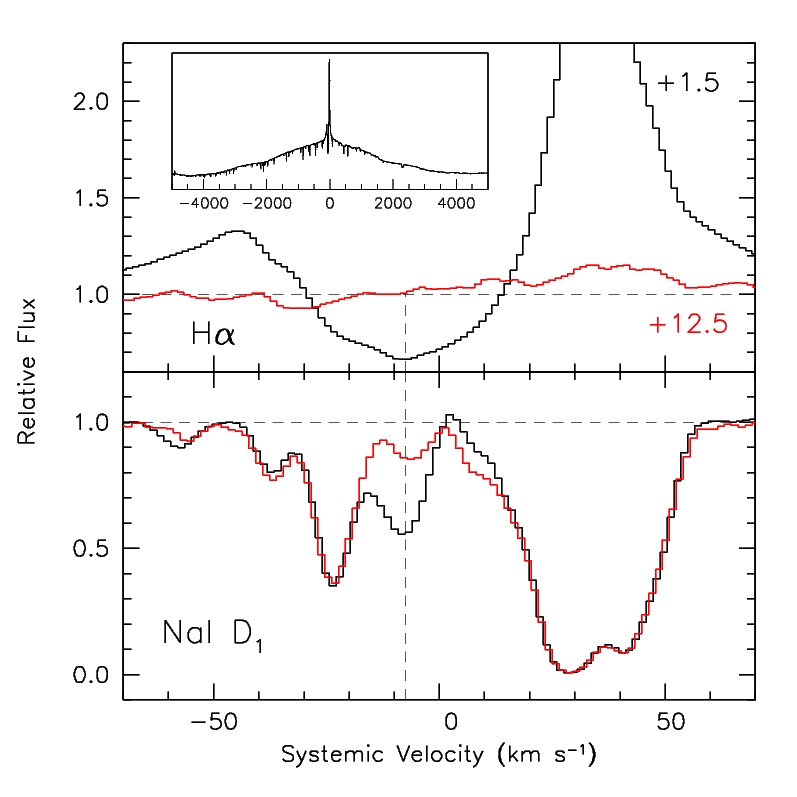
A very remarkable fact observed in conjunction with the weakening of component #3 is the disappearance of a narrow P-Cygni profile which is well visible in H, He, O i and basically all other broad emission lines on day +1.5. For example, on this epoch, H shows a rather complex, multi-component profile, with a FWHM of about 3400 km s-1, indicating exceptionally high expansion velocity for the nova ejecta. On top of this emission, a narrow P-Cyg profile is present, with the minimum of the absorption trough placed at a velocity of about 10 km s-1 (Fig. 8, upper panel). This is notably similar to that of the time variable Ca ii/Na i/K i feature #3 (see also Fig. 8, lower panel). On the next epoch (day +12.5), this narrow feature has completely disappeared, leaving the pure underlying H broad emission profile with FWHM1250 km s-1.
The disappearance of the narrow P-Cyg absorptions soon after the outburst indicates that the gas in which they originate must be close to the eruption site, in order to be influenced by the radiation field and/or by the direct interaction with the nova ejecta, that is known to start immediately after the outburst (O’Brien et al. obrien (2006); Sokoloski et al. sokoloski (2006)).
The most natural conclusion one can draw from all these facts is that the narrow, blue-shifted absorptions observed in RS Oph arise in circumstellar material.
6 Discussion
The time variations of the Na i, Ca ii and K i lines observed in RS Oph are rather dramatic, and cannot be compared to the known, long timescale fluctuations observed along the line of sight to galactic stars (Crawford crawford (1992)). They are much more resemblant to those observed in the Type Ia SN 2006X (Patat et al. patat (2007)) and 2007le (Simon et al. simon (2009)). These were interpreted as arising in the circumstellar material, whose physical conditions where probably modified by the explosion, both by the radiation field and by the direct interaction with the SN ejecta (see the discussion in Chugai chugai08 (2008) for an alternative scenario. See also Patat et al. patat10 (2010)). To the best of our knowledge, short timescale variations of narrow absorptions are known to this level of detail only for another object, i.e. the core-collapse, type IIn SN 1998S (Bowen et al. bowen (2000)). High resolution spectroscopy of this object has revealed a number of Na i D components within the host galaxy, the bluest of which deepened significantly during the 19 days spanned by the two epochs available, implying a Na i column density increase of 1 dex. SN 1998S has shown definite signs of ejecta-wind interaction in the form of narrow H and He P-Cyg profile lines and, remarkably, these features were detected at the same velocity of the Na i D variable component, and showed the same deepening with time. Bowen et al. (bowen (2000)) concluded that the narrow and variable absorption is a signature of the outflows from the super-giant progenitor of SN 1998S, arising in a dense shell, expanding at about 50 km s-1 (see also Fassia et al. fassia (2001)).
Given all the evidences collected in this work (see Sect. 5), the most plausible possibility is that the time variant Na i, Ca ii, and K i features are produced within the circumstellar environment of RS Oph. Since clear signs of interaction between the CSM and the nova ejecta were detected immediately after the eruption (O’Brien et al. obrien (2006); Sokoloski et al. sokoloski (2006)), it is reasonable to argue that the weakening of component #3 is due to the interaction with the fast moving nova ejecta, which sweep away the pre-existing material. Under this hypothesis and given the fact that the interaction must have already started by the time of our second outburst epoch, an upper limit to the distance of this gas can be obtained from the ejecta velocity (4,000 km s-1) and the time of interaction (12.5 days), and it turns out to be 41014 cm.
The velocity measured for the time-variable component #3 (6.3 km s-1) is significantly smaller than that expected for a RG wind. Even taking into account the combination of wind velocity, rotational velocity, orbital velocity and hydrodynamical effects, the radial speed of the outflowing material is expected to be between 20 and 50 km s-1, depending on the viewing angle (Walder, Folini & Shore walder (2008)). Therefore, it is plausible that component #3 arises within the circumbinary environment, at variance with components #1 and #2, which most likely arise much farther out (see the discussion below).
The problem with this scenario is the absence of a P-Cyg profile in the Na, Ca and K lines, contrary to what is seen in H, He i, O i, Fe ii and Si ii lines. The most viable explanation is that Na i, Ca ii, and K i lines arise in an asymmetric density enhancement lying along the line of sight, while H and other lines are generated both in an asymmetric and in a more symmetric material, possibly identified as a circumbinary equatorial wind. The reason why we do not see Na i, Ca ii, and K i lines arising from the symmetric component is plausibly a strong ionization due to their low ionization potential. In fact, all the ions for which P-Cyg profiles are observed have higher ionization potentials (H: 13.6 eV; He i: 24.6 eV; O i: 13.6 eV; Si ii: 16.3 eV; Fe ii: 16.2 eV) than Na i (5.1 eV), Ca ii (11.9 eV) and K i (4.3 eV) and higher (by at least 1 dex) abundance than Na, Ca and K. Therefore the latter three species, being strongly ionized in the wind, are practically unobservable. Only in the dense asymmetric component the optical depth in these absorptions is sufficient to produce detectable features. In this respect we note that the emergence of asymmetric, dense structures lacking point-symmetry, is a natural consequence of the orbital motion of a mass-loosing red giant (Mastrodemos & Morris mastrodemos (1999)). In general, when dealing with a system like RS Oph, one should bear in mind that the dynamic conditions of the circumbinary gas are most likely non-stationary, because the flow is strongly affected by the orbital motion. This may result in the formation of transient absorbing structures in the line of sight at similar orbital phases, which make very difficult a proper modeling of the geometry and gas flow of the CSM. Hydrodynamical 3D-simulations by Walder et al. (walder (2008)) show that during quiescence the circumbinary matter of RS Oph can be described as an oblate spheroid on the scale of cm, while on smaller scales ( cm) the geometry is rather complicated, and essentially lacks point-symmetry.
As we mentioned above, the early disappearance of component #3 is strongly suggestive of a circumbinary nature. In this respect, it is interesting to note that the so called cF-absorption system was destroyed during the outburst (Brandi et al. brandi (2009)). It then reappeared (accompanied by flickering) about 8 months after, indicating the resumption of accretion (Worters et al. worters (2007)). The cF-absorptions are believed to be related to the hot component of the binary system (Mikolajewska & Kenyon mikolajewska (1992)). In addition, their measured velocities are lower than 10 km s-1 (Brandi et al. brandi (2009)), which is consistent with the low velocity deduced for component #3 (6 km s-1). This establishes a further and independent link between this feature and the circumbinary material. Brandi et al. associate the cF-absorption system to the material streaming towards the hot component. We emphasize that if component #3 arises within this gas, that conclusion does not hold, for this feature is still visible on day +1.5, and it must therefore lie farther out. Indeed, at this age the radius of the nova shell is 4.5, i.e. larger than the binary separation (2 cm).
From the spatially resolved HST observations of the 2006 eruption, it is clear that the nova remnant has a bipolar morphology, resulting from the interaction of the outburst ejecta with CSM that is significantly denser in the equatorial regions of the binary than at the poles (Bode et al. bode07 (2007)). In general, the interaction of the nova ejecta with the CSM should essentially modify the density and velocity field of the CS environment formed during quiescence. The accelerated CS gas presumably acquires a broad range of densities and velocities, depending on the polar angle. In this respect, it is tempting to explain component #1 as the outcome of the interaction between the nova ejecta and the RG wind lost during the last quiescent phase.
To provide a first order insight into this possibility, we consider a spherical approximation, and assume that the mass is lost by the RG with a wind velocity in the course of the last inter-outburst phase (1986–2006). The nova ejecta, characterized by mass and kinetic energy , sweep up the material lost during quiescence, and forms a shell with mass . This expands at a final velocity , which is dictated by momentum conservation. To estimate this velocity one needs to express the initial momentum carried by the ejecta as a function of and . To this end, we assume that the nova ejecta start to expand homologously, with an exponential density distribution , where the scale velocity is determined by and . Adopting typical values and erg, one gets cm s-1 (note that the outer ejecta of course have much larger velocities). The ejecta momentum, integrated over the sphere for the adopted ejecta structure, is . Momentum conservation then leads to the following relation between mass ratio and velocities
Adopting a typical RG wind velocity km s-1, a final velocity of the swept-up shell km s-1, the ejecta parameters erg and , from the above expression one obtains , or . The latter implies a RG mass-loss rate = yr-1, which is quite a sensible value for a RG in a symbiotic system (Seaquist & Taylor seaquist (1990)).
Despite our crude approximations, this estimate indicates that component #1 might be related to the wind material accelerated by the nova ejecta. If the absorption is produced by the shell formed by the previous 1986 outburst, then the absorber with a velocity of 50 km s-1 is located at a radius 3 cm. In this scenario, this spatial scale would also be equal to the distance between subsequent shells.
This simplified picture for component #1 neglects two important issues: i) the deviation of the CSM from spherical symmetry, which results in the dependence of final velocities on the polar angle; ii) the Rayleigh-Taylor instability of the swept-up shell, which results in shell fragmentation. The latter is essential for understanding the absence of scattered emission in component #1 (see above). Indeed, if the covering factor of fragments is , then the intensity of the scattered emission is suppressed by the same factor with respect to that arising in the spherical, smooth shell. On the other hand, the absorption can be rather strong (i.e. comparable with that of the spherical component) if the absorbing cloud accidentally gets into the line of sight.
In fact, the absorption can be produced also by more distant CS clouds formed by previous outbursts and mass-loss. The Ca ii column density required to produce a Ca ii 3968 line with an optical depth =1 is cm-2 (for km s-1). If calcium is mostly Ca ii, then for a solar abundance this line can be detected, provided the cloud produced by the shell fragmentation lies at a distance of about 2 cm. For instance, in the case of , Ca ii would be detectable up to a maximum radius cm.
Based on the available data, Iijima (iijima (2008, 2009)) identified the blue-shifted component at systemic velocity 33 km s-1 as possibly arising within the wind of the RG666Note that Iijima (iijima (2008, 2009)) used a systemic velocity of 35.8 km s-1 for RS Oph. Adopting the value of Fekel et al. (fekel (2000)), the systemic velocity of the blended Na i component becomes 29 km s-1.. Our data, which have a spectral resolution almost a factor 5 higher, show that multiple components are present. As we have been arguing throughout this paper, this is strongly suggestive of a more complex configuration, in which the interaction between the recurrent outbursts and the RG wind plays a fundamental role in shaping the CSM. Although we cannot make a firm statement, it is possible that component #2, characterized by a systemic velocity of about 23 km s-1, is the signature of the RG wind. Another possibility is that it is the left-over of a previous outburst, similarly to what we proposed for component #1. At variance with components #1 and #3, #2 is still present in the K i profile after the outburst (see Fig. 6). This indicates that the gas responsible for this absorption is placed at a sufficiently large distance that its ionization balance is not too much affected by the eruption.
The presence of component #3 after the nova outburst can be explained by the resumption of the accretion, so that its re-appearance in our latest epoch is not inconsistent with it being formed within the circumbinary material (1014 cm). On the other hand, the presence of #1 and #2 at the same epoch is hard to explain if they arise too close to the WD. Since the nova shell reaches a radius of 1015 cm around one month after the eruption, they would have been swept away rather soon, had they been placed at shorter distances. This suggests that the absorbing material is placed at a sufficiently large radius that the ejecta are decelerated well before reaching it. In the light of these considerations, and given the persistence of the Ca ii H&K and Na i D lines during the outburst, the most probable cause for the variability of components #1 and #2 is photoionization.
If this is correct, then the recurrent outbursts do not destroy the slow-moving shells produced by the previous events, implying that systems like RS Oph are able to produce long-lasting structures in their circumstellar environment. Structures that survive long enough to show up during the most definitive and extreme event, when the WD is finally incinerated by the thermonuclear runaway.
7 Conclusions
Since the introduction of the mass-accreting WD scenario to explain Type Ia SN explosions (Whelan & Iben whelan (1973)), the exact nature of the progenitor system/s has been extensively debated (see Branch et al. branch (1995); Livio livio (2000); Parthasarathy et al. partha (2007); Tutukov & Fedorova tutukov (2007) for extensive reviews). Among the various possibilities, symbiotic systems have been proposed as a viable channel (Munari & Renzini munari92 (1992)). In particular, because of the mass of the WD hosted by RS Oph, which is close to the Chandrasekhar limit, this system has been proposed as a strong candidate (Hachisu & Kato hachisu00 (2000), hachisu01 (2001)). The detection of CSM material around SN 2006X and 2007le has strengthened this relation, showing the presence of multiple, high-density, low-velocity clumps of neutral material along the line of sight (Patat et al. patat (2007); Simon et al. simon (2009)).
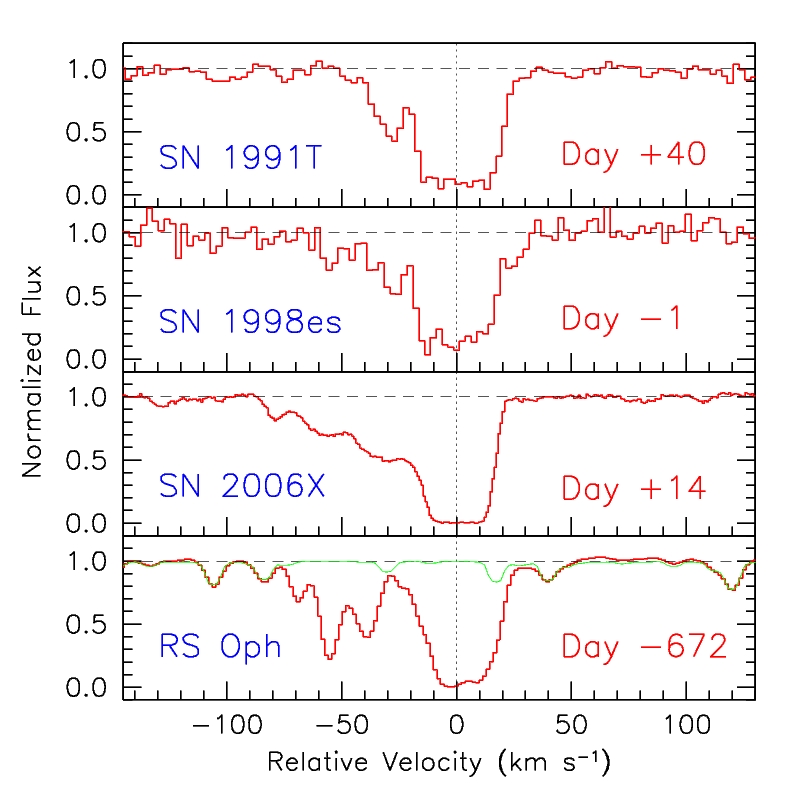
The analysis presented in this paper, stimulated by the findings reported by Iijima (iijima (2008, 2009)), leads us along the same lines. If the presence of narrow, blue-shifted absorptions at velocities where no interstellar component is expected is already an indication that the material in which they originate has been lost by the binary system, the time variability observed in coincidence with the eruption definitely testifies in favor of its circumstellar nature. In this scenario, the blue-shifted features would be explained as arising in material swept by previous outbursts, as suggested for SN 2006X (Patat et al. patat (2007)) following the mechanism proposed by Wood-Vasey & Sokoloski (wood-vasey (2006)), and hence buttressing the link between the progenitor system of that particular SN and RS Oph. In this respect, although based on a small number of objects, the resemblance of RS Oph to a few Type Ia SNe is quite impressive (Fig. 10).
Of course, many issues remain open, like the exact mechanism that produces the weakening of the absorption features, the location and origin of the gas where the blue-shifted components arise (inhomogeneities in the RG wind vs. relics of previous outbursts), and so on. But, as in the case of SNe, the study of strong absorption lines offers the unique possibility of investigating the presence of low amounts of neutral gas, which would never be detected through the typical signatures produced by direct interaction. Clearly, in the case of a Type Ia SN, for which ejecta velocities are much larger, the material generating component #3 would be swept during the first couple of days after the explosion, and hence it would be very hard (if not impossible) to observe the same line variations we have detected in RS Oph (see the discussion in Williams et al. williams (2008), and Borkowski, Blondin & Reynolds borkowski (2008) about the possible detection of narrow absorption features by means of very early, high-resolution spectroscopy of Type Ia. See also Hachisu, Kato & Nomoto hachisu08 (2008) for theoretical CSM scenarios in Type Ia progenitors).
This is why well time-sampled, high-resolution spectroscopy of recurrent nova systems is crucial for better painting the complex picture that is just emerging. The recent report by Sternberg et al. (sternberg (2011)) of an excess of blue-shifted Na i absorption features along the lines-of-sight to Type Ia supernovae might indeed find a physical background within this context.
Acknowledgements.
This paper is based on observations made with ESO Telescopes at La Silla Observatory under program IDs 073.D-0724(A), 076.D-0517(A) and 080.A-9207(A). F.P. acknowledges the kind hospitality of the Department of Astrophysics (Oxford), and the Lorentz Center (Leiden), where part of this work was conducted.References
- (1) Blondin, S., et al., 2009, ApJ, 693, 207
- (2) Bode, M.F., et al., 2006, ApJ, 652, 629
- (3) Bode, M.F. et al., 2007, ApJL, 665, 63
- (4) Bowen, D.V., Roth, K.C., Meyer, D.M. & Blades, J.C., 2000, ApJ, 536, 225
- (5) Borkowski, K.J., Blondin, J.M. & Reynolds, S.P., 2009, ApJ, 699, 64
- (6) Branch, D., Livio, M., Yungelson, L.R., Boffi & F., Baron, E., 1995, PASP, 107, 1019
- (7) Brandi, E., Quiroga, C., Mikolajewska, J., Ferrer, O. E., Garcìa, L. G., 2009, 497, 815
- (8) Bruch, A., 1986, A&A, 167, 91
- (9) Cassatella, A., Hassall, B.J.M., Harris, A. & Snijders, M.A.J., 1985, in Recent Results on Cataclysmic Variables, ed. W.R. Burke (Paris: ESO), p. 281
- (10) Chugai, N.N., 2008, Astronomy Letters, 34, 389
- (11) Crawford, I., 1992, MNRAS, 259, 47
- (12) Dobrzycka, D. & Kenyon, S.J., 1994, AJ, 108, 2259
- (13) Dobrzycka, D., Kenyon, S.J., Proga, D., Mikolajewska, J. & Wade. R.A., 1996, AJ, 111, 2090
- (14) Da Silva, L., et al., 2006, A&A, 458, 609
- (15) Fassia, A., Meikle, W.P.S., Chugai, N., Geballe, T.R., et al., 2001, MNRAS, 325, 907
- (16) Fekel, F.C., Joyce, R.R., Hinkle, K.H. & Strutskie, M.F., 2000, AJ, 119, 1375
- (17) Hachisu, I. & Kato, M., 2000, ApJ, 536, L93
- (18) Hachisu, I. & Kato, M., 2001, ApJ, 558, 323
- (19) Hachisu, I., Kato, M. & Nomoto, K., 2008, ApJ, 679, 1390
- (20) Hernanz, M. & José, J., New Astron. Rev., 2008, 52, 386
- (21) Hjellming, R.M., et al., 1986, ApJ, 305, L71
- (22) Iijima, T., 2008, in RS Oph, Keele Conference Proceedings, N. Evans, M. Bode & T. O’Brien eds., ASPC Series, Vol. 401, p.115
- (23) Iijima, T., 2009, A&A, 505, 287
- (24) Kaufer, A. et al., 1999, The Messenger, 95, 8
- (25) Kenyon, S.J., 1986, The Symbiotic Stars (Cambridge: University Press, Cambridge)
- (26) Kenyon, S.J., Mikolajewska, J., Mikolajevski, M., Polidan, R.S. & Slovak, M.H., 1993, AJ, 106, 1573
- (27) Kerr, F.J. & Westerhout, G., 1965, Galactic Structure, A. Blaauw & M. Schmidt eds., (Chicago: Univ. of Chicago Press), p. 167
- (28) Livio, M., 2000, Type Ia Supernovae: Theory and Cosmology, J.C. Niemeyer and J.W. Truran eds. (Cambridge: Cambridge Univ. Press), p.33
- (29) Mason, K.O., Cordova, F.A., Bode, M.F. & Barr, P., 1987, in RS OPhiuchi (1985) and the Recurrent Nova Phenomenon, Bode, M.F. ed., (VNU Science, Utrecht), 167
- (30) Mastrodemos, N. & Morris, M. 1999, ApJ, 523, 357
- (31) Mikolajewska, J. & Kenyon, S.J., 1992, AJ, 103, 579
- (32) Munari, U. & Renzini, A., 1992, ApJ, 397, L87
- (33) Mürset, U. & Schmid, H.M., 1999, A&AS, 137, 473
- (34) Narumi, H. et al., 2006, IAU Circ. 8671
- (35) Nomoto, K., & Kondo, Y. 1991, ApJ, 367, 19
- (36) O’Brien, T.J. et al., 2006, Nature, 442, 279
- (37) Parthasarathy, M., Branch, D., Jeffery, D.J. & Baron, E., 2007, New Astronomy Reviews, 51, 524
- (38) Patat, F., et al., 2007, Science, 317, 924
- (39) Patat, F., Cox, N. L. J., Parrent, J., & Branch, D., 2010, A&A, 514, 78
- (40) Seaquist, E.R. & Taylor, A.R., 1990, ApJ, 349, 313
- (41) Shore, S.N., Kenyon, S.J., Starrfield, S. & Sonneborn, G., 1996, ApJ, 456, 717
- (42) Simon, J.D., et al., 2009, ApJ, 702, 1157
- (43) Snijders, M.A.J., 1987, Ap&SS, 130, 243
- (44) Sokoloski, J.L., Luna, G.J.,M., Mukai, K., Kenyon, S.J., 2006, Nature, 442, 276
- (45) Sternberg, A., et al., 2011, BAAS, Vol. 43, 2011
- (46) Stritzinger, M., et al., 2010, AJ, 140, 2036
- (47) Tutukov, A.V. & Fedorova, A.V., 2007, Astronomy Reports, 51, 291
- (48) Walder, R., Folini, D., & Shore, S.N., 2008, A&A, 484, 9
- (49) Wallerstein, G., Harrison, T., Munari, U., & Vanture, A., 2008, PASP, 120, 492
- (50) Williams, R., Mason, E., Della Valle, M., Ederoclite, A., 2008, ApJ, 685, 451
- (51) Whelan, J. & Iben, I., 1973, ApJ, 186, 1007
- (52) Wood-Vasey,W.M. & Sokoloski, J.L., 2006, ApJ, 645, L53
- (53) Worters, H.L., Eyres, S.P.S., Bromage, G.E. & Osborne, J.P., 2007, MNRAS, 379, 1557
- (54) Yaron, O., Prialnik, D., Shara, M.M. & Kovetz, A., 2005, ApJ, 623, 398.
- (55) Zamanov, R.K., Bode, M.F., Tomov, N.A. & Porter, J.M., 2005, MNRAS, 363, L26