ALFALFA Hi Data Stacking
II.
Hi content of the host galaxies of AGN.
Abstract
We use a stacking technique to measure the average Hi content of a volume-limited sample of 1871 AGN host galaxies from a parent sample of galaxies selected from the SDSS and GALEX imaging surveys with stellar masses greater than and redshifts in the range . Hi data are available from the Arecibo Legacy Fast ALFA (ALFALFA) survey. In previous work, we found that the Hi gas fraction in galaxies correlates most strongly with the combination of optical/UV colour and stellar surface mass density. We therefore build a control sample of non-AGN matched to the AGN hosts in these two properties. We study trends in Hi gas mass fraction (MHI/M⋆, where M⋆ is the stellar mass) as a function of black hole accretion rate indicator L[Oiii]/MBH. We find no significant difference in Hi content between AGN and control samples at all values of black hole accretion rate probed by the galaxies in our sample. This indicates that AGN do not influence the large-scale gaseous properties of galaxies in the local Universe. We have studied the variation in Hi mass fraction with black hole accretion rate in the blue and red galaxy populations. In the blue population, the Hi gas fraction is independent of accretion rate, indicating that accretion is not sensitive to the properties of the interstellar medium of the galaxy on large scales. However, in the red population accretion rate and gas fraction do correlate. The measured gas fractions in this population are not too different from the ones expected from a stellar mass loss origin, implying that the fuel supply in the red AGN population could be a mixture of mass loss from stars and gas present in disks.
keywords:
galaxies: evolution – radio lines: galaxiesIntroduction
Observations have shown that most low redshift massive galaxies contain a black hole (BH) in their bulges (Kormendy, 2004) and that in some cases, the black hole may be actively accreting. The mass of the black hole is strongly coupled with the mass and velocity dispersion of the bulge of its host galaxy (Kormendy & Richstone, 1995; Magorrian et al., 1998; Gebhardt et al., 2000; Ferrarese & Merritt, 2000; Tremaine et al., 2002). Whether or not energy output by accreting black holes can influence the evolution and properties of their host galaxies is still a matter of debate. In some theoretical models of galaxy evolution, (radio) AGN are assumed to heat the external gas reservoir in massive dark matter halos (eg. Bower et al., 2006; Cattaneo et al., 2006; Croton et al., 2006; De Lucia & Blaizot, 2007; Somerville et al., 2008), thereby quenching the growth of the most massive galaxies. It is believed that this process may solve the over-cooling problem in simulated galaxy clusters (eg. Churazov et al., 2001; Reynolds et al., 2001; Quilis et al., 2001; Ruszkowski & Begelman, 2002; Sijacki & Springel, 2006; Teyssier et al., 2010). Another favored evolutionary scenario is that the energy output by the AGN actually drives gas out of the galaxy itself, depleting its interstellar medium, and shutting down star formation (e.g. Di Matteo et al., 2005; Hopkins et al., 2006).
Observationally, the situation is still very unclear. In nearby galaxies (e.g. Kauffmann et al., 2003a; Heckman et al., 2004; Schawinski et al., 2007) and galaxies at intermediate redshifts (e.g. Nandra et al., 2007; Silverman et al., 2008), the host galaxies of AGN are found to occupy the “green” part of the colour - magnitude diagram, i.e. their stellar populations are intermediate in age between the blue, actively star-forming spiral galaxies, and the gas-poor, quiescent early-type population. One interpretation of these results is that there is an evolutionary sequence driven by nuclear activity: i.e. AGN are triggered in galaxies on the blue sequence, gas in these systems is heated, and galaxies move onto the red sequence as star formation shuts down (Schawinski et al., 2009). However, this interpretation is certainly not unique. At a fixed black hole mass, AGN tend to be found preferentially in galaxies with younger stellar populations (and hence more gas). The presence of a gaseous fuel supply may simply be a necessary condition for both star formation and accretion onto the black hole (Kauffmann et al., 2003a; Kauffmann & Heckman, 2009). One way to ascertain whether AGN are responsible for terminating the growth of massive galaxies, is to establish a direct link between the presence of an active nucleus and the gas content of such galaxies.
There have only been a few systematic studies of the Hi content of the host galaxies of moderately large samples of AGN. Ho et al. (2008) conducted a survey of neutral gas in a representative sample of 154 moderate to high luminosity nearby Type I AGN. Their results appear to challenge the feedback scenario because AGN are found to be at least as gas rich as quiescent objects of the same morphological type. Hughes & Cortese (2009) carried out a study of Hi in a volume-limited sample of galaxies in different environments around the Virgo cluster, trying to disentangle between the effect of AGN and environment on star formation. In their sample, the incidence of AGN peaks in the “green valley”, but galaxies with quenched star formation are found to be mainly HI deficient galaxies located in high-density environments. No direct connection between AGN activity and quenching of star formation was observed, at odds with the previous cited studies.
In this paper we measure the average Hi content of a sample of 2000 AGN host galaxies, using the stacking technique developed in Fabello et al. (2010, hereafter Paper I). In Catinella et al. (2010) and Paper I we showed that the gas content of galaxies with stellar masses greater than is, to first order, most tightly correlated with optical/UV (NUV) colour and stellar surface mass density. We build control samples that are very closely matched to our AGN sample in the (NUV)/ plane, and we look for differences in Hi mass fraction MHI/M⋆ between AGN and control galaxies. In section 1 we describe the sample selection and the data we use; in section 2 we compare in bins of nuclear properties the gas content of AGN and inactive counterparts.
1 Samples
Our targets are drawn from the volume-limited, homogeneous sample A defined in Paper I. To summarize, this sample consists of 4726 galaxies with stellar masses greater than and redshifts in the range selected from the SDSS main spectroscopic sample and the projected GALEX Medium Imaging Survey (MIS; Martin et al., 2005). HI data are available from the Arecibo Legacy Fast ALFA Survey (ALFALFA; Giovanelli et al., 2005). Among our targets, 23% have been detected by ALFALFA. We refer the reader to Paper I for further details on the sample selection and for a description of the stacking method used to evaluate average Hi gas fractions.
From this main sample, we extract a sample of AGN (1.2), and a control sample of galaxies where there is no evidence of accretion onto the central black hole (1.3). In the next section, we introduce the parameters we use for both the analysis and the sample selection.
1.1 Galaxy Parameters
The optical/UV parameters we use are derived from SDSS spectrum measurements111See http://www.mpa-garching.mpg.de/SDSS/DR7/ and http://cas.sdss.org./dr7/en/tools/search/sql.asp and reprocessed GALEX UV photometry (Wang et al., 2010, Paper I). From there we use: the NUV colour measured for the whole galaxy (corrected for Galactic extinction only); the stellar mass surface density =M⋆/,where is the Petrosian radius containing 50% of the flux in -band in units of kpc; the central velocity dispersion . In addition we use the 4000Å break measured from the SDSS 3 arcsec-diameter fiber spectrum, . As discussed in Kauffmann et al. (2003b), can serve as a measure of the age of the stellar population of galaxies, although there is a secondary dependence on metallicity. The galaxies in our sample are located at low redshifts (), and in 72% of our sample the 3 arcsec fiber covers less than 20% of the Petrosian radius enclosing 90% of the total light of the galaxy. The 4000Å break values should thus be regarded as a measure of stellar population age for the inner nuclear regions of the galaxies, while the NUV colour is a proxy for the specific star formation rate SFR (sSFR, i.e. SFR per unit stellar mass).
Finally, we extract the following emission fluxes: , , [Nii], [Oiii] (in units of ergs-1cm-2), which we use to classify the nuclear activity of our galaxies by means of the diagnostic diagram first defined by Baldwin et al. (1981, hereafter BPT). Because the fiber covers the inner region of the galaxy, the AGN properties should not be significantly contaminated by outer star forming regions (see Kewley et al., 2006).
As discussed in Kauffmann et al. (2003a), the luminosity of the [Oiii]5007 line should be a reasonably reliable tracer of black hole accretion rate. Because it is a high excitation line, it is less contaminated by emission from Hii regions than other lines such as . We correct our line fluxes for dust extinction using the Balmer decrement, following eq. (3) in Wild et al. (2007), and then convert the [Oiii] fluxes into luminosities.
Finally, we evaluate an Eddington ratio for the AGN, defined as:
where is the bolometric luminosity, and the central black hole mass. The Eddington luminosity scales with , which we estimate using the stellar velocity dispersion measured from the fiber spectrum: . scales with L[Oiii] (see Heckman et al., 2004), so to first order the ratio L[Oiii]/ can be used as a proxy for the accretion rate. For a precise estimate of the Eddington parameter we refer the reader to Heckman et al. (2004) and Kauffmann & Heckman (2009).
1.2 The AGN sample
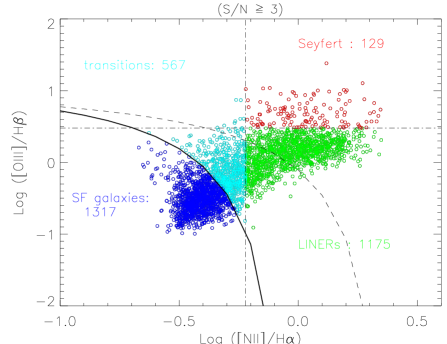
We extract a sample of AGN from sample A using the BPT diagnostic diagram, which allows to distinguish Type 2 AGN from star-forming galaxies. We consider the ratio [Oiii]/ versus [Nii]/ for all galaxies with signal-to-noise ratio S/N3 in all four line measurements. Following Kauffmann et al. (2003a), AGN are defined as those galaxies with
We obtain a sample of 1871 active galaxies, which can be further subdivided into Seyferts, LINERs (which make up the bulk of our sample) or “transition” as indicated in Figure 1.
We note that Kewley et al. (2001) suggested a more stringent cut to separate galaxies where the nuclear emission is almost completely excited by emission from the gas accreting onto the black holes, rather than from star-forming regions (shown as a dashed line in Figure 1). With this cut, we obtain a subsample of 912 “pure” AGN, which is too small for our stacking analysis. This is why we only consider the demarcation line suggested by Kauffmann et al. (2003a) in this paper.
1.3 The control sample
 |
 |
Our control sample is drawn from a combined sample of “inactive” galaxies
and star-forming systems.
Inactive galaxies are those where the S/N of the [Oiii] line is less than
3. We exclude 474 galaxies where the S/N of the [Oiii] line is
greater but other lines lie below this S/N threshold, because these galaxies
cannot be accurately classified. By applying a cut in the [Oiii] line
only, our control sample may be contaminated by weak LINERs. The
contamination is anyway negligible. For our targets, less than 5% of the galaxies with
S/N([Oiii])3 have (vertical dash dotted line in Figure 1).
Inactive galaxies, together with galaxies classified as
star-forming on the BPT diagram, constitute our pool of
2377 galaxies for which the nuclear emission is not
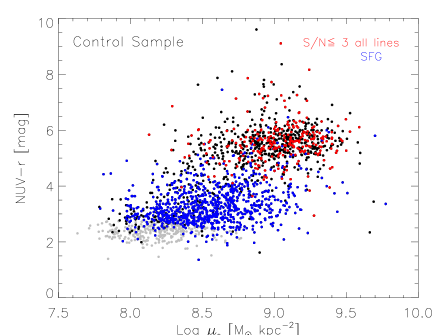
dominated by an AGN. The colour- plane for those
galaxies is shown in the bottom panel of Figure
2, all points. Two distinct populations are clear in this diagram:
a red sequence of galaxies with weak or absent emission
lines, and a blue cloud consisting of star-forming
galaxies which extends until lower with respect to the active
sample.
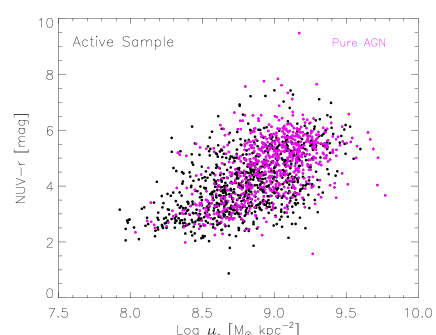
We stack AGN in bins of the accretion rate proxy L[Oiii]/. For each bin, we want to compare the average Hi mass fraction with that obtained for control galaxies matched in stellar mass surface density and NUV colour. For each AGN we then select a galaxy from the control pool by searching for its closest neighbor in the plane defined by NUV and . We match objects in order of decreasing , and we do not allow a galaxy to enter the control sample more than once. We do not have enough galaxies to build larger control samples, but with this method we are able to reproduce the original and NUV distributions of the AGN sample. The gray dots in Figure 2 (bottom panel) are the objects discarded because they do not match any AGN. The black and coloured points show the final control sample. In particular, blue dots are star forming galaxies, while galaxies for which none of the four emission lines , , [Oiii] and [Nii] are detected with are overplotted as red dots.
2 The HI gas fractions of AGN hosts
 |
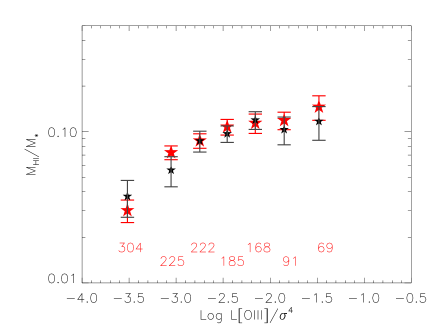 |
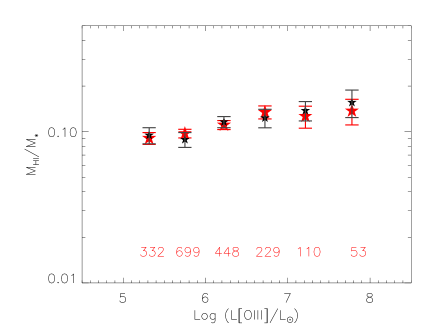
We have stacked our AGN sample in bins of [Oiii] line luminosity and in bins of the black hole accretion rate proxy L[Oiii]/. In Figure 3, we plot the average gas fraction MHI/M⋆ as a function of both parameters for both the AGN sample (red) and for the control galaxies (black). Errors are evaluated using the bootstrap method for a total of 200 repetitions: every time we discard 20% of the sample and evaluate a new gas fraction; the error is the dispersion on the repeated measures.
As can be seen, the average Hi mass fraction increases weakly as a function of [Oiii], from about 9% for the weakest AGN to 14% for the most luminous systems. This nearly flat trend reflects the fact that AGN of different [Oiii] luminosities are located in roughly the same region of the -(NUV) plane. The dependence of Hi mass fraction on black hole accretion rate is considerably stronger. Objects with the lowest measurable accretion rates are very gas poor (MHI/M⋆3%), and the average gas fraction increases as a function of L[Oiii]/ up to a maximum value of 14%. We likewise find that galaxies with higher black hole accretion rates tend to be bluer and have lower values of . We note that the trend in Hi mass fraction as a function of black hole accretion rate is considerably weaker than as a function of the optical/UV colour of the host galaxy. In Paper I, we found that the average Hi mass fractions change from 55% for the bluest objects to 2% for the reddest ones.
 |
 |
The next step is to assess whether AGN differ from control galaxies in terms of mean Hi gas mass fraction. Results for the control sample are plotted as black stars in Figure 3, at the x-axis value of the corresponding AGN bin. Errors are evaluated as explained previously. As can be seen, there is no difference between the neutral gas content for the two samples.
Kauffmann & Heckman (2009) showed that there appear to be two distinct regimes of black hole growth in galaxies in the local Universe. The first is associated with galaxies with significant ongoing star formation; in this regime the distribution of accretion rates shows little dependence on the central stellar population of the galaxy. The second regime is associated with “passive” galaxies, and is characterized by a power-law distribution of accretion rates. There, the accretion rate does depend strongly on the age of the central stellar population in the galaxy.
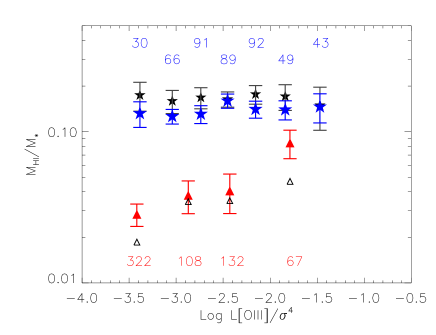
We now take a look at Hi gas mass fraction trends for blue and red galaxy sub-populations. We define red sequence galaxies to have NUV4.5, and blue sequence galaxies to have NUV4.5. This cut is based on the split in the bimodal colour distribution of the control sample, visible also in Figure 2 (lower panel). Results are shown in Figure 4 (left panel): blue stars are blue cloud AGN, black stars are the corresponding control galaxies; red triangles represent the red sequence AGN, while black triangles are used for control galaxies. Symbols are empty when the measure is a non-detection (upper limit). The average Hi gas fraction remains constant as a function of the accretion rate parameter L[Oiii]/ for the blue population. The increase in Hi gas fraction as a function of L[Oiii]/ seen in Figure 3 is in fact driven by galaxies on the red sequence. We note that we had to increase the bin size for these objects in order to recover sufficient signal in our stacks. Our control samples of red and blue galaxies exhibit the same trends with L[Oiii]/ as the AGN, but the gas mass fractions are slightly higher for the blue control objects, and lower for the red control objects. (In fact, we do not detect Hi in any of the red control galaxy stacks).
The NUV colours we use are not corrected for dust extinction. It is conceivable that AGN may be found in galaxies with more dust than average, so we should ascertain whether using uncorrected colours to create matched control samples will bias our results. Reliable estimates of the specific star formation rates of our galaxies may be obtained by fitting spectral energy distribution models to the 7-band UV and SDSS data, and calibrating the attenuation as function of NUV colour using a reference sample with direct measurements of the UV through far-IR spectral energy distribution from a combination of GALEX, SDSS and Spitzer data. Our methodology is explained in detail in Saintonge et al. (2011, MNRAS, submitted).
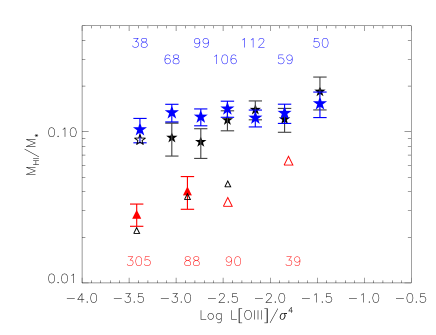
We repeat our stacking exercise, this time matching AGN hosts to control galaxies using and specific star formation rate rather than and NUV-r colour. The new results are shown in the right panel of Figure 4. Red symbols denote objects with low specific star formation rates (SFR/M⋆-11.0), while blue symbols are for more strongly star-forming galaxies (SFR/M⋆-11.0). Once again, this division has been made based on the bimodal distribution of sSFR in our sample. We see the same trends as before, with no significant difference in HI content between the blue AGN hosts and control galaxies. The same conclusion holds for red AGN hosts, although we note that the two highest accretion rate bins yield non-detections. This is because many of these galaxies shift over to the blue sequence after dust corrections are made.
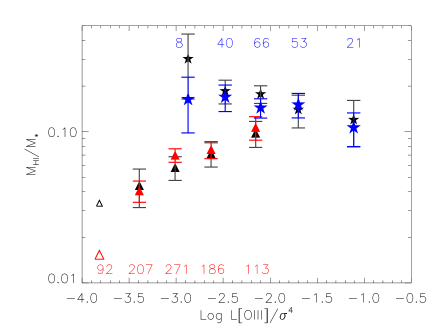
We note that the amount of accretion onto the central supermassive black hole in a galaxy is more likely to be sensitive to the properties of the interstellar medium in the central parts of the galaxy rather then globally. We now investigate what happens if we split our AGN sample into “red” and “blue” subsamples using , which is measured within the 3 arcsec diameter SDSS fiber aperture, and remeasure gas fractions for these two new samples, plus corresponding control galaxies. In this case, blue galaxies have 1.6 and red galaxies have 1.7 (this roughly separates the peaks of the bimodal distribution of 4000Å break strengths). In Figure 5 we show our results. AGN hosts exhibit no significant differences in their gas content with respect to non-AGN in the same range matched by global colour and . Also the differences in the red population seen in Figure 4 has now vanished, given that now we detect the same signal for both AGN and control galaxies. We note that the two bins of clearly separate in terms of the trend in gas fraction as a function of the Eddington parameter L[Oiii]/, consistent with the suggestion of Kauffmann & Heckman (2009) that accretion onto the black hole is supply-limited in the red galaxy population, but not in the blue one.
3 Summary & Discussion
We have used the stacking technique developed in a companion paper (Paper I) to look at possible interplay between nuclear activity and gas content in massive nearby galaxies. Starting from a volume-limited, homogeneous sample of massive galaxies we have selected a sample of AGN, and a control sample of inactive galaxies matched by and NUV. We then stacked their Hi data in bins of [Oiii] line luminosity scaled by black hole mass to assess whether the gas content of AGN hosts differs from that of the control galaxies.
Our main result is that we
do not find any significant difference between the Hi gas
content of AGN hosts and that of control galaxies. This conclusion holds at all
values of the Eddington parameter proxy L[Oiii]/ probed by the
galaxies in our sample.
If converted into a proper Eddington ratio, our sample would
cover the range -4 to -2. We are studying the
relatively low accretion rate regime, and that could be a reason why we do not
see any sign of AGN feedback. We would need data over a larger
volume to stack a significant number of AGN with very high
L/LEdd. Still, up to the highest accretion rates we have studied,
the gas fraction shows no hint of correlation with either
L[Oiii]/ (blue population) or AGN presence.
These results are also in agreement with Ho et al. (2008). As discussed in their paper, the lack of any difference may be due to the fact that the Hi traces gas on very large scales, but accreting black holes only heat gas close to the centers of the galaxies.
In some simulations of galaxy formation, AGN feedback is an extremely violent process that can drive out much of the interstellar medium from galaxies, truncating ongoing star formation and reddening their stellar populations (Di Matteo et al., 2005). In this scenario, AGN hosts would be expected to be gas deficient. Catastrophic global feedback processes are clearly not occurring in the majority of AGN in the local Universe. We cannot yet ascertain that AGN feedback is important in the centers of galaxies. In future work, we plan to examine trends in molecular gas fractions in AGN hosts using data from the COLD GASS survey (Saintonge et al 2011). The molecular gas is generally more centrally concentrated that the atomic gas and may be more sensitive to feedback processes occurring in the bulge of the galaxy.
Another interesting result of our analysis is the scaling of the mean Hi gas fraction of AGN host galaxies with accretion rate onto the black hole, as traced by L[Oiii]/. In the blue galaxy population, the accretion rate onto the black hole and the Hi gas fraction of the galaxy are independent. However, in the red galaxy population, these two quantities do track each other. Kauffmann & Heckman (2009) hypothesized that in blue galaxies, the black hole regulates its own growth at a rate that does not further depend on the properties of the interstellar medium. In red galaxies, they deduced that the decrease in the accretion rate onto black holes in old galaxies was consistent with population synthesis model predictions of the decline in stellar mass loss rates as a function of mean stellar age.
Because we now have measured Hi mass fractions for the red population, we can check this in more detail. The average global (NUV)/() colours of the host galaxies vary from 4.56/0.74 for the stack with the highest accretion rate in Figure 5 to 5.54/0.80 for the stack with the lowest accretion rate. As described in Kauffmann & Heckman (2009) we use population synthesis models (e.g., Bruzual & Charlot, 2003; Maraston, 2005) to calculate mass loss rates as a function of colour, assuming simple exponential declining star formation histories for our galaxies. If the Hi content of red sequence AGN came only from mass loss, we would expect a 0.3 dex change in the average (MHI/M⋆) between AGN stacks with the lowest and highest accretion rates in our sample. Figure 5 shows a 0.5 dex change in this quantity, which is somewhat larger than predicted. However, we note that the average stellar surface mass densities of the host galaxies in the stacks decrease by a factor of 3 between AGN with the highest and lowest accretion rates (likewise the concentration index decreases from 3.15 to 2.79), so structural properties are not constant across the population. This may imply that the fuel supply in the red AGN population is in fact a mixture of mass loss from stars and gas present in disks.
Acknowledgments
We thank the many members of the ALFALFA team who have contributed to the acquisition and processing of the ALFALFA dataset over the last six years.
RG and MPH are supported by NSF grant AST-0607007 and by a grant from the Brinson Foundation.
The Arecibo Observatory is part of the National Astronomy and Ionosphere Center, which is operated by Cornell University under a cooperative agreement with the National Science Foundation.
GALEX is a NASA Small Explorer, launched in 2003 April. We gratefully acknowledge NASA’s support for construction, operation and science analysis for the GALEX mission, developed in cooperation with the Centre National d’Etudes Spatiales (CNES) of France and the Korean Ministry of Science and Technology.
Funding for the SDSS and SDSS-II has been provided by the Alfred P. Sloan Foundation, the Participating Institutions, the National Science Foundation, the U.S. Department of Energy, the National Aeronautics and Space Administration, the Japanese Monbukagakusho, the Max Planck Society and the Higher Education Funding Council for England. The SDSS web site is http://www.sdss.org/.
The SDSS is managed by the Astrophysical Research Consortium for the Participating Institutions. The Participating Institutions are the American Museum of Natural History, Astrophysical Institute Potsdam, University of Basel, University of Cambridge, Case Western Reserve University, University of Chicago, Drexel University, Fermilab, the Institute for Advanced Study, the Japan Participation Group, Johns Hopkins University, the Joint Institute for Nuclear Astrophysics, the Kavli Institute for Particle Astrophysics and Cosmology, the Korean Scientist Group, the Chinese Academy of Sciences (LAMOST), Los Alamos National Laboratory, the Max-Planck-Institute for Astronomy (MPIA), the Max-Planck-Institute for Astrophysics (MPA), New Mexico State University, Ohio State University, University of Pittsburgh, University of Portsmouth, Princeton University, the United States Naval Observatory and the University of Washington.
References
- Baldwin et al. (1981) Baldwin J. A., Phillips, M. M., Terlevich R., 1981, PASP, 93, 5
- Bower et al. (2006) Bower R. G., Benson A. J., Malbon R., Helly J. C., Frenk C. S., Baugh C. M., Cole S., Lacey C. G., 2006, MNRAS, 370, 645
- Bruzual & Charlot (2003) Bruzual, G., & Charlot, S., 2003, MNRAS, 344, 1000
- Catinella et al. (2010) Catinella B. et al., 2010, MNRAS, 403, 683
- Cattaneo et al. (2006) Cattaneo A., Dekel A., Devriendt J., Guiderdoni B., Blaizot J., 2006, MNRAS, 370, 1651
- Churazov et al. (2001) Churazov E., Brüggen M., Kaiser C. R., Böhringer H., Forman W., 2001, ApJ, 554, 261
- Croton et al. (2006) Croton D. J. et al., 2006, MNRAS, 365, 11
- De Lucia & Blaizot (2007) De Lucia G., Blaizot J., 2007, MNRAS, 375, 2
- Di Matteo et al. (2005) Di Matteo T., Springel V., Hernquist L., 2005, Nature, 433, 604
- Fabello et al. (2010) Fabello S., Catinella B., Giovanelli R., Kauffmann G., Haynes M. P., Heckman T. M., Schiminovich D., 2010, MNRAS 411, 993 (Paper I)
- Ferrarese & Merritt (2000) Ferrarese L., Merritt D., 2000, ApJL, 539, L9
- Gebhardt et al. (2000) Gebhardt K. et al., 2000, ApJL, 543, L5
- Giovanelli et al. (2005) Giovanelli R. et al., 2005, AJ, 130, 2598
- Heckman et al. (2004) Heckman T. M., Kauffmann G., Brinchmann J., Charlot S., Tremonti C., White S. D. M., 2004, ApJ, 613, 109
- Ho et al. (2008) Ho L. C., Darling J., Greene J. E., 2008, ApJ, 681,128
- Hopkins et al. (2006) Hopkins P. F., Hernquist L., Cox T. J., Di Matteo T., Robertson B., Springel V., 2006, ApJS, 163, 1
- Hughes & Cortese (2009) Hughes T. M., Cortese L., 2009, MNRAS, 396, L41
- Kauffmann et al. (2003a) Kauffmann G. et al., 2003a, MNRAS, 346, 1055
- Kauffmann et al. (2003b) Kauffmann G. et al., 2003b, MNRAS, 341, 54
- Kauffmann & Heckman (2009) Kauffmann G., Heckman T. M., 2009, MNRAS, 397, 135
- Kewley et al. (2001) Kewley L. J., Dopita M. A., Sutherland R. S., Heisler C. A., Trevena J., 2001, ApJ, 556, 121
- Kewley et al. (2006) Kewley L. J., Groves B., Kauffmann G., Heckman T., 2006, MNRAS, 372, 961
- Kormendy & Richstone (1995) Kormendy J., Richstone D., 1995, ARAA, 33, 581
- Kormendy (2004) Kormendy J., 2004, Coevolution of Black Holes and Galaxies, 1
- Magorrian et al. (1998) Magorrian J. et al., 1998, AJ, 115, 2285
- Maraston (2005) Maraston, C., 2005, MNRAS, 362, 799
- Martin et al. (2005) Martin D. C. et al., 2005, ApJ, 619, L1
- Nandra et al. (2007) Nandra K. et al., 2007, ApJL, 660, L11
- Quilis et al. (2001) Quilis V., Bower R. G., Balogh M. L., 2001, MNRAS, 328, 1091
- Reynolds et al. (2001) Reynolds C. S., Heinz S., Begelman M. C., 2001, ApJL, 549, L179
- Ruszkowski & Begelman (2002) Ruszkowski M., Begelman M. C., 2002, ApJ, 581, 223
- Saintonge et al. (2011) Saintonge A. et al., 2011, MNRAS, in press
- Schawinski et al. (2007) Schawinski K., Thomas D., Sarzi M., Maraston C., Kaviraj S., Joo S.-J., Yi S. K., Silk J., 2007, MNRAS, 382, 1415
- Schawinski et al. (2009) Schawinski K., Virani S., Simmons B., Urry C. M., Treister E., Kaviraj S., Kushkuley B., 2009, ApJL, 692, L19
- Schiminovich et al. (2010) Schiminovich D. et al., 2010, MNRAS, 408, 919
- Sijacki & Springel (2006) Sijacki D., Springel V., 2006, MNRAS, 366, 397
- Silverman et al. (2008) Silverman J. D. et al., 2008, ApJ, 675, 1025
- Somerville et al. (2008) Somerville R. S., Hopkins P. F., Cox T. J., Robertson B. E., Hernquist L., 2008, MNRAS, 391, 481
- Teyssier et al. (2010) Teyssier R., Moore B., Martizzi D., Dubois Y., Mayer L., 2010, arXiv:1003.4744
- Tremaine et al. (2002) Tremaine S. et al., 2002, ApJ, 574, 740
- Wang et al. (2010) Wang, J., Overzier, R., Kauffmann, G., von der Linden, A., & Kong, X. 2010, MNRAS, 401, 433
- Wild et al. (2007) Wild V., Kauffmann G., Heckman T., Charlot S., Lemson G., Brinchmann J., Reichard T., Pasquali A., 2007, MNRAS, 381, 543