IISER/HEP/04/11
SUSY signals with small and large trilinear couplings at the LHC 7 TeV runs
and neutralino dark matter
Nabanita Bhattacharyya111nabanita@iiserkol.ac.in,
Arghya Choudhury222arghyac@iiserkol.ac.in and
Amitava Datta333adatta@iiserkol.ac.in
Indian Institute of Science Education and Research, Kolkata,
Mohanpur Campus, PO: BCKV Campus Main Office,
Mohanpur - 741252, Nadia, West Bengal.
Abstract
We propose the signal along with appropriate selection criteria for the LHC 7 TeV run, where the number of jets is or 4. These signals can complement the canonical + signature since they are sensitive to the trilinear soft breaking parameter and low values of the parameter tan in the minimal supergravity (mSUGRA) model. A large region of this mSUGRA parameter space within the reach of the ongoing experiments at the LHC is disfavoured by the bound on the lightest Higgs boson mass ( GeV) unless has moderate to large negative values. Interestingly part of this parameter space with is also consistent with the observed dark matter relic density. A natural consequence of large is the existence of a light top squark (). The proposed signals primarily stem from direct production and/or , if all squark-gluino events are considered. A thorough analysis of the signals and the corresponding backgrounds are presented using the event generator Pythia. We finally compare the signal size for and .
PACS no:12.60.Jv, 95.35.+d, 13.85.-t, 04.65.+e
1 Introduction
The attention of the high energy physics community has been focussed on the prospects of new physics search at the CERN Large Hadron Collider (LHC) [1]. Supersymmetry (SUSY) [2] is perhaps the most well-motivated extension of the standard model (SM) which will be extensively scrutinized under the LHC microscope.
It is gratifying to note that the proton - proton collisions with stable beams became operational in 2010 at an energy ( = 7 TeV) never attained by any accelerator before. Moreover, the performance of the machine in the luminosity front during 2010 surpassed all expectations. As a result it now expected that the operations will continue till the end of 2012 at = 7 TeV and the total luminosity collected is expected to be even of the order of 5 . This is indeed an exciting news for the new particle search programme.
In some recent analyses [3, 4] the prospect of SUSY search at TeV have been studied. It has already been shown by both ATLAS [5] and CMS [6] collaborations that even with 1 the minimal supergravity (mSUGRA) model [7] can be probed in the + missing energy () channel much beyond the reach of similar searches at the Tevatron [8]. Nevertheless the reach at 7 TeV will be restricted to relatively low values of and .
Both the above analyses as well as many existing parameter space scans were carried out for a specific choice of the trilinear soft breaking term: . However, it must be admitted that there is no compelling reason for the above choice. The mSUGRA parameter space with should be probed with equal emphasis after taking into account the constraints from the charge color breaking (CCB) minima [9]. Unfortunately + signal - the main channel for SUSY search is rather insensitive to .
In this paper we wish to focus on the characteristic signatures of the mSUGRA model sensitive to non vanishing trilinear couplings (). This will complement the + signature and provide handles on hitherto unexplored regions of the parameter space. There are several motivations for extending the analyses to this case.
-
•
It is well known [10] that a significant fraction of the low region of the mSUGRA parameter space sensitive to the LHC 7 TeV run with relatively low luminosities is disfavoured by the bound GeV, where is the mass of the lighter scalar Higgs boson, obtained from LEP [11]. This is especially so if the mSUGRA parameter tan (to be defined below) is low. In contrast the small region indeed opens up even for low tan for moderate to large negative values of [12] which yields larger radiative corrections to enhance the predicted . This point will be taken up in further details in the next section.444The whole parameter space accessible to the 7 TeV run can be made consistent with the bound for = 0, if the mSUGRA model is extended, e.g., to contain four sequential generations of fermions and sfermions. Due to additional radiative corrections to from the fourth generation the theoretical prediction significantly increases [13].
-
•
From the point of view of SUSY dark matter (DM) [14], the zone of the parameter space thus revived is interesting [12] since in this zone neutralino annihilation (bulk annihilation) and/or neutralino-stau co-annihilation can explain the observed DM relic density of the universe as given by WMAP data [15]. In contrast for , the parameter space compatible with the bound and DM data is restricted for .
-
•
For small and the signals involving isolated electrons and muons are sensitive to low values of tan. For larger values, the mixing in the stau sector increases leading to a mass eigenstate () much lighter than the other sleptons. is especially true in the low region of the parameter space. As a result the electroweak gauginos decay dominantly into and final states involving isolated e and/or are suppressed. It may be recalled that the D collaboration has obtained the best limit on the chargino-neutralino sector via the clean trilepton channel [16] for low tan (= 3). However, they have also taken . As a results the entire parameter space sensitive to their search is strongly disfavoured by the bound from LEP.
The phenomenology of models with non-zero was discussed in details in [12] and subsequently in [4, 17] for both LHC 7 TeV and 14 TeV runs.The emphasis of our work is on SUSY signals at LHC 7 TeV, which are sensitive to and low values of tan. We shall also compare and contrast them with the corresponding signals for . A natural consequence of large negative is the existence of a lighter top squark mass eigenstate (). It will therefore be important to look for the footprints of this squark in the LHC 7 TeV data in addition to the canonical channel. The lighter top squark () can be copiously produced in two ways:
-
•
Through direct pair production. This signal could be important, e.g. , for reconstructing the top squarks mass using standard techniques.
-
•
Through all possible squark-gluino pair (, and ) production followed by the decay .
The above gluino decay has a large branching ratio (BR) over a large parameter space even if the is heavier than all squarks, since could be much lighter than the other squarks as a consequence of large . For small tan the bottom squarks will be almost as heavy as the other squarks. Another source of is the decay where the initial ’s are obtained in the final states either from gluino decays () or direct pair production.
We shall look into the following issues:
-
•
The search prospect of the signal from direct production if all other strongly interacting sparticles are beyond the reach of the 7 TeV run for low integrated luminosities. We shall propose a signal sensitive to moderate to large values of and low tan.
-
•
We next consider all squark-gluino pair production in mSUGRA including production. If the total signal stands over the background, we shall look into the possibility of separating the events due to pure stop pair production from the squark-gluino events. by introducing additional cuts. If the purity of the stop sample thus obtained, is reasonable, one can possibly use the standard techniques of sparticle mass measurement [18] to study the properties of the stop.
-
•
Finally in order to exploit the large missing energy in a typical SUSY signal, we shall consider typical squark-gluino events subject to stronger cuts designed to eliminate the SM background. However, for reasons discussed above, even this signal will be rich in events containing one or more . We shall also compare this signal with the corresponding one for . However filtering out sample with a small contamination from squark-gluino events may not be feasible in this case .
The plan of the paper is as follows. In Section 2 we motivate a promising signature sensitive to the magnitude of and small tan, where and stands for the number of jets, by introducing a set of benchmark points. In Section 3 we present a thorough analysis of the signal for 2 or 4 and the corresponding SM backgrounds by using the event generator Pythia (version 6.409) [19] and other supporting computational tools. Our conclusions and future outlooks are summarized in Section 4.
2 The Benchmark Scenarios
As discussed in the last section a possible way of identifying the regions of the mSUGRA parameter space with moderate to large negative values of the parameter is to look for the remnants of the lighter top squark in the LHC data. This of course depends on the decay mode of .
If happens to be the next to the lightest superparticle (NLSP) its dominant decay modes will be [20] and [21]. The latter is particularly important at low tan. From the simulations at Tevatron energies it seems that the final states do not contain very hard particles while the missing energy [22] is relatively low . Consequently,the signals will be rather difficult to detect. The competition between the two modes further adds to this difficulty. We have checked that this is more or less true even at the LHC 7 TeV run.
Moreover, NLSP is not very common in mSUGRA. We shall not pursue this difficult search channel in this paper. A new channel for stop NLSP search has been proposed recently [23].
If is heavier than the lighter chargino () , the mode and its charge conjugate process will be the main decay mode for the 7 TeV run. However, this mode may compete with the decay for some regions of the parameter space corresponding to relatively heavy . We shall include both the competing modes in our analysis.
If there is no sfermion lighter than the chargino (i.e., in the chargino NLSP scenario), the latter decays into final states and , where the fermion pair may come either from a real or virtual (two body and three body decays). Sometimes the BRs of the leptonic three body decays of the chargino may be enhanced relative to the corresponding W decay BRs due to additional contributions from virtual slepton exchanges. This happens if there are relatively light sleptons in the spectrum. For small tan the BR of these decays involving the ’s will be roughly the same as that for and channels. Some of the benchmark scenarios illustrate these points.
There are two interesting signatures from the decay cascades sketched above which are initiated by the decays: and , where j stands for any number of jets. But the dilepton channel will be twice suppressed by the small leptonic BR. We have, therefore, looked for the ( or ) +jet(tagged) + (including untagged b jets) signal.
The may also decay directly into the two body mode with large BR. This, however, is more probable for moderate and large values of tan and relatively low and , where can be naturally light. For establishing this signal tagging of the jets is required. In this paper we restrict ourselves to low tan and the above signal has not been considered. But some benchmark points indicate that this decay may occur with large BR even for low tan. We have checked that the proposed signal is viable inspite of this. The importance of the signal involving jets has been highlighted elsewhere in the context of the 14 TeV run [12, 17]. A similar analysis for the ongoing run is in progress.
The minimal supersymmetric extension of the standard model (MSSM) has too many free parameters due to unknown soft supersymmetry breaking terms. In this paper most of the analyses have been done within the simplest gravity mediated SUSY breaking model - mSUGRA [7] model 555The sub-section 3.1 is an exception. - which has only five free parameters including soft SUSY breaking terms. These are (the common scalar mass), (the common gaugino mass), (the common trilinear coupling parameter), all given at the gauge coupling unification scale ( GeV); the ratio of Higgs vacuum expectation values at the electroweak scale namely tan and the sign of . The magnitude of is determined by the radiative electroweak symmetry breaking (REWSB) condition [24]. The low energy sparticle spectra and couplings at the electroweak scale are generated by renormalization group evolutions (RGE) of the soft breaking masses and the coupling parameters.
Keeping the above features of the signal in mind we have chosen several benchmark point (BP)s in the mSUGRA parameter space. We have considered low, moderate and large values of the parameters and within the reach of LHC 7 TeV run with 1 of data as indicated by references [5, 6]. However, we have considered large to moderate negative values of the trilinear coupling , which yield a relatively light top squark and consistency with the bound from LEP. We have fixed tan at 5 and have taken the sign of to be positive. In the following all parameters having dimensions of mass are in GeV unless stated otherwise explicitly. For all the benchmark points is a bino whereas and are winos with masses approximately equal to . The pole masses of the top and the bottom quarks are taken to be 175 666We have made this choice to be consistency with [12] as we have taken the WMAP allowed regions from this analysis. Admittedly this choice is slightly higher than the central value given by PDG(2010): . However, our choice is well within the 2 limit of the central value which is acceptable. We have checked that there is no major modification in our numerical results due to this. and 4.25 respectively. The mSUGRA parameters for the benchmark scenarios have been listed in Table 1. The sparticle spectra for the above scenarios are contained in Table 2 and Table 3. They have been generated by SUSPECT (version.2.3) [25].
| Benchmark | Parameters | ||
|---|---|---|---|
| Points | - | ||
| BP1 | 130 | 195 | 600 |
| BP2 | 150 | 195 | 650 |
| BP3 | 350 | 195 | 650 |
| BP4 | 450 | 195 | 900 |
| BP5 | 115 | 195 | 600 |
| BP6 | 115 | 235 | 600 |
| BP7 | 115 | 285 | 600 |
| BP8 | 150 | 179 | 600 |
| BP9 | 150 | 215 | 600 |
| BP10 | 290 | 205 | 600 |
| BP11 | 290 | 235 | 600 |
| BP12 | 290 | 285 | 600 |
| BP13 | 490 | 235 | 600 |
| BP14 | 490 | 275 | 600 |
| Squark/ | |||||||
|---|---|---|---|---|---|---|---|
| Slepton/Gluino/ | BP1 | BP2 | BP3 | BP4 | BP5 | BP6 | BP7 |
| Gaugino masses | |||||||
| 485.8 | 487.3 | 500.2 | 507.4 | 484.9 | 574.2 | 685.4 | |
| 461.5 | 467.6 | 557.8 | 621.7 | 457.5 | 537.2 | 636.7 | |
| 449.8 | 456.1 | 549.3 | 614.5 | 445.6 | 521.9 | 617.3 | |
| 175.3 | 156.8 | 252.4 | 216.9 | 170.5 | 261.8 | 360.5 | |
| 494.9 | 496.1 | 545.8 | 573.8 | 492.7 | 521.9 | 641.8 | |
| 395.0 | 395.4 | 467.1 | 498.3 | 391.7 | 542.6 | 561.9 | |
| 450.1 | 456.2 | 548.6 | 612.9 | 445.9 | 521.8 | 615.8 | |
| 190.7 | 204.8 | 375.0 | 468.8 | 180.9 | 201.0 | 227.9 | |
| 174.8 | 190.1 | 367.2 | 462.7 | 164.1 | 186.1 | 214.5 | |
| 154.6 | 204.8 | 359.2 | 456.8 | 142.3 | 150.3 | 229.6 | |
| 146.5 | 163.7 | 354.7 | 451.4 | 133.5 | 142.6 | 154.9 | |
| 173.6 | 188.8 | 366.3 | 461.4 | 162.9 | 185.0 | 213.9 | |
| 193.8 | 207.8 | 376.7 | 470.3 | 184.2 | 203.5 | 229.6 | |
| 140.5 | 141.4 | 143.7 | 147.5 | 140.4 | 172.9 | 213.8 | |
| 424.1 | 136.8 | 448.2 | 517.9 | 423.5 | 470.7 | 530.1 | |
| 74.6 | 74.9 | 75.7 | 76.9 | 74.6 | 91.6 | 112.9 | |
| 141.5 | 141.9 | 143.7 | 147.8 | 140.9 | 173.4 | 214.2 | |
| 110.3 | 110.8 | 110.2 | 112.3 | 110.3 | 111.0 | 111.9 |
| Squark/ | |||||||
|---|---|---|---|---|---|---|---|
| Slepton/Gluino/ | BP8 | BP9 | BP10 | BP11 | BP12 | BP13 | BP14 |
| Gaugino masses | |||||||
| 450.8 | 532.1 | 517.9 | 585.1 | 695.8 | 599.9 | 688.2 | |
| 435.7 | 506.9 | 542.2 | 596.3 | 688.1 | 707.7 | 770.4 | |
| 425.6 | 493.7 | 531.9 | 583.4 | 670.9 | 698.0 | 757.3 | |
| 139.8 | 228.1 | 257.1 | 310.6 | 397.2 | 391.8 | 448.6 | |
| 471.9 | 530.6 | 543.9 | 590.9 | 671.2 | 657.7 | 716.1 | |
| 369.0 | 437.5 | 461.5 | 513.4 | 600.9 | 599.2 | 660.6 | |
| 426.2 | 493.5 | 531.4 | 583.4 | 669.1 | 696.5 | 755.3 | |
| 198.0 | 213.5 | 323.2 | 332.2 | 349.2 | 514.3 | 523.0 | |
| 182.7 | 199.5 | 314.2 | 323.5 | 340.9 | 508.7 | 517.6 | |
| 169.3 | 174.9 | 302.2 | 305.2 | 310.9 | 498.4 | 501.2 | |
| 161.6 | 167.9 | 297.6 | 300.8 | 306.9 | 495.0 | 497.9 | |
| 181.6 | 198.4 | 313.3 | 322.6 | 340.1 | 508.7 | 516.7 | |
| 201.3 | 216.0 | 324.9 | 333.6 | 350.2 | 514.9 | 523.5 | |
| 127.7 | 156.9 | 150.4 | 174.8 | 215.6 | 177.2 | 209.7 | |
| 405.9 | 448.6 | 443.4 | 478.3 | 536.9 | 495.1 | 539.2 | |
| 67.9 | 83.2 | 79.6 | 92.2 | 113.4 | 93.0 | 109.9 | |
| 128.4 | 157.5 | 151.0 | 175.3 | 215.9 | 177.6 | 210.0 | |
| 109.9 | 110.7 | 110.1 | 110.7 | 111.7 | 110.3 | 111.2 |
| Channels | BP1 | BP2 | BP3 | BP4 | BP5 | BP6 | BP7 |
|---|---|---|---|---|---|---|---|
| 48.1 | 55.5 | 88.9 | 99.5 | 45.6 | 39.6 | 35.8 | |
| 23.4 | 23.8 | 11.0 | 0.46 | 22.7 | 20.7 | 18.7 | |
| 33.0 | 33.0 | 24.7 | 17.3 | 33.0 | 32.9 | 32.8 | |
| 66.4 | 66.4 | 49.6 | 34.7 | 66.3 | 66.1 | 65.9 | |
| - | - | 24.9 | 47.4 | - | - | - | |
| 98.9 | 99.1 | 43.8 | 19.2 | 98.9 | 99.3 | 99.5 | |
| - | - | 55.7 | 80.6 | - | - | - | |
| 100.0 | 100.0 | 95.5 | 100.0 | 100.0 | 100.0 | 69.5 | |
| – | - | 4.5 | - | - | - | 30.5 | |
| 1.6 | 1.3 | 1.6 | 1.0 | 1.6 | 1.5 | 1.5 | |
| 15.9 | 14.3 | 18.8 | 14.7 | 16.6 | 17.5 | 18.9 | |
| 14.7 | 13.3 | 24.3 | 20.6 | 14.2 | 20.6 | 26.4 | |
| 67.8 | 71.0 | 55.3 | 63.6 | 68.6 | 60.3 | 53.2 | |
| 44.4 | 52.2 | 67.4 | 67.5 | - | - | - | |
| 33.0 | 30.5 | 21.7 | 21.6 | - | - | - | |
| 16.5 | 17.3 | 10.8 | 10.8 | - | - | - | |
| - | - | - | - | 100.0 | 98.6 | 74.6 | |
| - | - | - | - | - | 1.9 | 25.4 | |
| - | - | 49.5 | 69.6 | - | - | - | |
| - | - | 23.5 | 24.2 | - | - | - | |
| 46.0 | 47.6 | 4.5 | 1.4 | - | - | - | |
| 28.4 | 19.2 | 1.7 | 1.4 | - | - | - | |
| - | - | - | - | 100.0 | 89.4 | 85.4 | |
| 17.4 | 18.9 | 2.8 | 2.4 | - | - | - |
| Channels | BP8 | BP9 | BP10 | BP11 | BP12 | BP13 | BP14 |
|---|---|---|---|---|---|---|---|
| 56.8 | 47.4 | 77.4 | 74.2 | 63.6 | 100.0 | 93.6 | |
| 25.4 | 23.2 | 22.6 | 25.6 | 24.7 | - | 6.4 | |
| 33.0 | 32.9 | 30.7 | 32.4 | 32.8 | 19.8 | 24.3 | |
| 66.4 | 66.2 | 61.7 | 65.1 | 65.7 | 39.8 | 48.9 | |
| - | - | 6.5 | 1.3 | - | 39.3 | 25.4 | |
| 98.7 | 99.2 | 88.4 | 99.3 | 99.5 | 26.2 | 44.3 | |
| - | - | 10.7 | - | - | 73.5 | 55.4 | |
| 100.0 | 100.0 | 94.4 | 77.1 | 62.9 | 58.4 | 53.2 | |
| - | - | 5.6 | 22.9 | 32.2 | 30.4 | 33.7 | |
| 1.6 | 1.6 | 1.6 | 1.6 | 1.4 | 1.6 | 1.4 | |
| 15.3 | 17.1 | 19.1 | 19.6 | 67.1 | 22.9 | 22.2 | |
| 12.6 | 18.8 | 23.8 | 26.5 | 30.2 | 36.3 | 36.2 | |
| 70.4 | 62.5 | 55.4 | 52.2 | 48.2 | 38.9 | 39.8 | |
| 53.5 | 54.7 | 67.1 | - | - | - | - | |
| 30.1 | 28.6 | 21.8 | - | - | - | - | |
| 16.3 | 16.7 | 10.9 | - | - | - | - | |
| - | - | - | - | - | - | - | |
| - | - | - | 100.0 | 100.0 | 100.0 | 100.0 | |
| 12.4 | 11.3 | 65.0 | 65.8 | - | 65.0 | - | |
| 4.5 | 3.8 | 21.4 | 20.4 | - | 19.7 | - | |
| 48.3 | 43.2 | 6.2 | 5.1 | - | 9.6 | - | |
| 16.2 | 22.7 | 3.4 | 3.1 | - | 1.8 | - | |
| 18.4 | 18.8 | 5.5 | 5.1 | - | 3.5 | - | |
| - | - | - | - | 100.0 | - | 100.0 |
Most of our parameter sets are consistent with the bound 141 from Tevatron [16] although, strictly speaking, this bound is valid for and tan = 3 and for a specific model which maximizes the BRs of and into and channels.
It may also be noted that there are sizable differences in the radiative corrections to as computed by the different tools. For example ISAJET [26] gives larger by about +2 for the same mSUGRA parameters. Moreover, there is a 3 correction to due to yet unknown higher order effects [27]. In view of these uncertainties, the values of as given in Tables 2-3 are compatible with the LEP bound.
The BRs of gluino, squarks and gauginos for the above BPs have been computed by SDECAY [28] and are presented in Table 4 and Table 5.
As already noted the light stop signature can come both from direct stop pair production or via the decay of the gluino. In BP1 the direct stop pair production is sizable due to the presence of a very light stop () and the bulk of the signal comes from them. In contrast for BP2 and BP8 the corresponding masses are even lighter ( 156.8 and 139.8). Nevertheless the signal from direct pair production is small. This is because of the small , which reduces the jet tagging efficiency. In such cases the main signal comes from .
The enhanced leptonic BR of , as discussed above, for BP1, BP2 and BP8 should be noted. We stress that if direct pair production is the main source of the signal (see section 3.1) this enhancement is necessary. In contrast if the signal stems from squark-gluino production followed by (see section 3.2) then there are many sources of b-jets and leptons. As a result observable signals are possible even if decay into or even into modes with large BRs.
In BP1, BP2, BP5-BP9 and BP12 , where refers to squarks of both and types belonging to the first two generations. Here decays into pairs of all flavours although the decays into the third generation dominate. In BP3, BP4, BP10, BP11, BP13 and BP14, . As a result the gluino decays exclusively into the third generation squark-quark pairs. Thus inspite of somewhat heavier ’s, the signal may come from squark-gluino events.
In BP5, BP6, BP7 and BP9 the BR() is not very large as the gluinos are heavier than all squarks. Moreover, the BR of the two body decay is quite large: being 100, , and 100 respectively. Lepton in such cases comes from and, to a lesser extent, from decay. The scenario BP5 with low has a light with mass . But in BP6 and BP7 the is significantly heavier. In spite of these unfavourable features of the chosen parameters we shall show that the signal can be obtained provided the selection criteria are carefully chosen.
In BP11, BP12, BP13 and BP14 the is comparatively heavy with mass between 300 - 450. Here the decay channel of opens up and contribute to the signal.
In summary, the observables like the production cross sections, the BRs of and gluino decays, the leptonic BR of the lighter charginos decays are chosen such that they vary between favourable and unfavourable values. Yet as we shall see in section 3 the proposed signal is viable over a large parameter space.
We have chosen tan for reasons . But we will see in Section 3.2 that even after relaxing this restriction, signals from squark-gluino events will still be observable at low integrated luminosities.
3 The Signal and the Backgrounds
In this analysis we have generated all squark-gluino events at TeV using Pythia [19]. Initial and final state radiation, decay, hadronization, fragmentation and jet formation are implemented following the standard procedures in Pythia. The lowest order squark-gluino production cross-sections have been computed by CalcHEP (version 2.5.6) [29].
We have used the toy calorimeter simulation (PYCELL) provided in Pythia with the following criteria:
-
•
The calorimeter coverage is . The segmentation is given by which resembles a generic LHC detector.
-
•
A cone algorithm with R has been used for jet finding.
-
•
and jets are ordered in .
3.1 Signature of direct stop pair production
In this sub-section we have concentrated on the signature from pair production followed by cascade decays of both. This signature will be the main signature of SUSY if all strongly interacting sparticles except are beyond the reach of LHC 7 TeV at low luminosities. Of course this scenario can not be realized in mSUGRA but is certainly possible in an unconstrained MSSM. It is, however, assumed that the masses and the BRs of the and the sparticles in the electroweak sector are as in mSUGRA (See Tables 2 - 5). This ensures that bulk annihilation and/or stau-LSP co-annihilation produces the observed DM relic density [12]. We shall study in the next section the full consequences of mSUGRA when all sparticles are simultaneously produced . The point BP1 with the other squarks and gluinos are assumed to be heavy as discussed above, is a representative point for this analysis.
We have generated only events using Pythia [19]. As already noted in Section 2 the BRs of the leptonic decays of the lighter chargino and the second lightest neutralino into leptonic channels containing the and in this case are relatively high. This can naturally happen in any scenario with light sleptons. This scenario motivates the signal . We have required the following selection criteria:
Lepton selection:
Leptons are selected with and . For lepton-jet isolation we require . For the sake of simplicity the detection efficiency of and are assumed to be .
- jet identification:
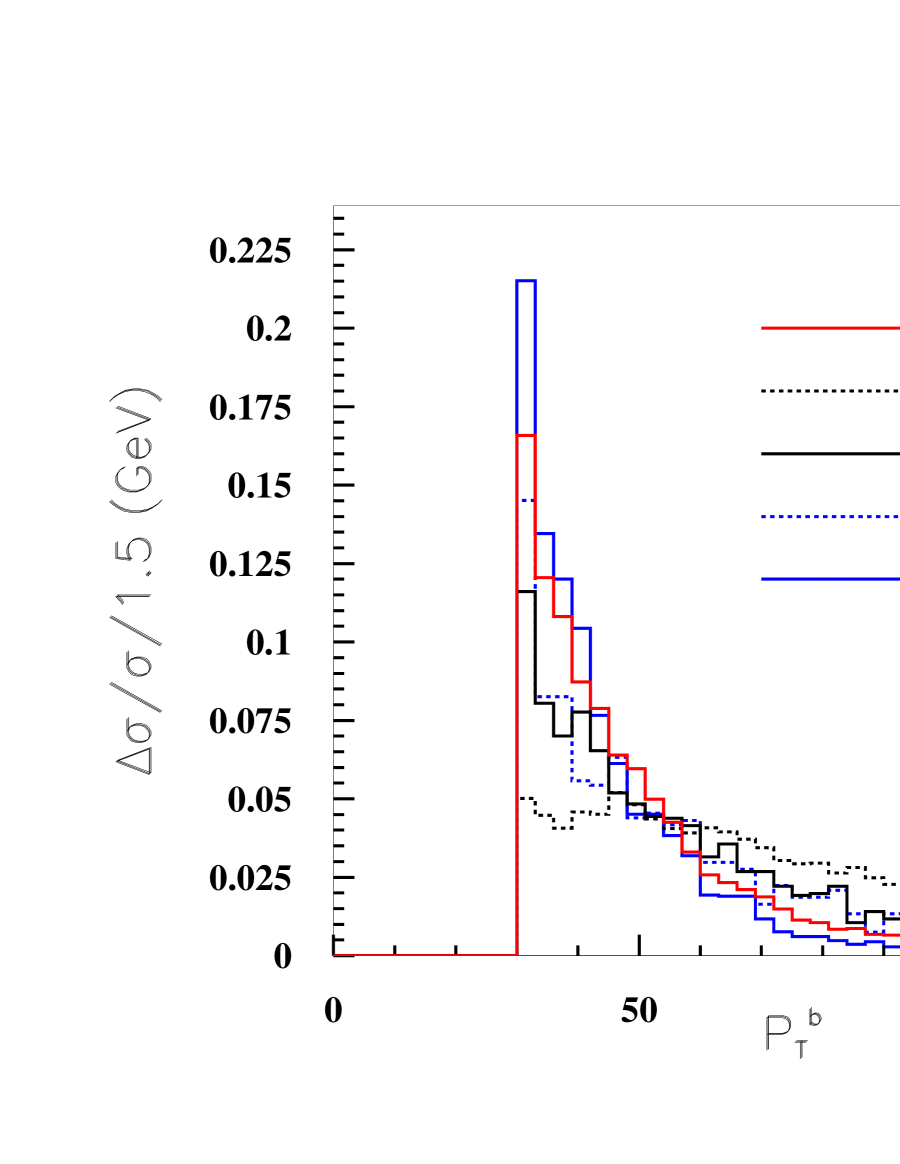
We have tagged -jets in our analysis by the following procedure. A jet with corresponding to the coverage of tracking detectors matching with a -hadron of decay length mm has been marked . This criteria ensures that single -jet tagging efficiency (i.e., the ratio of tagged -jets and the number of taggable -jets) in events. In Fig. 1 we have presented the distribution of the isolated lepton (right) and the tagged -jet (left) for events for BP1 scenario along with the dominant backgrounds.
The following cuts, henceforth referred to as Set 1, are implemented for background rejection :
-
•
We have selected events with one isolated lepton (cut 1).
-
•
We have selected events with one tagged jet (cut 2).
-
•
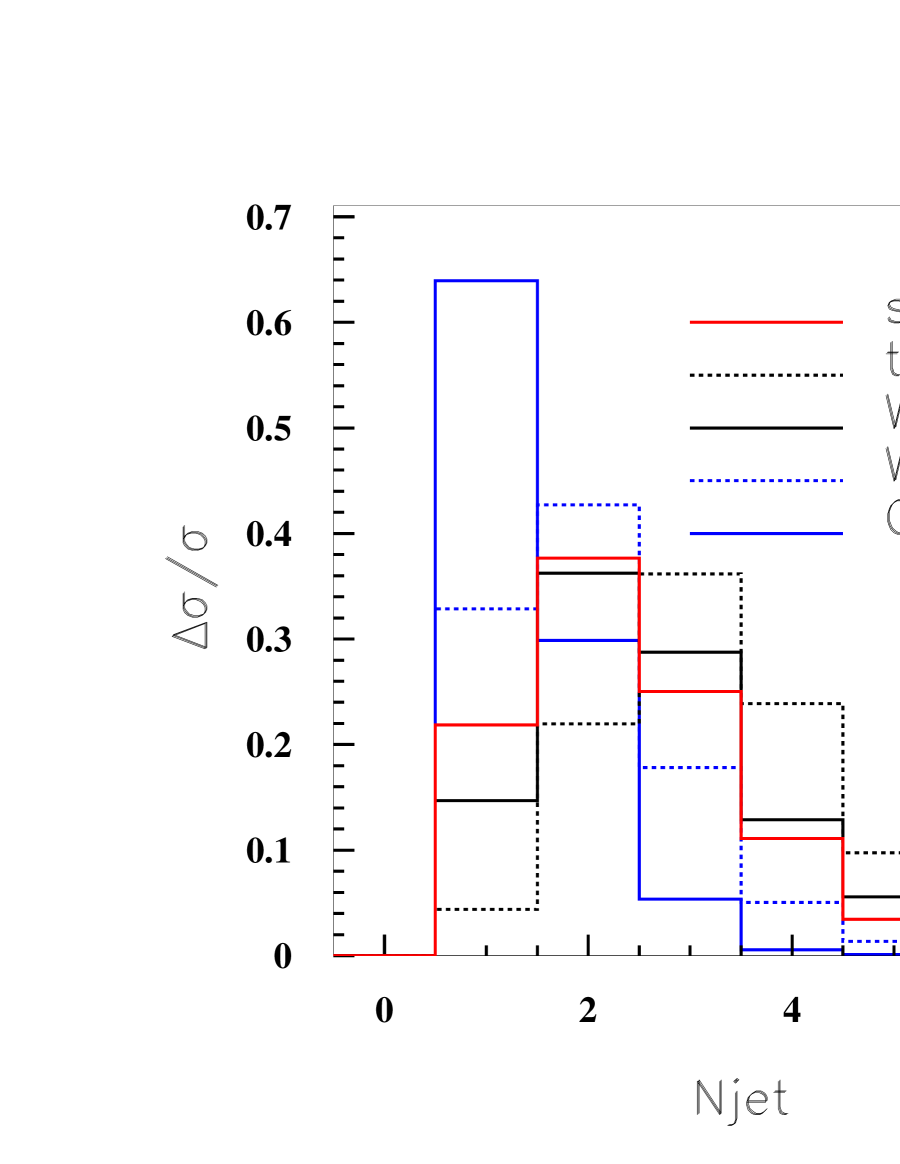
Events with at least 2 jets are selected (cut 3). This is motivated by Fig. 2 (left).
-
•
Events with missing transverse energy ( are selected (cut 4). It is to be noted that the signal has relatively low (see Fig. 2 (right)).
-
•
We have also demanded events with tagged jet (cut 5). This is motivated by Fig. 1 (left)) and rejects the background from events quite efficiently.
We have considered the backgrounds from , QCD dijet production, + - events, where decays into all channels.
We have generated events using Pythia and the leading order (LO) cross-section has been taken from CalcHEP which is 85.5 pb. We have generated QCD di-jet processes by Pythia in different bins : , and , where is defined in the rest frame of the parton parton collision. The main contribution comes from the low bin, which has a cross-section of pb. For the other bins the backgrounds are negligible.
For + - backgrounds we have generated events with and at the parton level using ALPGEN (version 2.13) [30]. We have generated these events subject to the condition , and . These partonic events have been fed to Pythia for parton showering, hadronization, fragmentation, decays etc.
All pair production cross-sections (except for the QCD processes) are computed in the leading order setting both the renormalization and factorization scale equal, , where is the mass of the particle or sparticle produced and using CTEQ5L PDFs [31]. For example, for top and stop pair production the scale is set at and respectively. For QCD events the scale has been chosen to be equal to . For final states containing particles having unequal masses the scale is set at the average mass of the pair.
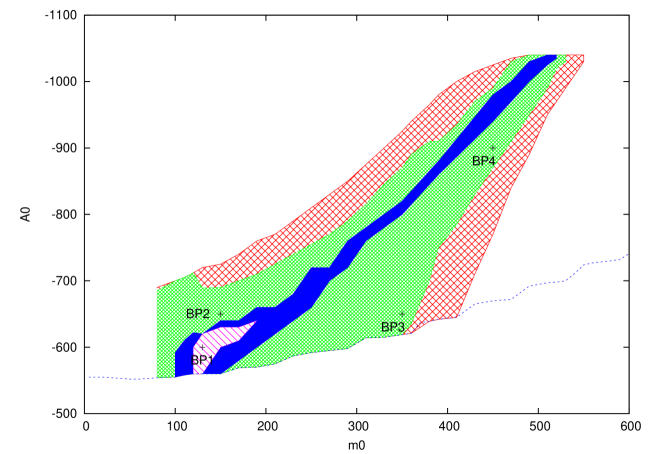
In Fig. 3 we delineate the regions on the plane which are accessible to the signal from pair production only corresponding to different integrated luminosities. The parameters used to generate the stop and the electroweak sectors are , tan and . As already mentioned other strongly interacting sparticles are assumed to be beyond the reach of LHC 7 TeV run.
We have assumed that a signal is observable if , where () are the number of signal and background events respectively. In the pink region the signal from events alone will stand over the background. For example, the number of signal events after Set 1 cuts, in the range 120 - 190, , -560 to -640, tan varies between 317 - 395 for 1 .
The SM backgrounds for this set of cuts are given in Table 6. However, the signals presented in the first four columns of this table will be discussed in the next section.
Using the estimated backgrounds in Table 6, the significance () for the above range varies between 5.0 to 6.2. This estimate is, however, conservative. If we compute the the next to leading order (NLO) cross-sections using PROSPINO [32] and CTEQ5M PDF we get a K- factor of 1.7. We do not know all the background cross-sections at the NLO level at 7 TeV. However, even if our total background estimate is smaller by a factor of two (three), we would get a better (nearly equal) significance at NLO.
For 2 , regions corresponding to higher values of and become accessible to the 7 TeV run (see the blue region in Fig. 3). However, the stop mass reach does not change dramatically with increasing . For 1, 2 and 5 the stop mass range that yields observable signal are 164 - 192 , 162 - 207 and 159 - 220 respectively. The lower edge of the above range is fixed by the magnitude of .
Since we require the to be lighter than the , with 141, the signal is visible for a narrow range 195 215 . The upper side of the range opens up for higher .
The above results are not the most general ones since the mSUGRA type correlations among and the masses in the electroweak sector have been assumed. In the most general MSSM, the signal may be visible over a larger parameter space. For example if the charginos dominantly decay leptonically via 2 body modes involving slepton-neutrino (or sneutrino-lepton) pairs with a nearly universal leptonic BR and final state with one or more isolated leptons are required, a much larger parameter space can be probed. Such scenarios may arise in the supergravity framework by varying the boundary conditions at the GUT scale in theoretically well motivated ways [33].
3.2 Signals from Squark-Gluino events
A much larger region of the parameter space can be scanned through all squark-gluino events. We have generated these events at TeV using Pythia [19]. The points BP1 - BP4 are the representative points for this analysis.
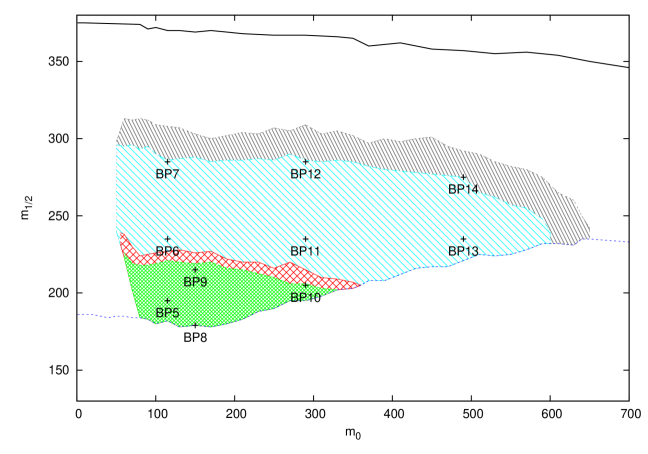
The efficiencies of the cuts belonging to Set 1 for these points are shown in Table 6 along with the SM background. The main source of signal is the decay . In last row of Table 6 the significance of the signals for the selected points at 1 are shown. In Fig. 3 we show the regions of the - plane with = 195, tan = 5 and sign () 0 where the signal is visible for different integrated luminosities. For 1 (2 ) the green (red) region yields observable signal. In Fig. 4 we have presented the same information in the plane for a fixed . The green (red) regions at the bottom of this figure corresponds to observable signals for 1 (2 ).
| Signal | Background | |||||||
| BP1 | BP2 | BP3 | BP 4 | QCD | ||||
| (pb) | 26.7 | 36.9 | 8.0 | 8.4 | 85.5 | 7.7E+07 | 1.43E+04 | 5200 |
| cut 1 | 9.2115 | 12.9063 | 2.5783 | 2.85 | 28.728 | 2.2E+05 | 3066.8 | 953.33 |
| cut 2 | 2.8417 | 1.5424 | 1.0197 | 1.2017 | 14.0519 | 1.07E+04 | 8.2939 | 8.5925 |
| cut 3 | 2.4644 | 1.4464 | 0.9985 | 1.1261 | 13.4354 | 3847.4 | 5.571 | 7.3292 |
| cut 4 | 1.4524 | 1.1303 | 0.7480 | 0.6770 | 4.2382 | 8.6364 | 0.9473 | 1.5282 |
| cut 5 | 0.8908 | 0.5940 | 0.3460 | 0.3667 | 2.4615 | 0.0048 | 0.560 | 1.0078 |
| 14.02 | 9.35 | 5.45 | 5.77 | |||||
However, these events cannot be directly used for studying the properties of . We now apply additional cuts so that the signal from direct stop pair production can be isolated from the squark- gluino events.
For the next part of the analysis we assume that the SM background can be accurately estimated either from the data or by using improved higher order calculation of the respective cross-sections and can be subtracted out. In addition to the cuts belonging to Set 1 we impose the following requirements on all squark-gluino events.
-
•
, where central jets have 2.5 .
-
•
The effective mass (), where ( )
Both the above cuts eliminates bulk of the squark-gluino events while leaving the events from direct stop pair production relatively unaffected. These two cuts along with those belonging to cuts of Set 1 define the Set 2 of the cuts. The results are summarized in Table 7 for different mSUGRA points taken from different regions of Fig. 3. The last two columns give number of all squark-gluino events after the cuts of Set 1 and Set 2 for 1 . The columns 3 and 4 give the corresponding number of events from stop pair events only. Comparing columns 4 and 6 we find that after Set 2 cuts about 80 % of the remaining events are from production. It will be interesting to see whether mass can be reconstructed from such samples using the standard procedures [18]. It is important to note that the purity of the sample increases as the and masses increase.
| Points | -(all) | ||||
|---|---|---|---|---|---|
| , , | Set 1 | Set 2 | Set 1 | Set 2 | |
| 130, 195,600 | 175 | 395 | 313 | 890 | 393 |
| 190,195,580 | 205 | 226 | 183 | 650 | 236 |
| 290,195,720 | 191 | 267 | 215 | 688 | 257 |
| 390,195,800 | 218 | 155 | 128 | 429 | 149 |
| 450,195,900 | 216 | 156 | 127 | 366 | 152 |
| 510,195,1020 | 206 | 208 | 167 | 364 | 172 |
The missing energy spectrum of the signal from direct production is weak (Fig. 2 (right)). But - events in general will have high and more number of jets. Thus, a new set of cuts has been designed to look for a more generalized signal - .
The following new cuts, collectively called Set 3 are implemented for background rejection:
-
•
We have selected events with one isolated lepton (cut 1′).
-
•
We have selected events with one tagged jet (cut 2′).
-
•
Events with at least 4 central jets are selected, where central jets are defined as pycell jets with 2.5 (cut 3′).
-
•
Events with missing transverse energy ( are selected (cut 4′).
-
•
Events with are selected (cut 5′).
| Signal | Background | |||||||
|---|---|---|---|---|---|---|---|---|
| BP1 | BP2 | BP3 | BP4 | QCD | ||||
| cut 1′ | 9.2115 | 12.9063 | 2.5783 | 2.85 | 28.728 | 2.2E+05 | 3066.8 | 953.33 |
| cut 2′ | 2.8417 | 1.5424 | 1.0197 | 1.2017 | 14.0519 | 1.07E+04 | 8.2939 | 8.5925 |
| cut 3′ | 1.0457 | 0.8610 | 0.7298 | 0.6243 | 4.6965 | 81.647 | 0.4349 | 1.4242 |
| cut 4′ | 0.3399 | 0.3296 | 0.2037 | 0.1553 | 0.0615 | 0.0016 | 0.0 | 0.0331 |
| cut 5′ | 0.3106 | 0.3025 | 0.1963 | 0.1520 | 0.0487 | 0.0016 | 0.0 | 0.0189 |
| 37.24 | 36.34 | 23.58 | 18.26 | |||||
| Signal | ||||||||||
| BP5 | BP6 | BP7 | BP8 | BP9 | BP10 | BP11 | BP12 | BP13 | BP14 | |
| (pb) | 29.1 | 6.3 | 1.8 | 63.0 | 10.5 | 7.7 | 3.6 | 1.2 | 1.6 | 0.75 |
| cut 1′ | 8.7852 | 1.5774 | 0.4144 | 21.6846 | 3.03 | 2.1667 | 0.9301 | 0.2731 | 0.5269 | 0.2352 |
| cut 2′ | 2.3066 | 0.5119 | 0.1103 | 2.1545 | 1.1994 | 0.9003 | 0.3688 | 0.0968 | 0.1915 | 0.0859 |
| cut 3′ | 0.7954 | 0.2484 | 0.0727 | 1.1823 | 0.5641 | 0.5993 | 0.2815 | 0.0768 | 0.1765 | 0.0771 |
| cut 4′ | 0.2987 | 0.1165 | 0.0436 | 0.4032 | 0.2019 | 0.2127 | 0.1222 | 0.0426 | 0.0705 | 0.0423 |
| cut 5′ | 0.2793 | 0.1129 | 0.0414 | 0.3612 | 0.1911 | 0.2048 | 0.1184 | 0.0418 | 0.0693 | 0.0418 |
| 33.56 | 13.56 | 5.0 | 43.4 | 22.96 | 24.61 | 14.23 | 5.02 | 8.33 | 5.02 | |
All possible SM backgrounds as listed in the previous section have been computed with these revised cuts. In Table 8 and Table 9 the efficiencies of the Set 3 of cuts for the signal and SM background are listed. The significance of the signal for 1 is given in the last row of Table 8 and 9 for different benchmark points. In Fig. 4 the blue (grey) region yield observable signals in this channel for 1 (2 ). The relative strong cuts, however, eliminate a large fraction of the events from direct production and reconstruction of mass is not possible.
Finally to compare the signal and the signal with the canonical signal, we compute the latter signal using the cuts from [5]. The selection criteria, hereby called Set 4 are as follows :
-
•
Events with isolated leptons with are rejected.
-
•
Events are selected with .
-
•
We further demand events with and all other jets with .
-
•
Events with are selected.
-
•
We select events with .
-
•
The selected events must have the ratio of and greater than 0.3.
| Set 1 | Set 3 | Set 4 | ||||
|---|---|---|---|---|---|---|
| Points | ||||||
| BP1 | 890 | 190 | 310 | 114 | 4175 | 4179 |
| BP2 | 594 | 187 | 302 | 114 | 4392 | 3957 |
| BP3 | 346 | 108 | 196 | 97 | 792 | 939 |
| BP4 | 366 | 70 | 152 | 59 | 545 | 366 |
| BP5 | 811 | 181 | 279 | 67 | 5039 | 4254 |
| BP6 | 165 | 67 | 113 | 101 | 1740 | 1564 |
| BP7 | 35 | 19 | 41 | 26 | 563 | 510 |
| BP8 | 844 | 306 | 361 | 162 | 6806 | 6109 |
| BP9 | 396 | 109 | 191 | 86 | 2195 | 2376 |
| BP10 | 321 | 162 | 204 | 137 | 1312 | 1398 |
| BP11 | 132 | 88 | 118 | 87 | 671 | 782 |
| BP12 | 31 | 26 | 42 | 36 | 305 | 314 |
| BP13 | 66 | 23 | 69 | 24 | 103 | 157 |
| BP14 | 28 | 18 | 42 | 24 | 84 | 91 |
In Table 10, the size of the squark-gluino signal for Set 1, Set 3 and Set 4 cuts for 1 corresponding to different BPs are given for and . Comparing column 2 and column 3 we indeed find that the signal size is strikingly different for the two cases . The same conclusion follow by comparing columns 4 and 5 . One can also see this difference by observing the ratio of signal size with the signal for and (columns 6 and 7). It may be recalled that this ratio is fairly insensitive to theoretical uncertainties like the choice of the QCD scale, the choice of PDFs etc.
In [12] it was emphasized that regions of the mSUGRA parameter space corresponding to low and are compatible with the WMAP data [15] on the DM relic density of the universe and the bound only for . In Fig.4 the lower edge of the signal region corresponds to the = 110 line for tan 5 and = -600. The line above the signal region represents the same line for = 0.
In the same figure the region consistent with the WMAP data can be identified by comparing with Fig 2 of [12]. We find that for , tan 5 and = -600, the region 320 400 is consistent with the WMAP data. The corresponding region for = 120 is 470 550. Apparently only a small fraction of the signal region near and just above the left upper edge is consistent with the WMAP data. However, it should be borne in mind that our signal estimates are based on the leading order cross sections. As discussed above more accurate estimates based on the NLO cross sections and optimized cuts are expected to yield better reach. Integrated luminosity higher than 2 may improve the reach further.
A larger parameter space consistent with the WMAP data which yields the signal can be found if the and tan are allowed to vary. In [12] the region of the mSUGRA parameter space consistent with WMAP data for other choices of the above two parameters were also identified. In Table 11 we present several such points. The corresponding signals are computed subject to the cuts of Set 3. We also present the significance of each signal for 1 . It should be noted that observable signals are possible for moderate values of and higher values of tan.
| , , , tan | |
|---|---|
| 80,350,700,5 | 5.4 |
| 80,300,1000,5 | 5.6 |
| 100,200,700,10 | 25.2 |
| 100,220,700,10 | 16.6 |
| 120,280,900,10 | 5.16 |
| 150,200,600,20 | 24.2 |
| 170,200,300,30 | 23.1 |
| 170,220,350,30 | 15.0 |
4 Conclusions
LHC experiments at the early stage of the 7 TeV run are sensitive to the mSUGRA parameter space with relatively low . A sizable part of this parameter space is excluded for low values of and tan by the bound 114.4 from LEP. If mSUGRA is realized in nature with rather low sparticle masses it is , therefore, likely that either or tan or both should be large. Additional interest in this region stems from the fact that here LSP bulk annihilation and/or stau-LSP co-annihilation may produce the observed dark matter relic density. If SUSY is discovered during the early runs at 7 TeV, the validity of mSUGRA can be tested if some additional information on and tan is available.
The canonical signature, however, is not very sensitive to . In this paper we suggest the signature ) which is sensitive to moderate and large values of and low tan and can complement the canonical signal. This signal may arise either from direct pair production or from provided is much lighter than all other squarks. This naturally happens in models with low tan and large .
In Section 2 we have motivated this signature by introducing several benchmark points. Some of the chosen points have features which naturally ensure a strong signal. Some, on the other hand, are selected such that one or more of the above features are absent, leading to relatively weak signals. Next we scan over the parameter space containing these points and analyze the visibility of the signal during 7 TeV run.
In Section 3 we examine the proposed signals. In 3.1 the signal with from direct pair production has been studied with the assumption that all other strongly interacting sparticles are beyond the reach of the ongoing run at low luminosities. Using the Set 1 of cuts (Section 3.1), we estimate that 192(220) can be probed with 1 (5) (See Fig. 3). We stress that these estimates based on the LO cross-sections are conservative. Better mass reach is likely to follow by using the NLO cross-sections as discussed in the text. As pointed out at the end of the Section 3.1, certain departures from the sparticle spectrum of mSUGRA may make the search prospect even better.
A much larger region of the mSUGRA parameter space can be scanned by analyzing all squark-gluino events using the Set 1 of cuts (Section 3.2). This is illustrated in Fig. 3 and 4 (see also Tables 6).
In order to study the properties of we suggest a procedure for filtering out the events from all SUSY events using the Set 2 of cuts introduced in Section 3.2 . We find that nearly 80 pure sample can be separated by this method (see Table 7). It will be interesting to see whether can be reconstructed by using the standard procedures [18] and this will be applicable for higher sparticle masses within the reach of LHC 14 TeV runs. Our results, however, indicate that the filtering could be more efficient for heavier squarks and gluinos.
The directly observable events has a rather soft spectrum. Thus a strong cut - a very potent tool for suppressing the SM background - can not be fully utilized. We have shown that by using stronger cuts (Set 3) a much larger region of the - space can be probed via all the squark-gluino events and the presence of the underlying non-zero trilinear coupling can be traced. Using the Set 3 of cuts in Section 3.2 the parameter space delineated in Fig. 4 can be probed by the signal (see also Table 8-9). It is interesting to note that several parts of the parameter space with yield relic densities consistent with WMAP data as well as observable signals (see Table 11).
Finally in Table 10 we compare the signal using the Set 1 of cuts for vanishing and non-vanishing trilinear couplings (see columns 2 and 3). The same comparison for the using the Set 3 of cuts is also presented in the same table (see columns 4 and 5). It is clear that both the signals are rather sensitive to the value of . In the last columns of this table we present the canonical signal for the above two choices of . We find that - as expected - the signal is more or less insensitive to . More importantly the ratio of various observables in Table 10 are insensitive to a large extent to the theoretical uncertainties like the choices of the QCD scale.
We believe that if SUSY is indeed discovered in the channel, the signal proposed in this paper may provide complementary information about the trilinear coupling in the mSUGRA model for both 7 TeV and 14 TeV runs.
Note Added :
When our work was in the final stage, the CMS collaboration published the first result of SUSY search in the channel at the ongoing LHC experiments for 35 of data [34]. The analysis was done in the mSUGRA model. The main result is an exclusion plot in the - plane for and tan = 3 and . From the discussions in the introduction it is clear that this excluded region is incompatible with the bound.
It may, however, be argued that the signature is fairly insensitive to and tan 777The last two columns of Table 10 support the observation. For a recent illustration of this point see the analysis of the data by the ATLAS Collaboration [35]. See also Fig. 1 (right) in [36]. A part of this paper generalizes the ATLAS exclusion plots for large tan and .. With this approximation the parameter spaces with sensitive to our signals can be examined in the light of the CMS exclusion plot.
Most of the parameter space sensitive to the signal arising from all squark-gluino production (see the green and red regions of Fig. 3 and Fig. 4) is disfavoured by the CMS exclusion plot. However, the separation of the stop signal from squark-gluino events as discussed here could be useful in future. Finally a large region sensitive to the (see blue and grey regions of Fig. 4) survives the CMS exclusion plot.
Subsequently the ATLAS collaboration published a similar exclusion plot using the data based on the same set of mSUGRA parameters disfavoured by the bound [37]. Apparently their observed limits are stronger than the corresponding CMS exclusion. This result is very different from the expectations based on earlier experiments or simulations. A closer scrutiny, however, reveals that they have observed 1 event each for the and the channels against backgrounds of 1.81 0.75 and 2.25 0.94 respectively. This signal deficit which could be due to fluctuations in a low statistics experiment is one of the reasons for their stronger limits 888 We thank Dr Satyaki Bhattacharya for a very fruitful discussion on this point. . We are of the opinion that at this stage of the LHC experiment emphasis should be given on the expected limit or the median expected limit of [37] both of which yield much weaker exclusion almost similar to the CMS result [34].
As discussed in the introduction, the signals involving or are very sensitive to tan and is strictly valid for low tan only. This point has recently been emphasized in [12, 38].
However the very recent ATLAS exclusion plot using the data [35] is somewhat stronger than the corresponding CMS plot. This will exclude more blue and grey regions sensitive to the signal in Fig. 4. Nevertheless a sizable parameter space, the large part of it in particular, survives this exclusion.
Acknowledgment:
NB acknowledge the Council of Scientific and Industrial Research (CSIR), India for a research fellowship. We would like to thank Dr. Biplob Bhattacherjee for help in computation.
References
- [1] For a recent review see, for example, P. Nath et al., arxiv:1001.2693[hep-ph].
- [2] For reviews on Supersymmetry, see, , H. P. Nilles, Phys. Rep. 110, 1 (1984); H. E. Haber and G. Kane, Phys. Rep. 117, 75 (1985) ; J. Wess and J. Bagger, Supersymmetry and Supergravity, 2nd ed., (Princeton University Press, Princeton, 1991); M. Drees, P. Roy and R. M. Godbole, Theory and Phenomenology of Sparticles, (World Scientific, Singapore, 2005).
- [3] H. Baer, S. Kraml, A. Lessa and S. Sekmen, J. High Energy Phys. 1002, 055 (2010); H. K. Dreiner, M. Kramer, J. M. Lindert and B. O’Leary, J. High Energy Phys. 1004, 109 (2010); H. Baer, V. Barger, A. Lessa and X. Tata, arXiv:1004.3594[hep-ph]; D.Feldman, G.Kane, R.Lu and B. D. Nelson, Phys. Lett. B 687, 363 (2010); N. Chen, D. Feldman, Z. Liu, P. Nath and G. Peim, arXiv:1011.1246 [hep-ph]; Biswarup Mukhopadhyaya and Satyanarayan Mukhopadhyay, Phys. Rev. D 82, 031501 (2010); N. Chen et al., Phys. Rev. D 83, 023506 (2011); Phys. Rev. D 83, 035005 (2011); B. Altunkaynak, M. Holmes, P. Nath, B. D. Nelson and G. Peim, Phys. Rev. D 82, 115001 (2010); M. Guchait, D Sengupta, arXiv:1102.4785 [hep-ph].
- [4] Nabanita Bhattacharyya, Amitava Datta and Sujoy Poddar, Phys. Rev. D 82, 035003 (2010).
- [5] ATLAS Collaboration, ATLAS-CONF-2010-065.
- [6] Talk given by M. Pierini at SUSY 10, 18th International Conference on Supersymmetry and Unification of Fundamental Interactions Physikalisches Institut, Bonn, Germany, 2010.
- [7] A. H. Chamseddine, R. Arnowitt and P. Nath, Phys. Rev. Lett. 49, 970 (1982); R. Barbieri, S. Ferrara and C. A. Savoy, Phys. Lett. B 119, 343 (1982); L. J. Hall, J. Lykken and S. Weinberg, Phys. Rev. D 27, 2359 (1983); P. Nath, R. Arnowitt and A. H. Chamseddine, Nucl. Phys. B 227, 121 (1983); N. Ohta, Prog. Theor. Phys. 70, 542 (1983).
- [8] CDF collaboration, T. Aaltonen et al., Phys. Rev. Lett. 102, 121801 (2009); D0 collaboration (V. M. Abazov et al), Phys. Lett. B 660, 449 (2008).
- [9] J. M. Frere, D. R. T. Jones and S. Raby, Nucl. Phys. B 222, 11 (1983).
- [10] See, e.g., Fig. 13.32 in CMS physics Technical Design Report, Vol-II (Eds. A. De Roeck et al), J. Phys. G. 34, 995 (2007).
- [11] R. Barate et al. (LEP Working Group for Higgs boson searches), Phys. Lett. B 565, 61 (2003).
- [12] Utpal Chattapadhyay, Debottam Das, Amitava Datta and Sujoy Poddar,Phys. Rev. D 76, 055008 (2007).
- [13] S. Dawson and P. Jaiswal, Phys.Rev.D82:073017,2010.
- [14] See, e.g., the review by H. Baer and X. Tata in Physics at the Large Hadron Collider, Indian National Science Academy, A Platinum Jubilee Special Issue (Eds. Amitava Datta, B. Mukhopadhyaya and A. Raychaudhuri; Springer, 2009).
- [15] D. N. Spergel et al., Astrophys. J. Suppl. 170, 377 (2007).
- [16] D0 Collaboration, V. M. Abazov et al Phys. Lett. B 680, 34 (2009).
- [17] Nabanita Bhattacharyya, Amitava Datta and Sujoy Poddar, Phys. Rev. D 78, 075030 (2008).
- [18] See , e.g. ,the review by Christopher G. Lester and Alan J. Barr, J. High Energy Phys. 0712, 102 (2007) (the sub-section 4.6 is particularly relevant for stop pair production and subsequent decays discussed in our paper).
- [19] T. Sjostrand, P. Eden, C. Friberg, L. Lonnblad, G. Miu, S. Mrenna and E. Norrbin, Comp. Phys. Comm. 135, 238 (2001); For a more recent version see, J. High Energy Phys. 0605, 026 (2006).
- [20] K. Hikasa and M. Kobayashi, Phys. Rev. D 36, 724 (1987); M. Muhlleitner and E. Popenda, J. High Energy Phys. 1104, 095 (2011)
- [21] C. Boehm, A.Djouadi and Y. Mambrini, Phys. Rev. D 61, 095006 (2000); A. Djouadi, M. Guchait and Y. Mambrini, Phys. Rev. D 64, 095014 (2001); S. P. Das, Phys. Rev. D 73, 115004 (2006).
- [22] S. P. Das, A. Datta and M. Guchait, Phys. Rev. D 70, 015009 (2004); S. P. Das, A. Datta and M. Maity, Phys. Lett. B 596, 293 (2004); N. Bhattacharyya, A. Datta and M. Maity, Phys. Lett. B 669, 311 (2008).
- [23] S. Bornhauser, M. Drees, S. Grab and J. S. Kim, Phys. Rev. D 83, 035008 (2011).
- [24] L. E. Ibanez and G. G. Ross, Phys. Lett. B 110, 215 (1982); K. Inoue, A. Kakuto, H. Komatsu and S. Takeshita, Prog. Theor. Phys. 68, 927 (1982) [Erratum-ibid. 70, 330 (1983)]; J. R. Ellis, J. S. Hagelin, D. V. Nanopoulos and K. Tamvakis, Phys. Lett. B 125, 275 (1983); L. Alvarez-Gaume, J. Polchinski and M. B.Wise, Nucl. Phys. B 221, 495 (1983).
- [25] A. Djouadi, J. L. Kneur and G. Moultaka, Comp. Phys. Comm. 176, 426 (2007).
- [26] F.E. Paige et al., (hep-ph/0312045). See also, University of Florida ISAJET Webpage http://www.phys.ufl.edu/jblender/isajet/isajet.html
- [27] S. Heinemeyer, W.Hollik and G. Weiglein, Phys. Rep. 425, 265 (2006); S. Heinemeyer, Int. J. Mod. Phys. A 21, 2659 (2006).
- [28] M. Muhlleitner, A. Djouadi and Y. Mambrini,Comp. Phys. Comm. 168, 46 (2005).
- [29] See, , A. Pukhov, CalcHEPa package for evaluation of Feynman diagrams and integration over multi-particle phase space (hep-ph/9908288). For the more recent versions see: http://www.ifh.de/pukhov/calchep.html.
- [30] M. Mangano et al. , J. High Energy Phys. 0307, 001 (2003).
- [31] H. L. Lai et al. [CTEQ Collaboration], Eur. Phys. J. C 12, 375 (2000); P. M. Nadolsky et al. [CTEQ Collaboration], Phys. Rev. D 78, 013004 (2008). See also, http://www.phys.psu.edu/cteq.
- [32] W. Beenakker, R. Hoepker and M. Spira, arXiv: hep-ph/9611232.
- [33] Amitava Datta, Aseshkrishna Datta and M.K.Parida, Phys. Lett. B 431, 347 (1998).
- [34] The CMS Collaboration, arXiv:1101.1628[hep-ex]
- [35] The ATLAS Collaboration, arXiv:1102.5290[hep-ex]
- [36] Sujeet Akula et al. , arXiv:1103.1197[hep-ph]
- [37] The ATLAS Collaboration, arXiv:1102.2357[hep-ex]
- [38] Nabanita Bhattacharyya and Amitava Datta, Phys. Rev. D 80, 055016 (2009).