Hydrogen-bonded supramolecular assembly of dyes
at nanostructured solar cell interfaces
Abstract
We calculate from first principles the O core-level shifts for a variety of atomistic models of the interface between TiO2 and the dye N3 found in dye-sensitized solar cells. A systematic comparison between our calculations and published photoemission data shows that only interface models incorporating hydrogen bonding between the dyes are compatible with experiment. Based on our analysis we propose that at the TiO2/N3 interface the dyes are arranged in supramolecular assemblies. Our work opens a new direction in the modeling of semiconductor/dye interfaces and bears on the design of more efficient nanostructured solar cells.
Among promising low-cost photovoltaics, dye-sensitized solar cells (DSCs) O’Regan and Grätzel (1991) based on nanostructured TiO2 films sensitized with the dye Ru(dcbpyH2)2(NCS)2 (N3) have gained prominence over the past two decades due to their relatively high energy conversion efficiencies in excess of 10% Nazeeruddin et al. (1993, 1999); Bessho et al. (2009). In these devices the photocurrent is generated via ultrafast electron transfer from the photoexcited dye to the nanostructured semiconductor Duncan and Prezhdo (2007). Since the electron injection takes place within a sub-nanometer length scale, the atomistic nature of the TiO2/N3 interface plays a critical role in the performance of DSCs De Angelis et al. (2007). The dye N3 has four carboxylic acid groups sup (ered). It is generally agreed that the adsorption of N3 onto the anatase TiO2 surface occurs through the anchoring of one or more of these groups via the formation of Ti-O bonds Nazeeruddin et al. (2003); Johansson et al. (2005); Rensmo et al. (1999); Schiffmann et al. (2010); De Angelis et al. (2010). However the detailed atomic-scale structure of the TiO2/N3 interface remains controversial, and questions such as how many and which carboxylic groups participate in the bonding to the substrate are being actively debated Nazeeruddin et al. (2003); Johansson et al. (2005); Rensmo et al. (1999); Schiffmann et al. (2010); De Angelis et al. (2010).
In this work we propose a new atomic-scale model of the TiO2/N3 interface by reverse-engineering measured X-ray photoemission spectra (XPS). We first calculate from first-principles the O core-level shifts for a variety of atomistic models of the TiO2/N3 interface. We then perform a quantitative comparison between our calculated core-level shifts and the XPS spectra of Ref. Johansson et al., 2005. Such comparison shows that only interface models which incorporate hydrogen bonding interactions between the dyes are compatible with the measured spectra. Based on our analysis we propose that at the TiO2/N3 interface the dyes are arranged in supramolecular hydrogen-bonded assemblies.
The existence of competing models of the atomic-scale structure of the TiO2/N3 interface illustrates the complexity of the problem. Even in the case of an atomically perfect TiO2 surface there exists a plethora of possible adsorption geometries Diebold (2003). Previous computational studies have explored the potential energy landscape of one isolated N3 dye adsorbed on the TiO2 surface, arguing in favor of specific models on the grounds of adsorption energy calculations Schiffmann et al. (2010); De Angelis et al. (2010). The difficulties with this approach are that (i) a thorough mapping of the total energy landscape is beyond current capabilities, and (ii) energetically favorable configurations may be kinetically inaccessible during the fabrication of DSCs. In order to avoid these difficulties from the outset we here follow a completely different strategy and ask what is the atomic-scale model of the TiO2/N3 interface which best reproduces measured core-level spectra. Our choice is motivated by the observation that core levels are sensitive to the local bonding environment, and therefore carry the signature of the atomistic interface structure.
We here consider the O core-level shifts of TiO2/N3 interfaces reported in the XPS study of Ref 9. All our calculations are based on a generalized gradient approximation to density-functional theory, and have been performed using the planewave pseudopotential software package quantum ESPRESSO Giannozzi et al. (2009). Core-level shifts are calculated using the theory developed in Refs. Pehlke and Scheffler, 1993; Pasquarello et al., 1996. A detailed description of our computational setup is given as supplementary material sup (hods).
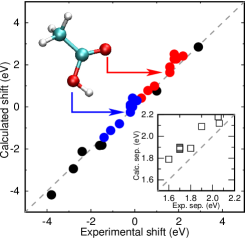
Our ability to discriminate between candidate interface models relies critically on accurate core-level shift calculations. In order to gauge the accuracy of the computational method we considered a number of test molecules containing C and O atoms whose structures are well understood. In particular we included molecules which carry carboxylic acid groups COOH similarly to the N3 dye. In Fig. 1 we compare our calculated O core-level shifts with experiment Jolly et al. (1984); McQuaide and Banna (1988). Our calculations exhibit very good agreement with experiment over a wide energy range spanning 7 eV. In the inset of Fig. 1 we concentrate on the molecules containing carboxylic acid groups. In these groups the two oxygen atoms are inequivalent, and the core electrons associated with the hydroxyl (COH) O atom are more tightly bound than those associated with the carbonyl (CO) O atom. Our calculations describe very accurately the differences between the core-level shifts of the hydroxyl and of the carbonyl O atoms, with an r.m.s. deviation from experiment below 0.2 eV.
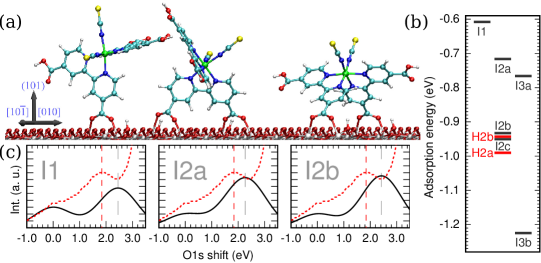
For our model substrate we have chosen the anatase (101) surface, which corresponds to the majority Lazzeri et al. (2001) of the total exposed surface of the TiO2 films used in DSCs and in Ref 9. We considered eleven adsorption geometries of the N3 dye on this surface, including previously proposed models Rensmo et al. (1999); Nazeeruddin et al. (2003); Schiffmann et al. (2010); De Angelis et al. (2010). Schematic representations of these models can be seen in Figs. 2(a),3(a) and in the supplementary material sup (ered). Each model is labeled by the number of carboxylic groups which bind to the substrate. The models I2a and I2b have been proposed in previous experimental work Rensmo et al. (1999); Nazeeruddin et al. (2003), and the models I2c and I3a have been introduced in recent computational studies Schiffmann et al. (2010); De Angelis et al. (2010).
In order to make contact with previous studies we report in Fig. 2(b) the calculated adsorption energies for each interface sup (sion). The calculated adsorption energies span a range of 0.6 eV across all the models considered. This range is comparable to the energy of hydrogen bonds between carboxylic acid groups in related systems. Indeed, the energy of the H-bond in the formic acid dimer corresponds to 0.3 eV per monomer Tsuzuki and Lüthi (2001). This observation suggests that hydrogen-bonding between the carboxylic acid groups of N3 cannot be neglected in the energetics of N3 adsorption on TiO2.
In Fig. 2(c) we compare our calculated O core-level shifts sup (sion) with the XPS measurements of Ref. Johansson et al., 2005. The measured spectra exhibit peaks at 529.8 eV, 531.4 eV and 533.2 eV. The peak at the lowest binding energy (529.8 eV) has been assigned to the O atoms of the TiO2 substrate. The other two peaks have been assigned to the inequivalent O atoms of the carboxylic groups in the dye Johansson et al. (2005). Our calculations correctly reproduce the three measured peaks. The uncertainty on the photoelectron escape depth Shimada (2007), surface stoichiometry, and H-coverage makes the separation between the substrate peak at 529.8 eV and the two dye peaks unreliable for a quantitative comparison. We therefore concentrate on the dye peaks at 531.4 eV and at 533.2 eV. First we consider the intensity ratios of these peaks. The intensity of the peak at 533.2 eV scales with the number of protonated carboxylic groups on the dye. The best match between our calculated intensities and experiment is obtained for interface models where the dye has two protonated carboxylic groups (I2 and I3 models). In model I1 the dye has three protonated COOH groups, leading to an intensity ratio (0.5) well off the experimental estimate (0.3) Johansson et al. (2005). We therefore reject the candidate model I1 on the grounds of intensity mismatch. Second we consider the binding energy of the adsorbate peaks sup (sion). As clearly shown in figure 2(c), the separations of adsorbate peaks in all the models of the I2 and I3 families fall within the range 2.3-2.6 eV, and overestimate the measured peak separation of 1.8 eV Johansson et al. (2005). This systematic deviation of 0.5-0.8 eV from experiment is well above our 0.2 eV error bar. We have carried out a number of tests in order to confirm that such deviation is not a numerical artifact sup (hods). We therefore assign the mismatch between theory and experiment to the inaccuracy of the models I2-I3.
By carrying out a detailed analysis of our calculated core-level shifts we noted that moderate changes in the structural parameters of the interface models, such as dye twisting or bond length variations, only lead to subtle changes in the shifts. We therefore conclude that structural variations across the models are not responsible for the observed 0.5-0.8 eV deviation.
These observations point us towards the possibility that supramolecular interactions within the dye monolayer may play a role in the measured XPS spectra. Our calculations for different surface coverages sup (sion) indicate that the separation between the dye peaks is not affected by long-range electrostatic effects. Hence sizeable changes in the calculated peak separation can only arise from short-range interactions of the free carboxylic groups in the dye with other molecules. Such interactions can happen in two ways: either some of the N3 carboxylic groups form bonds with contaminant molecules, or the N3 dyes are bonded to each other within the monolayer.
The ex-situ preparation of the TiO2/N3 interface of Ref. Johansson et al., 2005 may lead to the presence of contaminant molecules in the system, such as water and hydrocarbons. It is unlikely that large hydrocarbons systematically attach to N3, but H2O molecules are small enough to form hydrogen bonds with the COOH groups and may alter the measured XPS spectra. However, our calculations of XPS spectra including water molecules exhibit heavily distorted peak intensities sup (sion), and allow us to exclude this scenario on the grounds of intensity mismatch.
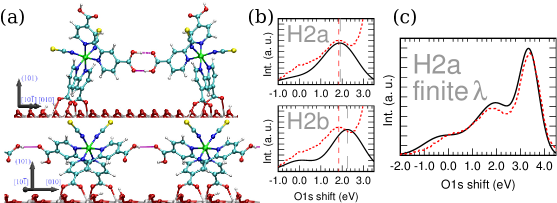
The only remaining possibility is that of dye-dye interactions through the free COOH groups. In order to test this hypothesis we considered two interface models, H2a and H2b, which probe the limiting regimes of strong and weak H-bonding respectively [Fig. 3(a)]. Model H2a is derived from model I2a by forming N3 dimers (H bond length 1.51 Å). Model H2b is a self-assembled dye monolayer derived from model I2b (H bond length 2.68 Å). Figure 3b shows the XPS spectra calculated for the H-bonded interface models. The agreement between theory and experiment is seen to improve dramatically upon inclusion of supramolecular interactions between the dyes. The calculated separation between dye peaks now matches the measured value within our error bar. The modification of the XPS spectrum arising from supramolecular interactions results from the lowering of the O binding energy in the hydroxyl group participating in the hydrogen-bonding. This result is fully consistent with previous experiments Joyner and Roberts (1976) and calculations Aplincourt et al. (2001) on the formic acid dimer. In model H2b this effect is less pronounced due to the weaker H-bond [Fig. 3(b)]. Remarkably, if in the case of model H2a we include the substrate contribution to the spectrum sup (hods), the agreement with experiment becomes excellent [Fig. 3(c)]. These findings indicate that hydrogen-bonding between dyes is key to interpreting the photoemission data of Ref. Johansson et al., 2005.
It is natural to ask whether additional H-bonded superstructures can exist at the TiO2/N3 DSC interface. Elementary geometric considerations show that, among all the model interfaces considered, models H2a and H2b are the only possible H-bonded homogeneous supramolecular structures sup (sion). However, more complex heterogeneous assemblies of dyes cannot be excluded.
STM experiments could directly probe the proposed H-bonded assembly. Although there are reports of STM studies on anatase TiO2 in the literature Gong et al. (2006) to the best of our knowledge no data exists on N3-sensitized (101) surfaces. However STM experiments of N3 on rutile TiO2 reveal distinctively elongated features (ovals) in the tunneling maps Sasahara et al. (2010). Figure 3(a) suggests that the dyes in our dimer model H2a would naturally lead to an elongated STM footprint. Since the calculated Ru-Ru distance of 1.6 nm in our model H2a matches the length of the ovals in the STM maps (1.8 nm), we speculate that the features observed in Ref. Sasahara et al., 2010 may correspond to hydrogen-bonded N3 dimers.
It is worth asking whether our conclusions maintain their validity for other important dyes. The dye (Bu4N)2[Ru(dcbpyH)2(NCS)2] (N719) is structurally similar to N3, the only difference being that the protons on two carboxylic acid groups are replaced by counterions Nazeeruddin et al. (2003). Since in our interface model H2a the H-bonding does not occur through the substituted groups, model H2a is also a possible candidate for the TiO2/N719 interface. Interestingly a very recent infrared and Raman study Lee et al. (2010) of the TiO2/N719 interface suggested that the dye may be involved in some form of hydrogen-bonding, possibly with the substrate. Our model H2a provides a natural explanation of the data of Ref. Lee et al., 2010 in terms of supramolecular hydrogen-bonding.
In summary, we established that (i) models of the TiO2/N3 interface based on isolated dyes are unable to explain the measured XPS spectra, and (ii) interface models where the N3 molecules form supramolecular hydrogen-bonded assemblies are in good agreement with experiment. Since the lowest photoexcited electronic state of N3 is localized on the bipyridines and the carboxylic groups Fantacci et al. (2003), we expect charge delocalization upon the formation of a supramolecular assembly, with potential implications on the light absorption and the electron transfer mechanisms in DSCs. Our results are expected to hold also for other nanostructured solar cell concepts, such as for instance solid-state DSCs Bach et al. (1998); Snaith and Schmidt-Mende (2007). The present finding highlights the importance of supramolecular interactions at semiconductor/dye interfaces, and bears implications for the design of more efficient nanostructured solar cells.
We thank F. De Angelis and H. Snaith for fruitful discussions. This work is supported by the UK EPSRC and the ERC under the EU FP7 / ERC grant no. 239578. Calculations were performed in part at the Oxford Supercomputing Centre. Figures rendered using VMD Humphrey et al. (1996).
References
- O’Regan and Grätzel (1991) B. O’Regan and M. Grätzel, Nature 353, 737 (1991).
- Nazeeruddin et al. (1993) M. K. Nazeeruddin et al., J. Am. Chem. Soc. 115, 6382 (1993).
- Nazeeruddin et al. (1999) M. K. Nazeeruddin et al., Inorg. Chem. 38, 6298 (1999).
- Bessho et al. (2009) T. Bessho et al., J. Am. Chem. Soc. 131, 5930 (2009).
- Duncan and Prezhdo (2007) W. R. Duncan and O. V. Prezhdo, Annu. Rev. Phys. Chem. 58, 143 (2007).
- De Angelis et al. (2007) F. De Angelis et al., Nano Lett. 7, 3189 (2007).
- sup (ered) (See supplementary material for figures of all the models considered).
- Nazeeruddin et al. (2003) M. K. Nazeeruddin, R. Humphry-Baker, P. Liska, and M. Grätzel, J. Phys. Chem. B 107, 8981 (2003).
- Johansson et al. (2005) E. M. J. Johansson, M. Hedlund, H. Siegbahn, and H. Rensmo, J. Phys. Chem. B 109, 22256 (2005).
- Rensmo et al. (1999) H. Rensmo et al., J. Chem. Phys. 111, 2744 (1999).
- Schiffmann et al. (2010) F. Schiffmann et al., J. Phys. Chem. C 114, 8398 (2010).
- De Angelis et al. (2010) F. De Angelis, S. Fantacci, A. Selloni, M. K. Nazeeruddin, and M. Grätzel, J. Phys. Chem. C 114, 6054 (2010).
- Diebold (2003) U. Diebold, Surf. Sci. Rep. 48, 53 (2003).
- Giannozzi et al. (2009) P. Giannozzi et al., J. Phys.: Condens. Matter 21, 395502 (2009).
- Pehlke and Scheffler (1993) E. Pehlke and M. Scheffler, Phys. Rev. Lett. 71, 2338 (1993).
- Pasquarello et al. (1996) A. Pasquarello, M. S. Hybertsen, and R. Car, Phys. Rev. B 53, 10942 (1996).
- sup (hods) (See supplementary material for computational methods).
- sup (sion) (See supplementary material for discussion).
- Jolly et al. (1984) W. L. Jolly, K. D. Bomben, and C. J. Eyermann, At. Data Nucl. Data Tables 31, 433 (1984).
- McQuaide and Banna (1988) B. H. McQuaide and M. Banna, Can. J. Chem. 66, 1919 (1988).
- Lazzeri et al. (2001) M. Lazzeri, A. Vittadini, and A. Selloni, Phys. Rev. B 63, 155409 (2001).
- Tsuzuki and Lüthi (2001) S. Tsuzuki and H. P. Lüthi, J. Chem. Phys. 114, 3949 (2001).
- Shimada (2007) K. Shimada, in Very High Resolution Photoelectron Spectroscopy, edited by S. Hüfner (Springer, Berlin Heidelberg, 2007).
- Joyner and Roberts (1976) R. W. Joyner and M. W. Roberts, P. Roy. Soc. Lond. A Mat. 350, 107 (1976).
- Aplincourt et al. (2001) P. Aplincourt, C. Bureau, J. Anthoine, and D. P. Chong, J. Phys. Chem. A 105, 7364 (2001).
- Gong et al. (2006) X.-Q. Gong, A. Selloni, M. Batzill, and U. Diebold, Nat. Mater. 5, 665 (2006).
- Sasahara et al. (2010) A. Sasahara et al., Surf. Sci. 604, 106 (2010).
- Lee et al. (2010) K. E. Lee, M. A. Gomez, S. Elouatik, and G. P. Demopoulos, Langmuir 26, 9575 (2010).
- Fantacci et al. (2003) S. Fantacci, F. De Angelis, and A. Selloni, J. Am. Chem. Soc. 125, 4381 (2003).
- Bach et al. (1998) U. Bach et al., Nature 395, 583 (1998).
- Snaith and Schmidt-Mende (2007) H. J. Snaith and L. Schmidt-Mende, Adv. Mater. 19, 3187 (2007).
- Humphrey et al. (1996) W. Humphrey, A. Dalke, and K. Schulten, J. Mol. Graphics 14, 33 (1996).
See pages 1 of supplementary.pdf See pages 2 of supplementary.pdf See pages 3 of supplementary.pdf See pages 4 of supplementary.pdf See pages 5 of supplementary.pdf See pages 6 of supplementary.pdf See pages 7 of supplementary.pdf See pages 8 of supplementary.pdf See pages 9 of supplementary.pdf See pages 10 of supplementary.pdf See pages 11 of supplementary.pdf See pages 12 of supplementary.pdf See pages 13 of supplementary.pdf