1–7
Peculiar Current Solar-Minimum
Structure of the Heliosphere
Abstract
In this paper, I review the results of 3-D evolution of the inner heliosphere over the solar cycle #23, based on observations of interplanetary scintillation (IPS) made at 327 MHz using the Ooty Radio Telescope. The large-scale features of solar wind speed and density turbulence of the current minimum are remarkably different from that of the previous cycle. The results on the solar wind density turbulence show that (1) the current solar minimum is experiencing a low level of coronal density turbulence, to a present value of 50% lower than the previous similar phase, and (2) the scattering diameter of the corona has decreased steadily after the year 2003. The results on solar wind speed are consistent with the magnetic-field strength at the poles and the warping of heliospheric current sheet.
keywords:
turbulence, scattering, Sun: corona, Sun: magnetic fields, Sun: coronal mass ejections (CMEs), solar wind, solar-terrestrial relations1 Interplanetary Scintillation
In this study, a large amount of interplanetary scintillation (IPS) data obtained from the Ooty Radio Telescope (ORT), operating at 327 MHz (Swarup et al. 1971), has been employed to study the 3-D evolution of the heliosphere over the period 1989–2009. The IPS observations made with the ORT can provide the velocity of the solar wind and the scintillation index (m) in the heliocentric distance range of 10–250 solar radii () and at all heliographic latitudes. The value of m is a measure of electron-density turbulence in the solar wind (), along the line of sight (z) to the radio source (e.g., Manoharan et al. 2000). The normalized scintillation index, (i.e., observed index normalized by its long-term average), enables the comparison of levels of density turbulence obtained from different sources. However, the value of g is linearly related to only in the weak-scattering region at distances 40 . For example, an m-R profile attains the peak value at the strong-to-weak scattering transition point, which typically occurs 40 for IPS at 327 MHz (e.g., Manoharan 1993; 2006). In this study, the solar wind velocity and turbulence images have been exclusively obtained from weak-scattering data. However, the contour of constant level of turbulence in a year at different latitudes has been determined using peaks of several m-R profiles.
2 Solar Cycle #23: Three-Dimensional Solar Wind
Figure 1a shows the latitudinal distributions of solar wind speed and density turbulence (g) observed at Ooty over the solar cycle #23. These plots are similar to the well-known ‘butterfly diagram’ of photospheric magnetic field intensity. They have been made by tracing backward/forward from the measurement location onto a sphere of radius 100 R⊙, which approximately corresponds to the mid range of distances covered in the observations utilized to generate the plots.
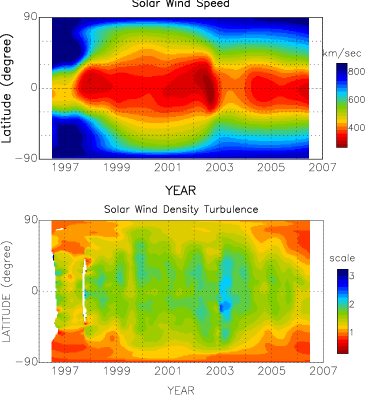
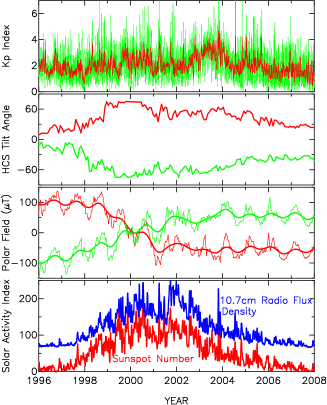
It is evident in the ‘latitude-year’ speed plot that during minimum of the solar cycle, polar regions are dominated by high speed streams (600–800 kms-1) from open-field coronal holes and low and variable flow speeds (500 kms-1) are observed at the low- and mid-latitude regions of the complex/closed field corona. But, there are marked differences in latitudinal extents of low- and high-speed flow regions between the current and previous minimum phases. For example during 1996–97, the low-speed flow is confined to of the equatorial belt; whereas at the current minimum, it extends to a latitude range of . These low-speed wind widths also correlate with the latitudinal warping (tilt angle) of heliospheric current sheet (HCS), respectively, a small amplitude, 15∘, at the previous minimum and a moderate amplitude, 30∘, at the current minimum (Figure 1b). These results suggest (i) a near-dipole magnetic field of the Sun for the previous minimum, around the year 1997 and (ii) a never-approached dipole-field geometry during the current minimum. It is in good agreement with the result from other independent IPS speed measurements obtained from the Solar-Terrestrial Environment Laboratory (e.g., Tokumaru et al. 2009). Thus, the HCS tilt of the corona of the current phase tends to resemble a condition similar to that of moderate activity, but without activity!
These changes in the latitudinal extents of low-speed wind have also influenced the high-speed flows from the polar regions. In the current minimum phase, high-speed regions at the poles have remarkably shrunk towards the poles (Figure 1a, top). Moreover, the speed of high-latitude (50∘) wind is considerably less for the current minimum than that of the previous minimum. These findings nicely correlate with the polar field strength, which is 40–50% weaker for the current minimum phase. The magnetic pressure associated with the polar coronal holes seems to determine the acceleration of the high-speed wind. The weak field may be due to the fact that the polar field has not fully developed after the field reversal around the year 2000 (Figure 1b).
2.1 Density-Turbulence Structures
The drifting of density structures from high to low latitudes, seen in Figure 1a (bottom), is caused by the slow and gradual movement of concentrated magnetic-field regions of the corona. It is likely due to the migration of small/medium-size coronal holes from polar to low latitude regions and the high-speed wind from these coronal holes interacting with the low-speed wind, causing compression in front of the high-speed stream. The latitudinal spread of density patterns is also consistent with the HCS tilt angle (Figure 1b), which is maximum at the time of polarity reversal of the cycle and during when a large number of coronal mass ejections (CMEs) dominate the heliosphere (e.g., Yashiro et al. 2004).
The density plot is also consistent with the solar wind disappearance period, around mid 1999 (low level of density turbulence) and co-rotating interaction regions (CIRs) dominated heliosphere in the first half of 2003 (intense density turbulence along the latitudinal direction). It may be noted that during late October and early November 2003, a number of CME events prevailed the interplanetary medium. However, the effect of a CME in the Sun-Earth distance is rather limited to 2–4 days after its onset and weakens with solar distance. Whereas, in the case of CIR events, the influence of each event is seen for several days, with a systematic increase in density turbulence with radial distance. Moreover, they show a latitudinal pattern. For CIR events during 2003, the latitudinal distribution and the radial evolution of enhancement of turbulence have been observed (Manoharan 2008). The CIR-dominated period, in the first half of 2003, is in agreement with the moderate-to-severe storms observed at the Earth (Figure 1b, refer to Kp index plot). As observed in the speed plot, the latitudinal extents of low-turbulence regions at the poles also show remarkable changes between the current and previous minimum phases. The average level of turbulence at the current minimum seems to be considerably lower than that of the previous cycle.
2.2 Scattering Diameter of the Corona
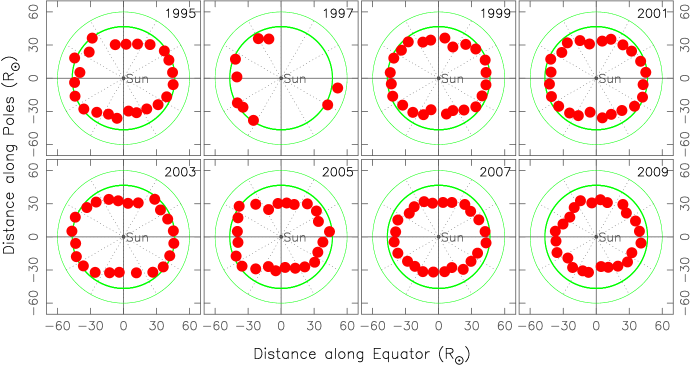
Figure 2 displays the constant plots, at different phases of the solar cycle. The plot for the year 1997 has been limited by weak-scattering observations and the last plot includes data up to May 2009. In general, a given level of turbulence is observed closer to the Sun at the poles than at the equator. However, depending on the phase of the solar cycle, the diameter of the contour can vary along the poles, but, remains nearly the same along the equator (e.g., Manoharan 1993).
The important point to note in this analysis is that after the year 2003, the overall diameter of contour has gradually decreased with respect to the Sun’s center. In other words, the same level of turbulence seems to move close to the Sun. Thus, the radial dependence of turbulence (, which typically varies as ) suggests that the scattering diameter of the corona has gradually shrunk towards the Sun. In other words, the scattering power () has remained nearly same at all latitudes between 1989 and 2003, but, decreased 50% around middle of 2009 at low-latitudes.
3 Discussion and Conclusions
The present large-scale 3-D features of solar wind speed and density turbulence are remarkably different from that of the previous cycle. In the current minimum phase, the extent of low-speed region along the equatorial belt is considerably wider than that of the previous cycle; whereas the high-speed regions have shrunk towards the poles in contrast to low-latitude extent of the previous cycle. The other important result of this study is that after the year 2003, the overall scattering diameter of the corona has gradually decreased with respect to the Sun’s center. These results are consistent with the ecliptic and off-ecliptic studies (e.g., Lee et al. 2009; McComas et al. 2008; Smith & Balogh 2008; Tokumaru et al. 2009).
The weak fields observed at the poles, as well as corresponding solar wind speed and density turbulence for the current low activity, are possibly caused by the changes in the movement of large-scale fields, as the reversal of polarity progresses. It is linked to the rate of poleward and equatorward meridional flows, which transport the unbalanced magnetic flux (e.g., Sheeley 2008). Moreover, the flux-transport dynamo has predicted weak polar fields and a long solar cycle (e.g., Choudhuri et al. 2007).
Acknowledgements.
I thank all the members of the Radio Astronomy Centre for making the Ooty Radio Telescope available for IPS observations. I also thank National Space Science Data Center for OMNI data and the Wilcox Solar Observatory for the magnetic-field data. This work is partially supported by the CAWSES-India Program, which is sponsored by ISRO.References
- [] Choudhuri, A.R., Chatterjee, P., & Jiang, J. 2007, Phy. Rev. Lett., 98, 131103
- [] Lee, C.O, et al. 2009, Solar Physics, 256, 345
- [] Manoharan, P.K. 1993, Solar Physics, 148, 153
- [] Manoharan, P.K., et al. 2000, ApJ, 530, 1061
- [] Manoharan, P.K. 2006, Solar Physics, 235, 345
- [] Manoharan, P.K. 2008, in B.N. Dwivedi & U. Narain (eds.), Physics of the Sun and its Atmosphere, (World Scientific, Singapore), p235-266
- [] McComas, D.J., et al. 2008, Geophys. Res. Lett., 35, 18103
- [] Sheeley, Jr., N.R. 2008, ApJ, 680, 1553
- [] Smith, E.J. & Balogh, A. 2008, Geophys. Res. Lett., 35, L22103
- [] Swarup, G., et al. 1971, Nature Phys. Sci., 230, 185
- [] Tokumaru, M., et al. 2009, Geophys. Res. Lett., 36, L091001
- [] Yashiro, S., et al. 2004, JGR, 109, 7105