Spectral Evolution of the September 2010 gamma-ray flare from the Crab Nebula
Abstract
Strong gamma-ray flares from the Crab Nebula have been recently discovered by AGILE and confirmed by Fermi-LAT. We study here the spectral evolution in the gamma-ray energy range above 50 MeV of the September 2010 flare that was simultaneously detected by AGILE and Fermi-LAT. We revisit the AGILE spectral data, and present an emission model based on rapid (within 1 day) acceleration followed by synchrotron cooling. We show that this model successfully explains both the published AGILE and Fermi-LAT spectral data showing a rapid rise and a decay within 2-3 days. Our analysis constrains the acceleration timescale and mechanism, the local magnetic field, and the particle distribution function. The combination of very rapid acceleration, emission well above 100 MeV, and the spectral evolution consistent with synchrotron cooling contradicts the idealized scenario predicting an exponential cutoff at photon energies above 100 MeV. We also consider a variation of our model based on even shorter acceleration and decay timescales which can be consistent with the published averaged properties.
1. Introduction
The Crab Nebula is at the center of the SN1054 supernova remnant and consists of a rotationally-powered pulsar interacting with a surrounding nebula through a relativistic particle wind (e.g., Hester 2008). The Crab pulsar is quite powerful (of spindown luminosity LPSR= 51038 erg s-1, and spin period P = 33 ms), and is energizing the whole nebula with its wave/particle output. The inner nebula shows distinctive optical and X-ray brightness enhancements (“wisps”, “knots”, and the “anvil” aligned with the pulsar “jet”) (Scargle 1969; Hester 1995, 2002, 2008; Weisskopf 2000). These local variations have been attributed to enhancements of the synchrotron emission produced by instabilities and/or shocks in the pulsar wind outflow. However, when averaged over the whole inner region (several arcminute across) the Crab Nebula has been considered essentially stable, and used as a ”standard candle” in high-energy astrophysics. The Crab Nebula X-ray continuum and gamma-rays up to MeV energies are modelled by synchrotron radiation of accelerated particles in an average nebular magnetic field G (Hester 2002, deJager et al. 1996, Atoyan & Aharonian 1996, Meyer et al. 2010). Emission from GeV to TeV energies is interpreted as inverse Compton radiation by electrons/positrons scattering CMB and nebular soft photons (deJager & Harding 1992, deJager etal. 1996, Atoyan & Aharonian 1996, Meyer et al. 2010).
Decades of theoretical modelling of this system (e.g., (Rees & Gunn 1974, Kennel & Coroniti 1984, deJager & Harding 1992, deJager etal. 1996, Atoyan & Aharonian 1996, Arons 2008, Meyer et al. 2010) offer the picture of a remarkable nebular system energized by a MHD pulsar wind interacting with the environment through a sequence of ”shocks” or dissipation features localized at distances larger than a few times cm. Efficient particle acceleration at the pulsar wind termination shock regions is believed to be occurring either through diffusive processes, e.g., (Blandford & Eichler, 1987; de Jager & Harding, 1992; de Jager et al., 1996; Atoyan & Aharonian, 1996), shock-drift acceleration (e.g., Begelman & Kirk 1990) or ion-mediated acceleration (e.g., Arons (2008); Spitkovsky & Arons (2004)). Several diffusive acceleration models imply acceleration rates of order of the relativistic electron cyclotron frequency (e.g., de Jager & Harding (1992); de Jager et al. (1996); Atoyan & Aharonian (1996)). Assuming equality between the accelerating electric field and the magnetic field at the acceleration site and synchrotron cooling in the co-spatial magnetic field leads to a most cited constraint for the maximum radiated photon energy (e.g., Aharonian 2004)
| (1) |
with the fine structure constant, the speed of light, and the electron’s mass. Eq. 1 applies in a natural way to diffusively accelerated particles, and turns out to be independent of the local magnetic field. According to the assumptions underlying this formula, emission above 100 MeV would be difficult to sustain in the Crab Nebula environment. Indeed, the exponential cutoff shown by the average gamma-ray spectrum in the 10 MeV - 10 GeV range supports this idealization de Jager & Harding (1992); de Jager et al. (1996).
However, the recent discovery by the AGILE satellite of a strong gamma-ray flare above 100 MeV from the Crab Nebula in September 2010 Tavani et al. (2010, 2011) and the confirmation by the Fermi-LAT Buehler et al. (2010); Abdo et al. (2011) substantially change this picture. Three substantial gamma-ray flaring episodes from the Crab Nebula have been announced so far (Tavani et al. 2011, hereafter T11; Abdo et al. 2011, hereafter A11). The flaring activity was detected only in the gamma-ray energy range 100 MeV - a few GeV, and it is attributed to transient nebular unpulsed emission. No significant variations were detected in other bands, except for the local enhancement in the ”anvil” region revealed by high spatial resolution observations of HST and chandra.
Three features of the September 2010 event are relevant: (1) the event develops within 3-4 days (whereas the others last about 2 weeks); (2) the gamma-ray risetime appears to be remarkably short, day (T11); (3) the flaring gamma-ray spectrum extends well above the limit of Eq. 1 (T11,A11). A flare production site in the inner nebula of size L 1016 cm is favored by both the peak isotropic gamma-ray luminosity Lp 51035 erg s-1 (which implies for a (3-5) radiation efficiency that about (2-3)% of the total spindown pulsar luminosity is dissipated at the flaring site) and by the flare risetime of 1 day. We noticed that the “anvil region” (”knot-2” and possibly ”knot-1”) in the Crab Nebula Scargle (1969); Hester (2008) is an excellent flare site candidate also because of its alignment with the relativistic pulsar jet (T11).
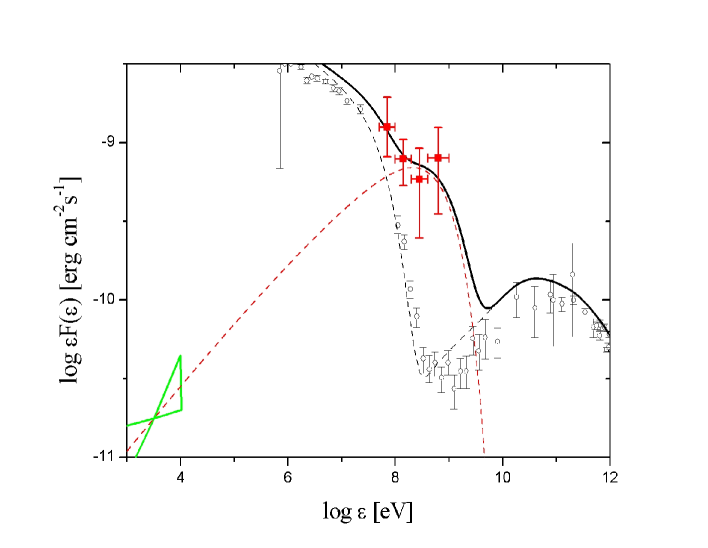
A number of important theoretical questions are raised by these detections. However, the published spectra of the September 2010 event are not homogeneous because of different integration times: a 2-day timescale for the AGILE data (T11), and a 4-day timescale for the Fermi-LAT data. The spectral shapes also appear different. The AGILE data are characterized by a hard curved spectral shape with peak photon energy of the differential power spectrum MeV (T11, see Fig. 1). On the contrary, the Fermi-LAT spectrum shows a quasi power-law shape extending up to a few GeV (A11). Without additional analysis, it is not clear whether the two datasets are consistent with each other. In any case, the hardness of the gamma-ray emission and the rapid spectral evolution challenge the idealized scenario underlying Eq. 1 de Jager & Harding (1992); de Jager et al. (1996); Atoyan & Aharonian (1996).
The goal of our paper is twofold: (1) investigate the consistency of the published AGILE and Fermi-LAT spectral data of the Sept. 2010 event by integrating the AGILE data over a 4-day timescale; (2) study the spectral evolution of a class of synchrotron emission models based on freshly accelerated particles in the inner Nebula, and check its validity for both the AGILE and Fermi-LAT data.
2. Spectral data analysis
In order to test whether the AGILE and Fermi-LAT spectra of the Sept. 2010 event are consistent with each other it is necessary to consider data with the same integration timescales. In the absence Fermi-LAT spectral data on a 2-day timescale, we revisited our AGILE data and carried out a 4-day integration which overlaps with the Fermi-LAT interval.
The AGILE 4-day Crab spectrum in the energy range 50 MeV-3 GeV was obtained by integrating between MJD 55457.38-55461.55. We obtained the nebular contribution by subtracting from the total emission the pulsar contribution corresponding to a flux F( MeV)= ph cm-2s-1 characterized by a power-law spectrum with photon index in the energy range 50 MeV - 3 GeV.
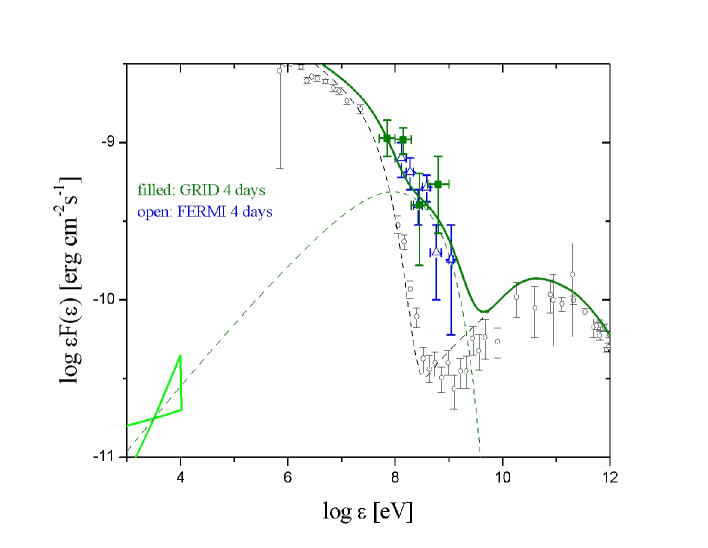
Fig. 2 shows the result of our additional analysis of the AGILE data together with the published Fermi-LAT data. The two data sets are now temporally homogeneous and appear to be in agreement within the errors. The apparent power-law behavior of the 4-day spectrum in the energy range 50 MeV - 2 GeV can be explained by a fast-rise-synchrotron-cooling model (see below). The solid curve of Fig. 2 shows the result of our modelling for a 4-day average of the rapidly varying spectrum.
3. A fast-rise synchrotron cooling model
We assume that a fresh population of impulsively accelerated electrons/positrons is produced in the inner nebula within a timescale short compared with all other relevant cooling timescales. The model presented here has general validity and does not depend on a specific site in the Nebula as long as the general characteristics of the emission fit our assumptions. We assume an efficient particle acceleration mechanism111We leave for other investigations the crucial issue of explaining the type of plasma wave turbulence leading to the short acceleration timescale (1 day or shorter). that applies simultaneously in one or more contiguous nebular sites that are subject to plasma instabilities and/or substantial pulsar wind particle density enhancements. A fraction of the total volume of the inner nebula is affected by the flaring instability. Consequently, only a fraction of the total number of radiating nebular particles contributes to the flare. This fact follows from the observed short flaring rise-time. For simplicity, we assume a Doppler factor ; a larger Doppler factor would imply a smaller particle number , a larger emitting region , and smaller rest-frame particle energies .
In our analysis we considered different values of the local magnetic field . The rapid observed cooling (2-3 days) for reasonable values of particle energies imply that the local magnetic field is substantially enhanced compared with (T11, A11). Reconciling the synchrotron cooling timescale (where the local magnetic field is in Gauss, and is a typical particle Lorentz factor) with the Sept. 2010 observations implies, for of electrons irradiating in the GeV range, a local magnetic field G that is 5 larger than the nebular average.
Our best modelling assumes an emitting region of size cm, and an enhanced local magnetic field G that we keep constant in our calculations. The acceleration process produces, within a timescale shorter than any other relevant timescale, a particle energy distribution that we model as a double power-law distribution (T11)
| (2) |
where is the particle number density. The assumption together with the constraint on implies a break energy around , and a normalization factor around cm-3. If the gamma-ray flare is related with the persistent local enhancement detected in the anvil region by HST and chandra (T11), we can constrain and , with the particle Lorentz factor ranging from to . The double power-law distribution of Eq. 2 implies maximal synchrotron emission between and and the total particle number required to explain the flaring episode turns out to be , where is an assumed spherical volume of radius .
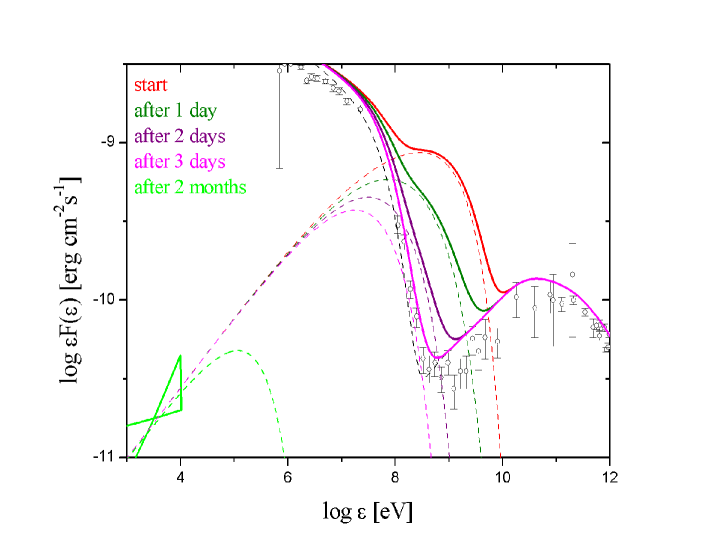
Based on standard synchrotron emissivity and particle cooling, we calculated both the particle distribution and the photon spectrum evolution keeping mG constant. We show in Fig. 3 the calculated photon spectra at four different times corresponding to days 1-2-3-4. Given our model parameters, fast spectral evolution takes place, and the flaring phenomenon fades away within the fourth day. We also calculated time spectral averages of the differential gamma-ray energy flux for different integration time durations according to the formula
| (3) |
with the particle energy loss rate where is the synchrotron cooling time. We use the time-integrated spectral function of Eq. 3 to model the 2-day (Fig. 1) and 4-day (Fig. 2) integrated spectral data of AGILE and Fermi-LAT. We find that the synchrotron peak photon energy during day no. 1 is
| (4) |
which is in good agreement with the peak shown in the 2-day averaged AGILE spectrum (Fig. 1). In the absence of very strong Doppler effects, our measured spectrum and the calculated violate the expectations from Eq. 1. Doppler effects with a few would not alter this conclusion. We find that the emission from inverse Compton scattering of the flaring particle population is negligible.
We also note that the spectral shape calculated in Fig. 3 and measured in Fig. 1 contradicts a simple translation by a Doppler factor of the average nebular data showing the synchrotron burn-off. The additional population of energized particles necessary to explain the flare can be successfully modelled by Eq. 2 (that can also account for the X-ray and optical ”afterglow” in the anvil region measured by Chandra and HST, T11). Our model applies to emitting regions idealized as standing sites or as regions within MHD outflows (such as the anvil features). Adiabatic expansion could play a role in contributing to the gamma-ray flux decrease for an emitting site speed of order of the sound speed. We checked the relevance of the adiabatic expansion in our model and concluded that it could explain a good fraction of the observed flux decrease. In this case, our estimate of the the local magnetic field would be an upper limit. Moreover, there would be no direct relation between the gamma-ray emission and the X-ray emission of the anvil enhancement because, at variance of the synchrotron cooling, adiabatic models cannot account for the persistent brightening in the X-rays (see Fig. 3).
We note that also a purely Maxwellian particle energy distribution (presented in T11, and resulting from particle shocks with no non-thermal tails) can also in principle explain the spectral evolution above 100 MeV: also in this case there would be no direct spectral connection between the gamma-ray emission and the X-ray/optical properties of localized regions in the Nebula.
4. An even faster evolution model
In our study we considered also the possibility of a flux and spectral evolution even faster than that shown in Figs. 1-3. The analysis of the Fermi-LAT Sept. 2010 data by Balbo et al. 2010 suggests indeed that the spectral evolution may occur on an overall timescale even faster than 1-2 days. A cooling timescale of day is explained in our synchrotron model for mG, and . In this case, the overall flaring episode lasting days is characterized by a sequence of short acceleration and cooling episodes lasting 1-2 days. Our analysis remains valid also in presence of a faster evolution. In this case, the magnetic field is determined to have a value .
We note that slower events lasting 6-7 days, as the 2007 flare presented in (T11), can be interpreted by the same model with larger region involved cm and similar . Determining the gamma-ray temporal structure on timescales shorter than 2 days is limited by photon statistics. The time-resolved analysis of the AGILE gamma-ray data for the Sept. 2010 event will be presented elsewhere.
5. Discussion and Conclusions
The Sept. 2010 event of the Crab Nebula lasting days is currently the shortest detected gamma-ray flare. Our analysis shows that the flux and spectral evolution of this event are well described by a model characterized by very fast (shorter than day) particle acceleration and by synchrotron cooling in a local magnetic field 5-10 times larger than the average nebular value . Both the AGILE and Fermi-LAT gamma-ray spectral data are consistent with each other within a 4-day timescale. Our analysis of the AGILE data on a 2-day timescale clearly shows that the emission is peaked at the photon energy of Eq. 4, which is almost one order of magnitude larger than the ”synchrotron burn-off” constraint of Eq. 1. The flaring mechanism in the Crab Nebula is quite remarkable: it accelerates particles to the largest kinetic energies (PeV) associable to a specific astrophysical source and does it within the shortest time ever detected in a nebular environment.
Our results challenge the physical assumptions underlying Eq. 1 and in particular acceleration models based on ”slow” processes. As we showed above, explanations in terms of Doppler boosting are problematic in light of the measured spectral curvature of the AGILE data. Even though a theoretical study of possible acceleration mechanisms consistent with the data discussed here is beyond the scope of this paper, we can briefly mention some of the difficulties. First-order Fermi acceleration with particles gaining energy by diffusing stochastically back and forth a shock front (e.g., Blandford & Ostriker 1978, Bell 1978, Drury 1983) appears to be too slow and is drastically challenged by our findings. In particular, it is difficult to see how a diffusive shock acceleration mechanism can violate Eq. 1. A locally enhanced (over ) electric field can produce a sort of ”runaway” of kinetic energy gains with an acceleration rate larger than the synchrotron cooling rate. However, despite some attempts and analogies with other astrophysical contexts (e.g., pulsar magnetospheres), it is currently not clear how this mechanism can be implemented in the Crab Nebula. MHD models of the pulsar wind (e.g., Komissarov & Lyubarsky 2004, Del Zanna et al. 2004, Camus et al. 2009, Komissarov & Lyutikov 2010), address the turbulence and the limit-cycle behavior of the instabilities. These features may in principle favor substantial local magnetic field enhancements. However, the calculated timescales of these instabilities (e.g., Camus et al. 2009) are several orders of magnitudes longer than what we detected in the Crab Nebula. Shock-drift acceleration Kirk et al. (2000) tends to occur on a timescale shorter than for diffusive processes. However, it is not clear whether the required efficiency can be reached in the flaring Crab Nebula site, and whether Eq. 4 can be obtained. Shocks mediated by ions in the pulsar wind that resonantly accelerate pairs by magnetosonic waves Gallant & Arons (1994); Spitkovsky & Arons (2004); Arons (2008) are typically slow, and are most likely not applicable in the X-ray and optically enhanced pulsar polar jet regions of T11.
The challenge provided by the Crab Nebula gamma-ray flaring requires a thorough investigation of the mechanisms leading to efficient particle acceleration and to a natural justification of Eq. 4. The issue will be elucidated by future Chandra X-ray and HST optical observations of the inner Crab Nebula that will be carried out in search of the gamma-ray flaring site.
We thank an anonymous referee for his/her comments.
Research partially supported by the ASI grant no. I/040/10/0.
References
- Abdo et al. (2010) Abdo, A.A. et al., 2010, Astrophys. J., 708, 1254.
- Abdo et al. (2011) Abdo, A.A., et al., 2011, Science, 331, 739 (A11).
- Aharonian (2004) Aharonian, F.A., 2004, Very high energy cosmic gamma radiation, (World Scientific Publishing, ISBN 981-02-4573-4).
- Arons (2008) Arons, J., 2008, Pulsars: progress, problems and prospects, Springer Lecture Notes. Neutron Stars and Pulsars, 40 years after the discovery , (ed. W. Becker).
- Atoyan & Aharonian (1996) Atoyan, A.M. & Aharonian, F.A., 1996, MNRAS, 278, 525.
- Balbo et al. (2010) Balbo, M., Walter, R., Ferrigno, C. & Bordas, P., 2010, A&A, in press arXiv:1012.3397v1.
- Bednarek & Idec (2010) Bednarek, W. & Idec, W., 2010, MNRAS, in press arXiv:1011.4176v1.
- Begelman & Kirk (1990) Begelman, M.C. & Kirk, J.C., 1990, ApJ, 353, 66.
- Bell (1978) Bell, A.R., 1978, MNRAS, 182, 147.
- Blandford & Ostriker (1978) Blandford, R. & Ostriker, J.P., 1978, ApJ, 221, L29.
- Blandford & Eichler (1987) Blandford, R. & Eichler, D., 1987, Phys. Rep. 154, 1
- Buehler et al. (2010) Buehler, R., et al., 2010, Astron. Telegram 2861.
- Camus et al. (2009) Camus, N.F., Komissarov, S.S., Bucciantini, N. & Hughes, P.A., 2009, MNRAS, 400, 1241.
- de Jager & Harding (1992) de Jager O.C. & Harding, A.K., 1992, Astrophys. J., 396, 161.
- de Jager et al. (1996) de Jager, O.C. et al., 1996, Astrophys. J., 457, 253.
- Del Zanna et al. (2004) Del Zanna, L., Amato, E. & Bucciantini, N., 2004, A&A, 421, 1063.
- Drury (1983) Drury, L.O., 1983, Rep. Prog. Phys., 46, 973.
- Gallant & Arons (1994) Gallant, Y.A. & Arons, J., 1994, Astrophys. J., 435, 230.
- Hester, Scowen & Sankrit, (1995) Hester, J.J., P. A. Scowen & R. Sankrit et al., 1995, Astrophys. J., 448, 240.
- Hester, Mori & Burrows, (2002) Hester, J.J., Mori, K., Burrows, D. et al., 2002, Astrophys. J., 577, L49.
- Hester (2008) Hester, J.J., 2008, Annual Rev. Astron. Astrophys., 46, 127.
- Kennel & Coroniti (1984) Kennel, C.F. & Coroniti, F.C., 1984, Astrophys. J., 283, 710.
- Keshet & Waxman (2005) Keshet, U. & Waxman, E., 2005, Phys. Rev. Letters, 94, 111102.
- Kirk et al. (2000) Kirk, G.J., Guthmann, A.W., Gallant, Y.A., Achteberg, A., 2000, Astrophys. J., 542, 235.
- Komissarov & Lyutikov (2010) Komissarov, S.S. & Lyubarsky, Y.E., 2004, MNRAS, 349, 779.
- Komissarov & Lyutikov (2010) Komissarov, S.S. & Lyutikov. M., 2010, MNRAS, in press arXiv:1011.1800v1.
- Meyer, Horns & Zechlin (2010) Meyer, M., Horns, D. & Zechlin, H.S., 2010, A&A, in press, arXiv:1008.4524.
- Rees & Gunn (1974) Rees, M.J. & Gunn, J.E., 1974, Mon. Not. R. Astron. Soc., 167, 1.
- Reville & Kirk (2010) Reville, B. & Kirk, J.G., 2010, Astrophys. J., in press, arXiv:1010.0872v1.
- Scargle (1969) Scargle, J.D., 1969, Astrophys. J., 156, 401.
- Spitkovsky & Arons (2004) Spitkovsky, A. & Arons, J., 2004, Astrophys. J., 603, 669.
- Tavani et al. (2009) Tavani M., et al., 2009, Astron. Astrophys., 502, 995.
- Tavani et al. (2010) M. Tavani et al., 2010, Astron. Telegram 2855.
- Tavani et al. (2011) Tavani M., et al., 2011, Science, 331, 736 (T11).
- Weisskopf et al. (2000) Weisskopf, M.C., Hester, J.J., A. F. Tennant, R. F. Elsnor, N. S. Schulz et al., 2000, Astrophys. J., 536, L81.
- Wilson-Hodge et al. (2010) Wilson-Hodge, C.A., et al., 2010 arXiv:1010.2679v1.