Vol.0 (200x) No.0, 000–000
22institutetext: School of Physics and State Key Laboratory of Nuclear Physics and Technology, Peking University, Beijing 100871, China
X-ray and Optical Plateau Following the Main Bursts in Gamma-Ray Bursts and SNe II-P: A hint to the similar late injection behavior?
Abstract
We analyze the emission plateaus in the X-ray afterglow lightcurves of gamma-ray bursts (GRBs) and in the optical lightcurves of Type II superpernovae (SNe IIP) in order to study whether they have similar late energy injection behaviors. We show that correlations of bolometric energies (or luminosities) between the prompt explosions and the plateaus for the two phenomena are similar. The Type II SNe are in the low energy end of the GRBs. The bolometric energies (or luminosities) in prompt phase (or ) and in plateau phase (or ) share relations of and . These results may indicate a similar late energy injection behavior to reproduce the observed plateaus of the plateaus in the two phenomena.
keywords:
gamma-ray burst: general — supernovae: general — methods: statistical1 Introduction
One of the big problems for today’s astrophysicists is to understand the explosive mechanisms of Gamma-ray bursts (GRBs) and core-collapse supernovae. Very interestingly, a radiation plateau in the X-ray/optical bands after GRBs and an optical plateau after initial bursts of SNe IIp are usually detected. We focus on this feature and study the possible relations of the plateaus with the initial bursts for the two kind of events.
On one hand, the early X-ray afterglow of GRB is found to show a canonical behavior (Zhang et al. 2006; Nousek et al. 2006) by X-Ray Telescope (XRT) on Swift. As one of the components in this canonical X-ray light curve, the shallow decay phase, i.e. “plateau”, typically lasts a few thousands of seconds with a temporal decay slope -0.5. Various kinds of models, such as the energy injection model (Rees & Mészáros 1998; Nousek et al. 2006; Zhang et al. 2006), the reverse shock model (Genet et al. 2007), two component model (de Pasquale et al. 2009), the dust scattering model (Shao & Dai 2007) etc, have been proposed to explain this mystic phase. However, a chromatic behavior, i.e., no optical break or spectral evolution at the transition time () from the plateau to the normal decay phase in more than half bursts (Fan & Piran 2006; Liang et al. 2007), is very difficult to interpret within the framework of the external shock models (Fan & Piran 2006; Panaitescu et al. 2006). A suppressed forward shock emission is required for long lasting reverse shock models (Genet et al. 2007; Uhm & Beloborodov 2007). The spectral evolution could not be interpreted by dust scattering effect (Shao & Dai 2005) though the lightcurve can be explained. Also the two-component external shock jets (de Pasquale et al. 2009) would require contrived shock parameters. A long-lasting central engine therefore possibly explains the X-ray plateau phase in GRB afterglow emission and is concerned by the chromatic scenario (Liang et al. 2007). From the observations, the isotropic X-ray energy () for the plateau phase in afterglow of GRB is found to be correlated with the prompt gamma-ray energy and the transition time (Liang et al. 2007). An anti-correlation has been found between the end time of the plateau and the X-ray luminosity () at in the GRB rest frame (Dainotti et al. 2010). By adding a third parameter, i.e. the isotropic -ray energy , Xu & Huang (2011) found a new and significantly tighter three-parameter correlation for gamma-ray bursts with a plateau phase in the afterglow.
On the other hand, plateaus also appear in the light curve of type II Plateau supernovae (SNe II-P). Observationally, SNe II-P are classified as a “plateau” on the slow decay of their early light curves (Barbon et al. 1979), where the luminosity remains nearly constant for a period of 70-100 days (Pskovskii 1978). Their expansion velocities, plateau luminosities and durations show a wide range (Young & Branch 1989; Hamuy 2001). In order to reproduce the plateaus of SNe II-P, a red supergiant progenitor with an extensive H envelope would be necessary (Grassberg et al. 1971; Falk & Arnett 1977). An analytic model (Arnett 1980; Popov 1993) and hydrodynamic models (Litvinova & Nadezhin 1983, 1985) are introduced to explain the light curves of SNe II-P and their correlation with the physical parameters of progenitor stars. It is conventionally accepted that the plateau phase in type II-P supernovae results from the recombination of ionized hydrogen. However, the way of the diffusion photons through the expanding envelope after the shock reaches the surface and the mechanism of energy deposition in the envelope still remains unknown though many efforts have been tried to study the structure and the hydrodynamic of envelope after the core collapse of center star (Arnett 1980; Popov 1993; Litvinova & Nadezhin 1983, 1985; Burrows et al. 2006; Janka et al. 2007; Utrobin & Chugai 2009).
It is known that some long GRBs are associated with core-collapse supernovae (SNe). The discovery of 30 associations between long, soft GRBs and Type Ib/c SNe (see, e.g., the review by Woosley & Bloom 2006 and Hjorth & Bloom 2012) directly tell that their progenitors are massive stars. And these associations result in finding common explosive processes for SNe and GRBs to form rapidly spinning black holes (Woosley 1993), neutron stars (Klu zniak & Ruderman 1998), or even quark stars (Dai & Lu 1998a). And a quantitative relation between the peak spectral energy of GRB and the peak bolometric luminosity of the SN was also presented to clarify that the critical parameter determining the GRB-SN connection is the peak luminosity of SNe (Li 2006). In the standard collapsar model of GRBs, collimation of the outflow is essential for avoiding baryon loading and producing a clean fireball. However, for some GRBs/XRFs, the jet opening angle inferred from the correlation between the jet opening angle of GRBs and the peak energy of their spectra measured in the GRB frame is so large that the burst outflow should be spherical (Li 2006). This is consistent with radio observations on the soft XRF 020903, GRB 060218, and XRF 080109 (Soderberg et al. 2004, 2006, 2008). Two possible scenarios for producing a GRB/XRF from a spherical configuration have been presented (Li 2008).
Comparative studies of plateaus in GRB afterglows and those in SNe II-P can reveal their properties, hydrodynamics and the possible physical process/origins. This work is to show implication about if there is a correlation for the plateau phenomena and if there is a similar hydrodynamical process or energy injection behavior during the plateau phase. In this paper, we analyze the observed parameters for 43 Swift XRT GRB afterglows and those for 11 SNe II-P collected from prior work. A correlation between the energies in prompt phase and (i.e. , where is the duration of plateau phase) in the plateau phase has been found for both sample. The relation between luminosity (i.e. ) and the can also be well fitted with a power law. The power-law indies of both correlations are found to be similar for two samples within the error bar ranges. This may imply a similarity between the dynamic processes or energy injection behavior to reproduce the plateaus during those two kinds of explosions of GRB afterglow and SNe II-P though in different regime. The energy budgets for plateau and (prompt) explosion are correlated for both samples, respectively. The data of samples and the calculation method are presented in §2. The bolometric luminosity is deduced from the fitting of the lightcurve for GRB X-ray afterglow and SNe II-P. In order to compare the properties of plateau, in §3 we present two correlations between the luminosities and , as well as the energies and , for GRB and SNe II-P samples. The results are summarized in §4 with some discussion.
2 Data and Method
The X-ray afterglow of our GRB sample is downloaded from the Swift XRT data archive. The redshift of the bursts in this GRB sample are all detected up to 2010 December. And the sample includes only those XRT light curves with a clear initial steep decay segment, a shallow decay segment and a normal decay segment detected by Swift/XRT. We get a sample of 43 GRBs including the 33 GRBs in the work of Cui et al. (2010) and another 10 bursts after November of 2008 as shown in Table LABEL:tabGRB.
| GRB | ||||||
| (s) | (ks) | (erg/s) | ( erg) | |||
| 050416A | 0.65 | 2.4 | 2.15 | 0.17 0.11 | 0.07 0.05 | 0.01 |
| 050803 | 0.42 | 110 | 1.88 | 1.24 0.09 | 0.03 0.02 | 0.03 |
| 050908 | 3.35 | 19.4 | 3.9 | 0.52 0.14 | 0.27 0.87 | 0.35 |
| 051016B | 0.94 | 4 | 2.82 | 6.85 2.31 | 0.02 0.01 | 0.01 |
| 051109A | 2.346 | 14.3 | 2.33 | 0.58 0.14 | 3.59 1.50 | 0.90 |
| 060108 | 2.03 | 14.4 | 1.91 | 2.23 0.74 | 0.12 0.10 | 0.12 |
| 060210 | 3.91 | 255 | 1.93 | 0.59 0.15 | 15.70 5.08 | 6.91 |
| 060418 | 1.49 | 103.1 | 2.04 | 0.06 0.02 | 3.03 1.28 | 1.57 |
| 060502A | 1.51 | 33 | 2.43 | 5.12 1.51 | 0.18 0.06 | 0.45 |
| 060510B | 4.9 | 275.2 | 1.42 | 13.41 3.25 | 0.07 0.19 | 5.05 |
| 060522 | 5.11 | 71.1 | 1.97 | 0.05 0.02 | 6.13 31.03 | 1.50 |
| 060526 | 3.21 | 298.2 | 1.8 | 1.11 0.28 | 0.53 0.56 | 0.85 |
| 060605 | 3.8 | 79.1 | 1.6 | 0.58 0.15 | 2.06 3.17 | 0.6 |
| 060607A | 3.08 | 100 | 1.79 | 1.20 0.02 | 11.61 3.33 | 1.61 |
| 060707 | 3.43 | 66.2 | 2 | 0.64 0.16 | 1.08 1.34 | 1.19 |
| 060708 | 2.3 | 9.8 | 2.51 | 0.59 0.38 | 0.61 0.40 | 0.20 |
| 060714 | 2.71 | 15 | 2.02 | 0.53 0.10 | 1.49 1.28 | 1.47 |
| 060729 | 0.54 | 116 | 2.71 | 6.95 0.30 | 0.03 0.01 | 0.07 |
| 060814 | 0.84 | 146 | 1.84 | 1.64 0.17 | 0.07 0.05 | 0.94 |
| 060906 | 3.68 | 43.6 | 2.44 | 1.31 0.33 | 0.60 0.45 | 1.83 |
| 061121 | 1.31 | 81 | 1.62 | 1.90 0.44 | 1.11 0.18 | 2.04 |
| 070110 | 2.35 | 85 | 2.11 | 2.13 0.04 | 0.78 0.40 | 0.67 |
| 070306 | 1.497 | 209.5 | 2.29 | 1.63 0.39 | 0.28 0.21 | 1.02 |
| 070318 | 0.836 | 74.6 | 1.4 | 0.10 0.04 | 0.24 0.58 | 0.16 |
| 070721B | 3.626 | 340 | 1.48 | 0.64 0.16 | 5.51 5.93 | 2.91 |
| 071021 | 5 | 225 | 2.12 | 1.81 0.43 | 0.60 1.08 | 1.66 |
| 080310 | 2.4266 | 365 | 2.85 | 1.73 0.43 | 0.41 0.53 | 1.00 |
| 080430 | 0.767 | 16.2 | 2.42 | 0.71 0.17 | 0.05 0.02 | 0.06 |
| 080607 | 3.036 | 79 | 1.68 | 0.08 0.02 | 27.49 15.53 | 14.85 |
| 080707 | 1.23 | 27.1 | 1.81 | 0.61 0.15 | 0.04 0.04 | 0.07 |
| 080905B | 2.374 | 128 | 1.49 | 0.50 0.12 | 7.05 72.07 | 0.75 |
| 081007 | 0.5295 | 10 | 3 | 1.20 0.28 | 0.02 0.01 | 0.02 |
| 081008 | 1.9685 | 185.5 | 1.91 | 1.06 0.26 | 0.64 0.37 | 1.32 |
| 090529 | 2.625 | 100 | 2.5 | 2.59 0.65 | 0.05 0.14 | 0.34 |
| 090618 | 0.54 | 113.2 | 2.11 | 0.66 0.16 | 0.48 0.07 | 2.79 |
| 090927 | 1.37 | 2.2 | 1.64 | 1.15 0.33 | 0.03 0.07 | 0.03 |
| 091029 | 2.752 | 39.2 | 2 | 1.19 0.29 | 0.56 0.36 | 1.27 |
| 100302A | 4.813 | 17.9 | 2.28 | 5.17 1.23 | 0.23 0.26 | 0.38 |
| 100418A | 0.624 | 7 | 4.29 | 8.80 2.08 | 0.002 0.001 | 0.01 |
| 100621A | 0.542 | 63.6 | 2.15 | 1.33 0.32 | 0.08 0.04 | 0.56 |
| 100704A | 3.6 | 197.5 | 2.6 | 1.10 0.27 | 3.36 1.27 | 4.80 |
| 100814A | 1.44 | 174.5 | 1.9 | 14.45 3.38 | 0.26 0.08 | 1.60 |
| 100906A | 1.727 | 114.4 | 2.15 | 0.69 0.17 | 1.33 0.72 | 2.94 |
From this table, we can find that the redshift of our GRB sample is in the range of 0.42 (GRB 050803) to 5.11 (GRB 060522). And the mean value of redshift for these 43 bursts is about 2.3. The starting time () and the mid-point flux () of the plateau segment are obtained by the fitting of the steep-to-shallow decay segment with a smoothed broken power law function (Cui et al. 2010). The end time of this segment () is taken as the break time between the plateau to normal decay phase. The duration of plateau then is . With redshift , the luminosity distance () of the burst can be obtained by adopting cosmological parameters , , and km . Thus the luminosity in mid-point of plateau phase of GRB X-ray afterglow then could be calculated by
| (1) |
Assuming the emission in the plateau phase from the source is mainly from the observed band ,the factor corrects the flux at observational energy band ([] in unit of keV) of an instrument (XRT here, i.e., [=0.3 keV, =10 keV]) to that at a band keV which is
| (2) |
where , (as shown in Table LABEL:tabGRB) is the photon index for photon spectrum (Dainotti et al. 2010). And the error of is deduced by the errors of the best fitting parameters for the plateau phase based on the error transfer formula.
As the opening angles for most of the GRB in our sample are not known and the explosion of SN is thought to be almost isotropic, here we take the gamma-ray isotropic energy of GRB as the total energy of GRB in prompt explosion phase with observed fluence and redshift ,
| (3) |
The factor is applied to convert the observed fluence at observational energy band of an instrument (from to , in unit of keV) to that at a standard band keV in rest frame of GRB (Bloom et al. 2001), which reads
| (4) |
where is photon energy, is the band function defined by Band et al. (1993). Since it’s difficult to get the spectral index for individual GRBs only from BAT observation with narrow energy band, mean spectral indices , and peak energy keV obtained from the statistic are substituted into formula (Preece et al. 2000).
For the type II SNe, three physical parameters: explosion energy , envelope mass and initial radius are mainly determined by the outburst properties: the plateau duration in light curve, absolute V magnitude at mid-plateau point, and the material velocity at the photosphere. With these three observed parameters, Litvinova & Nadyozhin (1983, 1985, LN85 hereafter) have presented three approximation formulae to calculate the three physical parameters mentioned above based on the hydrodynamical models. We collect the observed SNe II-P data with explosion energy and the bolometric luminosity in the mid-point of plateau phase . This bolometric luminosity for our SNe II-P sample comes from the work of Bersten & Hamuy (2009, BH09 hereafter). They derived calibrations for bolometric corrections and effective temperature from BVI photometry and obtained bolometric light curve for a sample of 33 SNe II-P. Within this sample, only 11 SNe with the observed parameters has explosion energy deduced in the prior work (Nadyozhin 2003; Maguire et al. 2010). Our SNII-P sample are composed by these 11 SNe and their properties are presented in Table 2.
| SN | c | References | |||
|---|---|---|---|---|---|
| (km/s) | (day) | (erg/s) | ( erg) | ||
| 1991al | 4484 | 90 | 20.6 | 2.61 | 1, 7 |
| 1992af | 5438 | 90 | 12.5 | 2.46 | 1, 7 |
| 1992ba | 1165 | 100 | 7.5 | 0.57 | 1, 7 |
| 1999br | 1292 | 100 | 1.5 | 0.2 | 1, 7 |
| 1999cr | 6376 | 100 | 9.7 | 0.9 | 1, 7 |
| 1999em | 669 | 120 | 8 | 0.84 | 1, 8 |
| 1999gi | 592 | 115 | 6.7 | 0.64 | 2, 8 |
| 2003gd | 657 | 113 | 7.8 | 1.04 | 3, 8 |
| 2004dj | 132 | 105 | 7.4 | 0.65 | 4, 8 |
| 2004et | 48 | 110 | 10.1 | 0.88 | 5, 8 |
| 2005cs | 463 | 118 | 3.1 | 0.17 | 6, 8 |
-
*
References. (1) Hamuy (2001); (2) Nakano & Kushida (1999); (3)Carnegie Type II Supernovae Survey (CATS); (4) Vink o et al. (2006); (5)Zwitter et al. (2004); (6) Kloehr et al. (2005); (7) Nadyozhin (2003); (8) Maguire et al. (2010)
In BH09’s sample, the zero point of time was taken as the middle point between the plateau and the radioactive tail. We also take this zero point as the end of the plateau phase in this work. A smoothed broken power law is then used to fit the light curve for the data with :
| (5) |
where is the normalized parameter for the fitting. Parameter describes the sharpness of the break. is the time of beginning point of plateau. and present the slopes of components before plateau and plateau. The duration of plateau and the bolometric luminosity at the mid-point of plateau can be obtained finally by the best fittings parameters with and .
3 Results
The properties of GRB sample from the observations and the parameters deduced from the formulae as described in Equations (1) to (4) are presented in Table LABEL:tabGRB: the redshift , the duration of prompt phase , photon index in the afterglow phase , the duration of plateau , the bolometric luminosity at the mid-point of plateau , and the explored energy in the prompt phase . Table 2 lists the properties of 11 SNe II-P included in this study. The selection standards for our SNe II-P sample are these SNe II-P with (1) the measurement of the plateau duration (as shown in Column 3 of Table 2); (2) the bolometric corrections for the lightcurves (e.g. BH09), and then the bolometric luminosity at the mid-point of plateau phase (as shown in Column 4 of Table 2); (3) absolute V magnitude at plateau; (4) the material velocity at the photosphere at mid-plateau point. Based on the parameters as described by (1), (3), and (4), the explosion energy (as shown in Column 5 of Table 2) can be obtained applying the hydrodynamical models as presented by LN85.
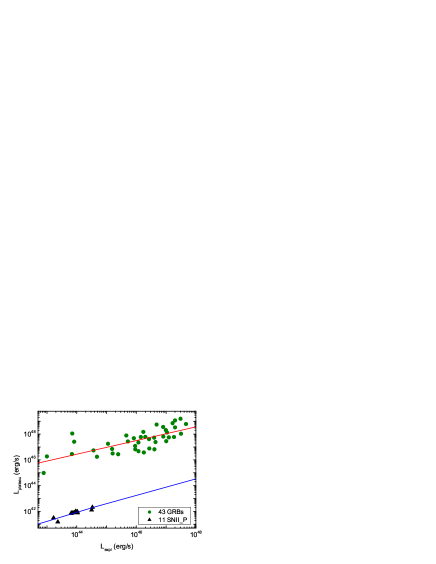
Left panel of Figure 1 shows the correlation of product, , to the energy for GRB X-ray afterglow and SNe II-P samples. Right panel of this figure presents the relation of luminosities and (i.e. ). Linear fit is applied to test the correlations for each sample in the logarithm coordinate and fitting results are presented in Table 3. From this table and Figure 1, we can find that (i.e. ) and as well as and are correlated for two samples, respectively. All the Spearman correlation coefficients are larger than 0.8 with chance probabilities . This implies that the prompt isotropic gamma-ray energy is indeed correlated with the isotropic X-ray energy in the plateau phase (Liang et al. 2007). And the energy budgets for the plateau phase and the (prompt) explosion energy are correlated for both samples. The slopes in the – diagram n the logarithm coordinate for two linear fittings are and . For the sample (SNe II-P+GRB), it’s . Thus we can find that all of slopes, i.e. the power indies in linear coordinate, are very near. And the slopes of the correlation – in the logarithm coordinate are also found to be very closer ( and for GRB and SN II-P samples, respectively. Thus it’s possible that the processes of energy injected to the shock/ejected material in the (prompt) explosion and the plateau phase are very similar.
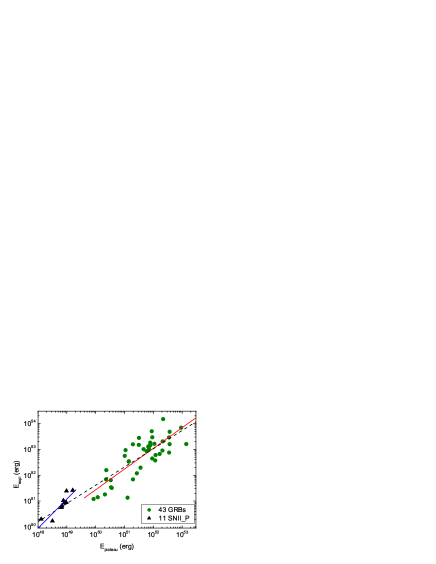
.
| correlation | Sample | Slope | |||
|---|---|---|---|---|---|
| – | GRB | 0.80 (0.09) | 0.81 | 0.47 | |
| SNe II-P | 1.13 (0.20) | 0.89 | 0.18 | 2.93 | |
| SNe II-P + GRB | 0.73 (0.14) | 0.91 | 0.43 | ||
| – | GRB | 0.79 (0.07) | 0.88 | 0.44 | |
| SNe II-P | 0.69 (0.11) | 0.91 | 0.14 | 1.26 |
-
*
: Spearman correlation coefficient
-
*
: Standard deviation
-
*
: Chance probability
The gap () in vertical direction between the best fitting lines of two sample in – diagram might indicate that the different ways or levels to provide energy for explosions during X-ray plateau for GRB afterglow and (prompt) plateau for SNe II-P. That is to say, the central engine activities or energy budgets of GRB and SNe II-P during the plateaus could be different. The energy poured into the ejecta or circum-burst materials for GRB is larger than that for SNe II-P during the plateau phases. Therefore, the plateaus for two samples would manifest in different observational energy bands. For GRB, it exhibits in X-ray band but for SNe II-P in optical band. The very near power law indies of best fittings for GRB and SNe II-P samples considering the error bars may indicate that the hydrodynamic process or the energy injection behavior, e.g. the shockwave propagation in the circum-materials around the burst, during the plateau phase for GRB and SNe II-P could be very similar.
4 Conclusion and discussions
With a comparative work about the plateau in the lightcurves of GRB X-ray afterglow and in the explosion phase of SNe II-P, we find that the (prompt) explosion energy and the product between the mid-point bolometric luminosity in the plateau phase and the duration of plateau , as well as the luminosity and for two samples are correlated, respectively. All the Spearman correlation coefficients for the linear fittings in – and – diagrams with logarithm coordinate are larger than 0.8 with chance probabilities . This implies that the energy injected in the (prompt) explosion and plateau phases are correlated for GRB and type II-P SNe, respectively. The similar power indies of the best fittings for two samples may indicate a similar hydrodynamics during the energy injection in the plateau phases. The gap in – diagram between two best fitting lines might imply that the center engine or the style to poured energy into ejecta of two samples could be different.
The optical data of GRB afterglow have been collected by Li et al. (2012). An optical shallow-decay segment in these GRB afterglow is observed in 39 GRBs. Based on their results, a rough proportionality between the isotropic energy in the prompt phase and isotropic R-band energy in the optical shallow-decay segment is observed in their work. And the best fitting between these two quantities is with chance probability . The isotropic energy is the same as the energy in prompt phase as presented in equation (3) in this work. Compared with the fitting slopes shown in Table (3), we can find that the correlation between and is different from that of and in this work.
The very origin of plateau is quite difficult to identify though it is very likely related to the external shock (e.g. Zhang 2007). However, the spectral index generally does not change across the temporal break (Liang et al. 2007) from the plateau phase to the following decay phase. Thus the models invoking radiation mechanism can be ruled out for the origin of plateau phase. A hydrodynamical or geometrical origin is proposed by Zhang (2007). The continuous injection dynamics was discussed invoking a spin-down pulsar (Dai & Lu 1998a, b; Zhang & Mészáros 2001) with a smoothly varying luminosity (Zhang & Mészáros 2001) and a value is suggested by the observational data (Fan & Xu 2006; Rowlinson et al. 2010). Alternatively, the GRB plateau may be due to the solidification of quark stars (Xu & Liang 2009; Dai et al. 2011), that favor clean fireballs without baryon contamination (Paczynski & Haensel 2005; Cheng et al. 2007).
The hydrodynamical process of envelope ejection is also one of the characteristic features of SNe II-P. Litvinova & Nadezhin (1983, 1985) presented a series of hydrodynamical models of SNe II-P and found that the light curves was determined by the size and mass of unstable progenitor envelope. The usual hypothesis about the SNe explosion can be decoupled into the collapse of the core and the ejection of the envelope (e.g. Grassberg et al. 1971, Woosley 1988). These two parts are independent and the observations are only determined by the propagation process of the shock wave producing from the core collapse through the envelope (Falk & Arnett 1977; Bersten et al. 2011). If the process of shock wave propagation in the envelope is the same as that of external shock involving GRB afterglow plateau, the hydrodynamics of the energy injection about the plateau phenomena may be similar for GRB afterglow and SNe II-P samples. And the timescale of the similarly and underlying hydrodynamical process and energy levels poured from the center object could be different because they are possibly determined by the time and budget of the energy injection from center engine. And thus it’s possible that the plateaus for GRB afterglow and for SNe II-P exhibit in different energy band.
Acknowledgements.
We would like to thank useful discussions at our pulsar group of PKU. This work is supported by the National Basic Research Program of China (Grant Nos. 2012CB821800, 2009CB824800), the National Natural Science Foundation of China (Grant Nos. 11225314, 11103026, 10935001).References
- [Arnett(1980)] Arnett, W. D. 1980, ApJ, 237, 541
- [Band et al.(1993)] Band, D. L., Matteson, J., Ford, L., et al. 1993, ApJ, 413, 281
- [Barbon et al.(1979)] Barbon, R., Ciatti, F., & Rosino, L. 1979, A&A, 72, 287
- [Bersten & Hamuy(2009)] Bersten , M. C. & Hamuy, M., 2009, ApJ, 701, 200
- [Bersten et al.(2011)] Bersten, M. C., Benvenuto, O., & Hamuy, M. 2011, ApJ, 729, 61
- [Bloom et al.(2001)] Bloom, J. S., Frail, D. A., & Sari, R. 2001, AJ, 121, 2879
- [Burrows et al.(2003)] Burrows, D. N., Hill, J. E., Nousek, J. A. et al. 2003, Proc. SPIE, 4851, 1320
- [Burrows et al.(2006)] Burrows, A., Livne, E., Dessart, L., Ott, C. D., & Murphy, J. 2006, New Astron. Rev., 50, 487
- [Chen et al.(2007)] Chen, A. B., Yu, T. H., & Xu, R. X. ApJ, 2007, 668, L55
- [Cui et al.(2010)] Cui, X. H., Liang, E. W., Lv, H. J., Zhang, B. Bi., & Xu, R. X., 2010, MNRAS, 401, 1465
- [de Pasquale et al.(2009)] de Pasquale, M., Evans, P., Oates, S., et al. 2009, MNRAS, 392, 153
- [Dai et al.(2011)] Dai, S., Li, L. X., & Xu, R. X., 2011, Science in China Series G: Physics, Mechanics & Astronomy, accepted(arXiv:1008.2568v1)
- [Dai & Lu(1998a)] Dai, Z. G., & Lu, T., 1998a, PRL, 81, 4301
- [Dai & Lu(1998b)] Dai, Z. G., & Lu, T., 1998b, A&A, 333, L87
- [Dainotti et al.(2010)] Dainotti, M. G., et al. 2010, ApJ, 722, L215
- [Falk & Arnett(1977)] Falk, S. W. & Arnett, W. D. 1977, ApJS, 33, 515
- [Fan & Piran(2006)] Fan, Y. Z. & Piran, T. 2006, MNRAS, 369, 197
- [Fan & Xu(2006)] Fan, Y. Z. & Xu, D., 2006, MNRAS, 372, L19
- [Genet et al.(2007)] Genet, F., Daigne, F., & Mochkovitch, R., 2007, MNRAS, 381, 732
- [Granot et al.(2006)] Granot, J., Königl, A., & Piran, T., 2006, MNRAS, 370, 1946
- [Grassberg et al.(1971)] Grassberg, E. K., Imshennik, V. S., & Nadyozhin, D. K. 1971, Ap&SS, 10, 28
- [Hamuy(2001)] Hamuy, M. 2001, PhD thesis, Univ. Arizona
- [] Hjorth, J. & Bloom, J., Cambridge Astrophysics Series, 2012, 51, 169
- [Janka et al.(2007)] Janka, H. T., Langanke, K., Marek, A., et al. 2007, Phys. Rep., 442, 38
- [] Klu zniak, W., & Ruderman, M. 1998, ApJ, 505, L113
- [] Li, L., Liang, E., Tang, Q., et al. 2012, ApJ, 758, 27
- [] Li, L. X. 2006, MNRAS, 372, 1357
- [] Li, L. X. 2008, AIPC, 1065, 273
- [Liang et al.(2007)] Liang, E. W., Zhang, B. B., & Zhang, B. 2007, ApJ, 670, 565
- [Litvinova & Nadezhin(1983)] Litvinova, I. I. & Nadezhin, D. K. 1983, Ap&SS, 89, 89
- [Litvinova & Nadezhin(1985)] Litvinova, I. Y. & Nadezhin, D. K. 1985, Soviet Astronomy Letters, 11, 145
- [Maguire(2010)] Maguire, K., di Carlo, E., Smartt, S. J. et al. 2010, MNRAS, 404, 981
- [Nadyozhin(2003)] Nadyozhin, D. K., 2003, MNRAS, 346, 97
- [Nousek et al.(2006)] Nousek, J. A., Kouveliotou, C., Grupe, D., et al. 2006, ApJ, 642, 389
- [Paczynski & Haensel(2005)] Paczynski, B. & Haensel, P. MNRAS, 2005, 362, L4
- [Panaitescu et al.(2006)] Panaitescu, A., Mészáros, P., Burrows, D., et al. 2006, MNRAS, 369, 2059
- [Popov(1993)] Popov, D. V. 1993, ApJ, 414, 712
- [Preece et al. (2000)] Preece, R. D., Briggs, M. S., Mallozzi, R. S. et al. 2000, ApJS, 126, 19
- [Pskovskii(1978)] Pskovskii, Iu. P. 1978, SvA, 22, 201
- [Rees & Mészáro(1998)] Rees, M. J. & Mészáros, P., 1998, ApJ, 496, L1
- [Rowlinson et al.(2010)] Rowlinson, A., O’Brien, P. T., Tanvir, N. R., Zhang, B. et al. 2010, MNRASs, 409, 531
- [] Soderberg, A. M. et al., 2004, ApJ, 606, 994
- [] Soderberg, A. M. et al., 2006, Nature, 442, 1014
- [] Soderberg, A. M. et al., 2008, Nature, 453, 469
- [Shao & Dai(2005)] Shao, L. & Dai, Z. G. 2005, ApJ, 633, 1027
- [Shao & Dai(2007)] Shao, L. & Dai, Z. G. 2007, ApJ, 660, 1319
- [Uhm & Beloborodov(2007)] Uhm, Z. L. & Beloborodov, A. M. 2007, ApJ, 665, L93
- [Utrobin & Chugai(2009)] Utrobin, V. P. & Chugai, N. N. 2009, A&A, 506, 829
- [Woosley(1988)] Woosley, S. E. 1988, ApJ, 330, 218
- [] Woosley, S. E. 1993, ApJ, 405, 273
- [] Woosley, S. E., & Bloom, J. S. 2006, ARA&A, 44, 507
- [Xu & Huang(2011)] Xu, M. & Huang, Y. F. 2011, arXiv:1103.3978
- [Xu & Liang(2009)] Xu, R. X. & Liang, E. W., 2009, Science in China Series G: Physics, Mechanics & Astronomy, 52, 315
- [Yamazaki(2009)] Yamazaki, R., 2009, ApJ, 690, 118
- [Young & Branch(1989)] Young, T. R. & Branch, D. 1989, ApJ, 342, L79
- [Zhang & Mészáros(2001)] Zhang, B. & Mészáros, P. 2001, ApJ, 552, L35
- [Zhang et al.(2006)] Zhang, B., Fan, Y. Z., Dyks, J., et al. 2006, ApJ, 642, 354
- [Zhang(2007)] Zhang, B. 2007, Chin. J. Astron. Astrophys., 7, 1