Population study for -ray pulsars: (III) Radiation characteristics and viewing geometry
Abstract
We have performed a Monte-Calro simulation for Galactic population of pulsars and for the -ray observations. We apply two-layer outer gap model, which has been developed by Wang, Takata & Cheng, for the -ray emission process, and study the radiation characteristics as a function of the magnetic inclination angle and the Earth viewing angle (). In our model, the -ray flux and the spectral cut-off energy tend to decrease as the inclination and viewing angles deviate from . The emerging spectrum above 100 MeV becomes soft with a photon index for and for . Our simulation predicts that the pulsars with larger inclination angles () and larger viewing angles () have been preferentially detected by the -ray telescope, and hence the observed pulse profiles of the -ray pulsars have the double peak structure rather than single peak. In the simulation, most -ray millisecond pulsars are categorized as the radio-quiet -ray pulsars, because its radio fluxes are under the sensitivities of the major radio surveys. Even we drastically increase the radio sensitivity by a factor of ten, the number of radio-selected millisecond pulsars detected by the ten years observations is still much less than the expected -ray-selected millisecond pulsars, indicating the radio-quiet millisecond pulsars must contribute to the unidentified sources and/or the -ray background radiations. We argue that -ray pulsars observed with a smaller viewing angle () will appear as low-efficient -ray pulsars. For example, unique radiation properties of the low-efficient -ray pulsar, PSR J0659+1414, can be explained by the present our gap model with a viewing geometry of .
keywords:
1 Introduction
The Large Area Telescope () on board the -ray telescope has increased number of -ray pulsars, and the recent catalog includes more that 60 -ray pulsars, which includes 9 millisecond pulsars (Abdo et al. 2009a,b, 2010a111see also ; Saz Parkinson et al. 2010). Furthermore, the detection of radio millisecond pulsars associated with about 20 unidentified point sources (e.g. Ray 2010; Caraveo 2010; Ranson et al. 2011; Keith et al. 2011) has been reported, suggesting that the millisecond pulsar, as well as the canonical pulsar, is one of the major Galactic -ray source. It can be expected that more -ray pulsars will be added to the list over the mission. The spectral shape and the pulse morphology measured by the have been used to discriminate particle acceleration and -ray emission models; the polar cap model (Ruderman & Sutherland 1975; Daugherty & Harding 1982, 1996), the slot gap model (Arons 1983; Muslimov & Harding 2004; Harding et al. 2008; Harding & Muslimov 2011) and the outer gap model (Cheng, Ho & Ruderman 1986a,b; Hirotani 2008; Takata, Wang & Cheng 2010a). The polar cap model assumes the acceleration region near the stellar surface, and the slot gap and outer gap models assume the emission region extending to outer magnetosphere. The cut-off features of the -ray spectra of the Crab and the Vela pulsars measured by imply that the -ray emission site of the canonical pulsars is located in the outer magnetosphere rather than near polar cap region, which produces a cut-off feature steeper than the observed one (Aliu et al. 2009; Abdo et al. 2009c, 2010d). Romani & Watters (2010) and Watters & Romani (2011) have studied morphology of the pulse profiles of the young pulsars predicted by the our gap and slot gap models, and they argued statistically that the outer gap geometry is more consistent with the observations than the slot gap model. Venter, Harding & Guillemot (2009) found that the observed pulse profiles of several millisecond pulsars detected by the cannot be explained by the outer gap and/or the slot gap models, and proposed a pair-starved polar cap model, in which the particles are continuously accelerated up to high altitude because of the insufficient multiplicity of the pairs.
The high quality data measured by the enables us to perform a detail study for population of the -ray pulsars. Takata et al. (2010a) have studied the relation between the emission properties (luminosity and spectral cut-off energy) and pulsar characteristics (e.g. rotation period and magnetic field). They proposed that the outer gap accelerator model controlled by the magnetic pair-creation process can explain the observed population statistics better than that controlled by the photon-photon pair-creation process (Zhang & Cheng 1997, 2003). Wang, Takata & Cheng (2010) have fitted the observed phase-averaged spectra by using a two-layer outer gap model, in which the accelerator consists of a wide but low charge density main region and a narrow but high charge density screening region. They suggested that the relation between the -ray luminosity () and the spin down power () can be expressed as with for erg/s, while for erg/s. This relation is consistent with the theoretical expectation, i.e. the gap fractional size is determined by , where and are the gap size determined by photon-photon pair-creation process (Zhang & Cheng 1997, 2003) and magnetic pair-creation process (Takata et al 2010a), respectively (c.f. section 3.2). Equating and corresponds to erg/s.
The study for population synthesis of the radio pulsars has been developed by using the detailed modeling of the radio emissions and the radio surveys (e.g. Bailes & Kniffen 1992; Sturner and Demer 1996; Faucher-Gigure and Kaspi, 2006). Also the population study of the -ray pulsars have been developed by several authors (e.g. Gonthier et al. (2002) for the polar cap model, Cheng & Zhang (1998) for the outer gap model, and Story, Gonthier & Harding (2007) for the slot gap model). For example, Story et al. (2007) studied the population of -ray millisecond pulsars with the slot gap accelerator model, and predicted the observations. They predicted that the will detect 12 radio-loud and 33-40 radio-quiet -ray millisecond pulsars. With the Monte-Calro simulation of the outer gap, Takata, Wang & Cheng (2011a,b) have explained the observed distributions of the characteristics of the -ray pulsars detected by the with the six-month long observations. They predicted that at least 80 -ray canonical pulsars have a -ray flux exceeding the sensitivity of the six-month observations, suggesting the present observations have missed many -ray emitting pulsars. Watters & Romani (2011) simulated the Galactic distribution of the young -ray pulsars, and compared the simulated pulse morphology with the results. They argued statistically that the outer gap model explains the distributions of the pulse morphology (e.g. the phase-separation of the two peaks) measured by the better than the slot gap model. The population studies (e.g. Kaaret & Philip 1996; Cottam, Jean Faucher-Gigure & Loeb 2010; Takata et al. 2011b) have also pointed out that unidentified pulsars, in particular the millisecond pulsars located at high-Galactic latitudes will associate with the unidentified sources (Abdo et al. 2010b), and will contribute to the -ray background radiations.
In the our previous studies (Takata et al. 2011a,b), we ignored the dependence of the radiation characteristics on the viewing geometry (i.e. the magnetic inclination angle and the Earth viewing angle measured from the pulsar’s rotation axis), and focused on the distributions of the properties (e.g. the rotation period and magnetic field) of the -ray pulsars. However, the observed radiation characteristics, such as the flux, spectral cut-off energy and pulse profile, must be affected by the viewing geometry. To perform a more solid study on the population, which is compared with the high-quality data, it is required a three-dimensional model that takes into account the dependence of the radiation characteristics on the viewing geometry.
In this paper, we develop a Monte-Carlo study for the population of the -ray pulsars with the radiation model that takes into account the dependence on the viewing geometry. In section 2, we review the Monte-Carlo simulation for the population of the -ray pulsars. We discuss our outer gap model in section 3. In section 4.1, we discuss the dependence of the radiation characteristics on the viewing geometry. In section 4.2, we compare the results of the Monte-Calro simulation with the six-month long observations. We also show the expected population of the -ray pulsars if the observations continue five-years or ten-years. In section 5, after summarizing our simulation results, we discuss the viewing geometry of PSR J0659+1414, which is known as a low efficient -ray pulsar.
2 Monte-Carlo simulation for the pulsar population
In this paper, we denote the canonical pulsar and the millisecond pulsar as CP and MSP, respectively. We assume that the birth rates of the CPs and the MSPs are and (Lorimer et al. 1995, Lorimer 2008), respectively, and we ignore the millisecond pulsars in globular clusters. The birth location is determined by the spatial distributions given by (Paczynski 1990),
| (1) |
where is the axial distance from the axis through the Galactic centre perpendicular to the Galactic disk and is the distance from the Galactic disk, kpc and with kpc. In addition, we apply pc for the CPs and pc for the MSPs, respectively.
To obtain current position of each simulated pulsar, we solve the equation of motion from its birth to the current time. The equation of motion is given by
| (2) |
| (3) |
and
| (4) |
Here is the azimuthal component of the velocity, is the total gravitational potential, where , and are spheroidal, disk and halo components of the Galactic gravitational potential, and are given by
| (5) |
where and , , kpc, , kpc, kpc, and , while for the halo component
| (6) |
where kpc and (c.f. Burton & Gordon 1978; Binney & Tremaine 1987; Paczynski 1990). The Lagrangian in units of energy per unit mass is given by
| (7) |
where is the velocity.
For the initial velocity of each modeled pulsar, we assume random isotropic direction of the velocity, and assume magnitude drawn from a Maxwellian distribution with a characteristic width of km/s for the CP and km/s for the MSP (c.f. Hobbs et al. 2005), namely,
| (8) |
2.1 Pulsar characteristics
In this section, we describe how we calculate the current value of the various characteristics of the simulated pulsars.
2.1.1 Canonical pulsars
For canonical -ray pulsar, which is born soon after the supernova explosion, the true age is more or less equal to the spin down age , where and are the rotation period and its time derivative. This allows us to calculate the present distributions of the pulsar characteristics from the initial distributions.
For the Crab pulsar, the initial period is estimated to be ms. A short birth rotation period is also expected for the young 16ms pulsar PSR J0537-0691 (Marchall et al. 1998), suggesting most pulsars were born with ms. There is a good evidence that some pulsars were born with a longer initial period (e.g. 62 ms of PSR J1911-1925, Kaspi et al. 2001). However, we found that the distribution of initial rotation period does not affect much to the results of the following Monte Carlo simulation. For example, we compared the results of two simulations with different distribution of the initial period; one is that all simulated pulsars are randomly distributed in the range ms, and other is that 70 % of pulsars are distributed at ms and 30 % are ms. In such a case, we could not see any significant difference in the populations of the simulated -ray pulsars. The difference in the simulated distributions of the -ray pulsars becomes significant if we assume that of new born pulsars is distributed with the initial period of ms. Because we do not know well the exact distribution of the initial period, we randomly choose the initial period in the narrow range ms, which provides a more consistent result of our simulation with the observations.
We assume a Gaussian distribution in for the initial distribution of the stellar magnetic field measured at the magnetic equator,
| (9) |
In this study, we apply and . Because the canonical -ray pulsars are younger than 10 Myr, we ignore evolution of the stellar magnetic field, which may be important for the neutron star with an age older than 10 Myr (Goldreich & Reisenegger 1992; Hoyos, Reisenegger & Valdivia, 2008).
With a constant stellar magnetic field in time, the period evolves as
| (10) |
where cm is the stellar surface and is the neutron star momentum of inertial. In addition, we artificially assumed that the magnetic inclination angle does not evolve with the spin down age, while a decreases on the spin down time scale has been pointed out (e.g. Davis & Goldstein 1970; Michel 1991; Tauris & Manchester 1998). The time derivative of the rotation period is calculated from
| (11) |
2.1.2 Millisecond pulsar
We assume that all MSPs are born through the so called recycled process, in which the accretion of the matter from the low mass companion star spins up the neutron star. It implies that the true age of the binary system is different from the spin down age of the MSP. However, we expect that the Galactic distribution does not depend on the spin down age of the MSPs. With the typical velocity of the observed MSPs , km/s, it is expected that the displacement of the MSPs (or binary system) with the typical age, Myr, becomes larger than the size of the Galaxy. With the relatively slow velocity, km/s, however, the MSPs remain bound in the Galactic potential and hence their Galactic distribution does not depend on the spin down age.
The initial rotation period of MSP is related with the history of the accretion process after the decaying stage of the magnetic field (Campana et al. 1999; Takata, Cheng and Taam 2010b). However, the description of the transition from an accretion powered to the rotation powered phase is not well understood due to the complexities in the description of the interaction between the magnetosphere of a neutron star and its accretion disk (Romanova et al. 2009). Furthermore, the true age of the MSP after the supernova explosion in the binary system is different from the spin down age of the MSP. These theoretical uncertainties make it difficult to obtain the present distributions of the MSP properties from the initial distributions.
In this paper, we assign the “current” pulsar properties for each simulated MSP, instead of modeling from the initial distributions; namely, we (1) randomly select the age of the simulated MSP up to Gyr, (2) shifts the simulated MSP from its birth location to the current location, and (3) assign the parameters of the MSP following the observed distributions. We assign the period time derivative () and the stellar magnetic field () following the observed distribution (Manchester et al. 2005). From the assigned period time derivative and the stellar magnetic field, the current rotation period and the spin down age are calculated from
| (12) |
and
| (13) |
respectively (Lyne & Graham-Smith, 2006). Here is the stellar magnetic field in units of G, and are the rotation period in units of 1 millisecond and its time derivative in units of , respectively. In fact, above process can provide a consistent Galactic distribution of the radio MSPs with the observations (c.f. Takata et al. 2011b).
2.2 Radio emissions
Using the empirical relation among the radio luminosity, rotation period, and period time derivative, the distribution of the radio luminosity at 400 MHz is expressed by (Narayan & Ostriker 1990)
| (14) |
where with , and is the luminosity in units of . Here is a scaling factor to adjust the observed distribution, and (or 0.05) for the CPs (or MSPs). The radio flux on Earth is given by , where is the distance to the pulsar. We scale the simulated 400 MHz luminosity to the observational frequency using a typical photon index for the CPs and 1.8 for the MSPs, respectively (Kramer et al. 1997, 1998).
We take into account the beaming of the radio emission. For the CPs, we apply the half-angle, which is measured from the magnetic axis, of the radio cone studied by Kijak and Gil (1998, 2003),
| (15) |
where
where is the period time derivative in units of , and is the radio frequency in units of GHz. For the MSPs, the half-angle does not depend on the frequency and is approximately described as (Kramer & Xilouris 2000),
| (16) |
where is randomly chosen in the range . The radio emission can be detected by observer with a viewing angle between max(,) and min(, ), where or , and is the inclination angle between the rotation axis and the magnetic axis.
We use the ten radio surveys (Molongo 2, Green Band 2 and 3, Arecibo 2 and 3, Parkes 1, 2 and MB, Jordell Bank 2 and Swinburne IL), whose system characteristics are listed in table 1 of Takata et al (2011a) and the references therein. To calculate the dispersion measure, we apply the Galactic distribution of electrons studied by Cordes & Lazio (2002).
3 -ray emission model
The pulsar rotation energy, which is thought to be essential energy source of the -ray emission, can be released by both the current braking torque and the magnetic dipole radiation. According to the analysis of the force-free magnetosphere done by Spitkovsky (2006), the spin down power depends on the inclination angles as ; in other words, changes only by a factor of 2 with the inclination angle. In the present Monte-Carlo study, therefore, we ignore the dependence of the spin down power on the inclination angle, and apply the conventional expression that .
3.1 Two-layer outer gap model
The outer gap dynamics is controlled by the pair-creation process, which produces a charge distribution in the trans-field direction (Cheng, Ho & Ruderman 1986a,b; Takata, Shibata & Hirotani 2004). Wang et al. (2010, 2011) argued that the outer gap should be approximately divided into two layers, i.e. the main acceleration region starting from the last-open field lines and the screening region lying at the upper part of the gap. In the main acceleration region, the charge density is 10% of the Goldreich-Julian value (Goldreich & Julian 1969), and a strong electric field accelerates the electrons and positrons up to the Lorentz factor of . The accelerated particles emit several GeV photons via the curvature radiation process. In the screening region, the large number of pairs created by the pair-creation process starts to screen out the gap electric field. The curvature radiation from the screening pairs produces mainly 100 MeV photons.
A simple description of the electric field structure inside the two-layer outer gap is discussed in Wang et al. (2010, 2011). We denote , and as the coordinates along the magnetic field line, perpendicular to the magnetic field line in the poloidal plane and in the magnetic azimuth, respectively. We expect that the particle number density increases exponentially near the boundary () between the main acceleration and screening regions (Cheng et al. 1986a,b), and that the charge density is almost constant in the screening region (Hirotani 2006). Hence, we approximately describe the distribution of the charge density in the -direction with the step function as follows
| (17) |
where,, and correspond to the last-open field line and the upper boundary of the gap, respectively. For simplicity, we define the boundary between main acceleration region and the screening region, i.e. , with a magnetic field line with such approximation that is constant along the magnetic field line. The present model predicts that the charge density in the screening region should be proportional to the Goldreich-Julian charge density (Wang et al. 2010). This situation will be satisfied because of a lot of the pairs created by the pair-creation process in the screening region. In the main acceleration region, because the number density is much smaller than the Goldreich-Julian value, its distribution along the magnetic field line does not important for the electric field distribution. Therefore, we approximate that for both main acceleration and screening regions, where
| (18) |
We assume that and so that for the main acceleration region and for the screening region.
To obtain the typical strength of the electric field in the gap, we find the solution of the Poisson equation for each azimuthal angle (c.f. Wang et al. 2010, 2011),
| (19) |
where is the electric potential of the accelerating field. Here we assumed that the derivative of the Potential field in the -direction is much larger than that of -direction, and of -direction.
In this paper, we neglect the -dependence of the Goldreich-Julian charge density, and approximate the Goldreich-Julian charge density as (Cheng et al. 1986a,b), where and are the angular frequency of the pulsar and the curvature radius of the field line, respectively. The boundary conditions on the lower () and upper () boundaries are given by
| (20) |
respectively. Imposing and are continuous at the boundary , we obtain the solution as
| (21) |
where
and . The accelerating electric field, , is writted as
| (22) |
where we used the relations of the dipole field that , , , and approximated that .
On the upper boundary, we anticipate that the total potential field (co-rotational potential + non co-rotational potential) in the gap is continuously connected to the co-rotational potential field outside the gap. This screening condition is described by
| (23) |
This condition gives the relation between and as
| (24) |
In this paper, we do not consider the azimuthal distribution of the dimensionless charge density and , because we discuss the general properties of the -ray emissions. The azimuthal structure will be important for explaining the detailed observed properties, such as the existing of the third peak in the pulse profile of the Vela pulsar measured by the , and the energy dependence of the pulse phase of the third peak (c.f. Wang et al. 2011).
The typical Lorentz factor of the accelerated particles can be estimated by force balance between the electric field and the curvature radiation drag force as
| (25) |
The spectrum of the curvature radiation emitted by the individual particle is written as
| (26) |
where with and
where is the modified Bessel function of order 5/3. A -ray spectrum measured on Earth may be expressed by (e.g. Hirotani 2008)
| (27) |
where is the particle number density, represents the radius to the emission point, from which the emission is measured by the observer, is the area of the calculation grid in perpendicular to the magnetic field lines. The integrated energy flux between 100 MeV and 300 GeV can be calculated from
| (28) |
In the gap, the curvature photons are emitted in the direction of the particle motion, which may be described as (Takata, Chang & Cheng 2007)
| (29) |
where the first term represents the motion along the magnetic field line, is calculated from the condition that , and the second term is the co-rotation motion. The emission direction measured from the rotation axis (i.e. viewing angle) and the pulse phase are calculated from (Yadigaroglu 1997)
| (30) |
where , is the unit vector in the direction of the rotation axis, and is the azimuthal angle of the emission direction.
3.2 Outer gap geometry
In this paper, we adopt a rotating vacuum dipole field as the magnetosphere, and we assume that a strong emission region extends between the null charge surface () of the Goldreich-Julian charge density and the radial distance , where is the light cylinder radius. The electrodynamic studies have pointed out that the gap current can shift the inner boundary toward the stellar surface (e.g. Takata et al. 2004). However, because it is expected that the curvature radiation below the null charge surface appears with a emissivity much smaller than that above the null charge surface (e.g. Hirotani 2006), we ignore its contribution to the calculation.
We define the fractional gap thickness measured on the stellar surface as,
| (31) |
where is the polar cap radius. Note because the electric field is proportional to , it can be found that .
Zhang & Cheng (1997, 2003) have argued a self-consistent outer gap model controlled by the photon-photon pair-creation process between the curvature photons and the X-rays from the stellar surface. They estimated the gap fraction as
| (32) |
for the CPs and
| (33) |
for the MSPs. Here is the distance (in units of cm) from the stellar surface to the position where the local magnetic field is comparable to the dipole field, and it will be cm.
We note that Zhang & Cheng (1997, 2003) estimated the gap fraction by a completely vacuum electric field . With the same gap fraction, the solution described by equation (22) gives an electric field at least a factor of four smaller than that used in Zhang & Cheng (1997, 2003). This difference can be important for the typical energy of the curvature radiation (), because . In other words, if we derive the gap fraction from the pair-creation condition that , where is the X-ray photon energy, the present model predicts a fractional gap thickness larger than that of Zhang & Cheng (1997, 2003). In this paper, reducing by a factor of four for the electric field in the model of Zhang & Cheng (1997, 2003), we apply the gap fraction increased by a factor of from those in equations (32) and (33).
Takata et al. (2010a) proposed that the outer gap model can be controlled by the magnetic pair-creation process taken place near the stellar surface. They argued that half of particles created in the gap or injected particles into the outer gap at the outer boundary return to the stellar surface, and these returning particles emit MeV photons near the stellar surface. A good fraction of 100 MeV photons can make pairs by the magnetic pair creation process. They argued that if the magnetic field lines near the surface, instead of nearly perpendicular to the surface, are bending side-wards due to the strong local field, the pairs created in these local magnetic field lines can have a pitch angle, which is defined by the angle between the directions of the particle’s motion and of the field line, smaller than 90∘, which results in an outgoing flow of pairs, and hence the pairs control the size of the outer gap. We also note that the outgoing flow may be produced by the Compton scattering. With this model, the fractional gap thickness is estimated as
| (34) |
where is the parameter characterizing the local parameters, i.e., and , which are the local magnetic field in units of G and the local curvature radius in units of cm, respectively. By fitting the emission characteristic of the -ray pulsars observed by the , they estimated as for the CPs and for the MSPs. When the fractional gap thickness is smaller (or larger) than , the magnetic pair-creation (or photon-photon pair-creation) process controls the gap thickness.
We note that the outer gap should only exist between the last-open field lines and the critical magnetic field lines that have the null charge points at the light cylinder. Figure 1 shows the polar angle, which is measured from the magnetic axis, of the polar cap rim (, solid line) and of the foot points of the critical field lines (, dashed line) as a function of the magnetic azimuth. The maximum gap fraction is defined by , and is represented by the dotted-line in Figure 1. The azimuthal angle in Figure 1 corresponds to the plain spanned by the rotation axis and the magnetic axis. In this paper, we anticipate that the azimuthal expansion of the active gap is limited as and .

4 Results
In this paper, we present the results of the two-layer outer gap model by using the ratio of and the dimensionless charge density in the main region of . The value is chosen because Wang et al. (2010) fitted the phase-averaged spectra of mature pulsars by using . The value is slightly larger than used in Wang et al. (2010), but reproduces a more consistent simulated population with the observations. The gap height and the charge density in screening region are calculated from equations (31) and (24), respectively.
4.1 Dependence on the inclination and viewing angles
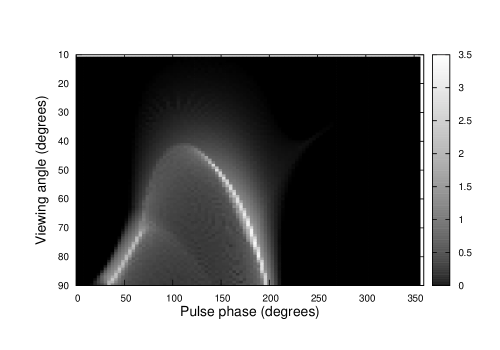
The dependence of the characteristics of the calculated -ray spectra on the inclination angle and the viewing angle are summarized in Figures 28. Figure 2 shows the phase plot of the photons having the energies larger than 100 MeV. The result is for , G and .
4.1.1 -ray flux
The left panels in Figures 3 and 4 show the -ray flux ( MeV) as a function of the viewing angle and of the inclination angle . The vertical line (y-axis) represents the fractional -ray flux, which is defined by the flux measured by (c.f. Takata et al. 2011). Here we calculated the rotation period from G and the gap fraction . We can see that the calculated flux tends to decrease as the line of sight approaches to the rotation axis, where . In the sky map of Figure 2, we see that the large viewing angle ( can encounter more intense emission region, whereas the small viewing angle () will encounter the less intense region or even miss the emission region. With the outer gap geometry running from the null charge surface to the light cylinder, the observer with a smaller viewing angle () may miss the emissions from higher latitudes () and measure the only emission from the lower part of the gap (). Because the accelerating electric field vanishes at the lower boundary of the gap (), the Lorentz factor of the accelerated particles and the resultant emissivity of the curvature radiation around lower boundary of the gap are significantly decreased. Consequently, a smaller viewing angle tends to measure a smaller flux of the curvature radiation. In the left panels of Figures 3 and 4, we also see the tendency that the decrease of the fractional flux with the decrease of the viewing angle is more gradual for larger inclination angle. This is because the emission from the outer gap with larger inclination angle covers more wide region of the sky. These dependences of the -ray flux on the viewing geometry predict that the has preferentially detected the pulsars with larger inclination angles and larger viewing angles near (c.f. section 4.2.2).
The right panels in Figure 3 and 4 summarize the dependence of the fractional -ray flux on the gap fractional thickness. We can see that the factional flux decreases as the gap fraction increases. This dependence is related with the expansion of the outer gap in the azimuthal direction. In the present calculation, we have assumed that the azimuthal expansion of the active gap is limited as and . As the dotted line in Figure 1 shows, acquires a maximum value near the magnetic meridian, where , and tends to decrease as the azimuthal angle deviates from . This implies that the width of the active gap in the azimuthal direction narrows with the increase of the gap fractional thickness, . Consequently, the fractional flux tends to decrease as the gap fraction increases.
4.1.2 Cut-off energy
The cut-off energy is calculated as the peak energy in the spectral energy distribution of the emission from the main acceleration region. Figures 5 and 6 show the dependence of the cut-off energies for the CPs and for the MSPs, respectively, on the viewing geometry. The vertical axis represents the cut-off energy measured by , where with . Figures 5 and 6 show that the cut-off energy decreases with the decrease of the viewing angle. As we argued in section 4.1.1, a large viewing angle can encounter the emission from the strong accelerating electric field region at the middle of the gap ), whereas the observer with a small viewing angle measures the emission from the small electric field region near the lower boundary ). As a result, the cut-off energy in the spectrum decreases with the decrease of the viewing angle. We can also find in Figures 5 and 6 that the fractional cut-off energy does not depend much on the fractional gap thickness, .
4.1.3 Photon index
We applied the minimized- method to fit the spectrum between 100 MeV and the cut-off energy with a single power low form. Figures 7 and 8 show the dependence of the photon index for the CPs and MSPs, respectively, on the viewing geometry. Our model predicts that the spectral shape is relatively soft with a photon index for larger viewing angle () and hard with for smaller viewing angle (). In Figures 7 and 8, the transition from soft to hard spectra occurs in a narrow range of the viewing angle. In the present two-layer model, the screening region and the main acceleration region produce the -ray photons with a typical energy of MeV and GeV, respectively. For the viewing angle closer to , because the observed -ray radiation consists of the emissions from both main acceleration and screening regions, the emerging spectrum becomes soft with a photon index of above MeV. For a smaller viewing angle, on the other hand, because the emission of the screening region is missing, the emission from the only main acceleration region contributes to the spectrum. In such a case, the emerging spectrum has a photon index above 100 MeV, which closes to a mono-energetic curvature spectrum.


4.2 Results of the Monte-Carlo simulation
| six-months | five-years | ten-years | ||||
|---|---|---|---|---|---|---|
| CPs | ||||||
| Ra. Sen. (x 1) | 40 | 39 | 56 | 138 | 59 | 182 |
| Ra. Sen. (x 2) | 51 | 34 | 77 | 123 | 81 | 163 |
| Ra. Sen. (x 10) | 72 | 28 | 130 | 90 | 145 | 120 |
| Beaming | 76 | 28 | 155 | 79 | 177 | 102 |
| six-months | five-years | ten-years | ||||
|---|---|---|---|---|---|---|
| MSPs | ||||||
| Ra. Sen. (x 1) | 10 | 52 | 14 | 200 | 16 | 284 |
| Ra. Sen. (x 2) | 16 | 48 | 26 | 190 | 29 | 274 |
| Ra. Sen. (x 10) | 45 | 32 | 82 | 152 | 94 | 227 |
| Beaming | 106 | 11 | 321 | 41 | 438 | 62 |
In this section, we present the results of the Monte-Carlo simulation, in which we assume the birth rates of the CPs and of the MSPs are 0.015 per year and per year, respectively. We also assume that the viewing angle and the inclination angle are randomly distributed. For the inclination angle close to , in which the null charge points are located on or very close to the stellar surface, it may cause a numerical error when we search the last-open field lines of the rotating vacuum field. To avoid it, we limit the inclination angle below . Because a comparison between the simulated and the observed distributions for the various properties (e.g. rotation period and magnetic field) of the -ray pulsars was done in Takata et al. (2011a,b), we focus on the characteristics of the -ray radiations with the viewing geometry.
For the sensitivity of the observations, we refer the first pulsar catalog (Abdo et al. 2010a). For the radio-selected pulsars, the archived the sensitivity (or ) for the galactic latitudes (or ) with the six-month long observations. For the CPs, the six-month data allow us to detect the pulsed period by blind search, if the -ray flux is larger than for and for . For the MSPs, because there are no such detections of the -ray-selected pulsar so far, we cannot simulate the sensitivity of the blind search. In this paper, therefore, we simulate the population of the -ray-selected MSPs with the sensitivity of the blind search of CPs.
4.2.1 Viewing geometry
Figures 9 and 10 plot the inclination angle () and the viewing angle () for the simulated 100 canonical and millisecond -ray pulsars, respectively. The filled-circles and the boxes represent the radio-selected and -ray-selected -ray pulsars, respectively. For the CPs, we can see in Figure 9 that the radio-selected and -ray-selected pulsars distribute at different region in plane. Specifically, the radio-selected CPs group together around the line . This is because we have assumed that the magnetic axis is the centre of the radio cone, indicating that the radio emission can be detected by observer with a viewing angle . The scattering from the line is related with the width of the radio cone. For example, if we assume a narrower cone than that of equation (15), the amplitude of the scattering is reduced. Figure 9 also shows that the detected -ray pulsars are mainly distributed with a viewing angle . These results are consistent with the results of Watters & Romani (2011).
Unlike with the CPs, the distributions of the radio-selected and -ray-selected MSPs on the - plane are overlapped each other. This is because the width of the radio beam described by equation (16) covers almost whole sky. We note that most -ray-selected MSPs in the simulation irradiate the Earth with the radio emissions, but the radio fluxes are lower than the sensitivity of the simulated radio surveys (c.f. Tables 1 and 2).
In Figures 9 and 10, we can see that no -ray pulsars are detected with a smaller inclination angles () and a smaller viewing angles (). This is because the -ray flux decreases as the viewing angle and/or the inclination angle decrease, as we discussed in section 4.1 (c.f. Figures 3 and 4). Hence, our simulation results predict that the pulsars with larger inclination and larger viewing angles () have been preferentially detected by the six-month long observations.
4.2.2 Population
Tables 1 and 2 show the simulated population of the CPs and MSPs, respectively, with the six-month, five-year and ten-year long observations. Here we scale the sensitivity of the observations as , where is the length of the observation time. In addition, the second lines (“Ra. Sen. (x2)”) and the third lines (“Ra.Sen. (x10)”) in the tables show the results for the ten radio-surveys but we increase the sensitivities by a factor of two and of ten, respectively, and the fourth lines (“Beaming”) show the population associated with the only beaming effect of the radio emission.
With the previous radio surveys (first line in Table 1), the present simulation shows that 40 radio-selected and 39 -ray-selected CPs can be detected by the six-month observations, indicating that the present model predicts more -ray pulsars than the observations ( for both radio-selected and -ray-selected -ray pulsars). To explain the difference between the simulated and observed numbers, the several reasons will be expected; (1) the sensitivity will become much worse at the Galactic plane, and (2) the -ray emissions from the pulsars will be missed by source confusion with the complex regions and the unresolved sources that are not modeled in the diffuse backgrounds. The predicted number 10 of the radio-selected -ray MSPs is consistent with the observed number . The present model predicts 56 (or 59) radio-selected and 138 (or 182) -ray-selected CPs can be detected by the with five-year (or ten-year) observations. For the MSPs, 14 (or 16) radio-selected -ray pulsars will be detected by the with five-year (or ten-year) observations.
We see in the first lines of Tables 1 and 2 that the simulated numbers of radio-selected -ray CPs and MSPs increase only 20 and 10 sources, respectively, over even ten-year observations. This implies that most presently known radio pulsars ( for CPs and for MSPs) might not be discovered by the . For the -ray-selected pulsars, on the other hand, the simulation predicts that the can detect about 140 CPs for about five-year observations. We note that the predicted number of the radio-loud (or radio-quiet) -ray pulsars really depends on the sensitivities of radio surveys, as Tables 1 shows; for example, the predicted number of the -ray-selected CPs after ten-year of the observations decreases from 182 to 120 if the sensitivities of the radio surveys increases by a factor of ten. This indicates that a deep radio search may find more radio-emissions from the -ray-selected pulsars, such as LAT PSRs J1741-2054 and J2032+4127 (Camilo et al. 2009). Table 1 also shows if the sensitivities of the radio surveys increase by a factor of ten, the ratio of the radio-loud and radio-quiet -ray pulsars is almost determined by the beaming effect of the radio emissions.
For the MSPs (Table 2), most simulated pulsars are categorized as the -ray-selected pulsars with the previous sensitivities of the radio surveys, although the has not confirmed the radio-quiet MSPs. We argue that it may be difficult to identify radio-quiet MSPs, because the detection of the rotation period by the blind search is much harder than that of the CP. Furthermore, if the MSP is in binary system, the effects of the orbital motion on the observed rotation period make it even harder to confirm the millisecond rotation period by the blind search. Takata et al. (2011b) discussed that the -ray-selected MSPs in the simulation correspond to the unidentified sources located at higher Galactic latitudes.
We note that the radio cones from MSPs are quite huge so that most MSPs irradiate the Earth with the radio emissions, as the bottom line in Table 2 shows. This implies that more radio MSPs associated with the unidentified sources will be detected by the future radio surveys, such as the discovery of new 20 radio MSPs associated with the unidentified sources (Ray 2010; Caraveo 2010; Ransom et al. 2011; Keith et al. 2011). As third line in Table 2 shows, however, even we drastically increase the radio sensitivity by a factor of 10, the number of radio-selected MSPs detected by 10 year observations can increase from 16 to 94, it is still much less than the expected 227 -ray-selected millisecond pulsars. Unless the sensitivity of the blind search is improved, the most -ray MSPs will not be identified and will contribute to the unidentified sources and/or the -ray background radiations.
4.2.3 -ray radiation characteristics
Figures 11-13 show the radiation characteristics (-ray luminosity, cut-off energy and photon index, respectively) versus the characteristics (the spin down power or the magnetic field strength at the light cylinder) for the -ray pulsars with the six-month observations. In those figures, we plot the data with errors taken from Abdo et al. (2010a) and Saz Parkinson et al. (2010), and present the simulated pulsars in the sub-figures. For the simulated pulsars, we randomly choose 200 simulated -ray pulsars (except for the -ray-selected MSPs).
In Figure 11, the -ray luminosity is calculated from , where is the distance, and the histograms of the values of the -ray luminosity are projected along the right-hand axis. The solid and dashed histograms represent the distributions for the simulated and observed -ray pulsars, respectively. The present model predicts that most -ray CPs have a spin down power of and a -ray luminosity of , while MSPs have a and , which are consistent with the observations.
In Figure 11, the spin down power and the -ray luminosity of the simulated pulsars can be related as with for and for . In the present emission model, the -ray luminosity is proportional to as Figure 3 and 4 indicate (c.f. Takata et al. 2011b). The change of the slope is caused by switching gap closure process between the photon-photon pair-creation process and the magnetic pair-creation process. As the equations (32)-(34) show, the gap fraction depends on the rotation period and the magnetic field as for the photon-photon pair-creation process and for the magnetic pair-creation process. These relations imply that the -ray luminosity depends on the spin down power as for the photon-photon pair-creation process and for the magnetic pair-creation process. Equating (32) and (34) corresponds to . The change of the slope has been found by Wang et al (2010), who used the two-layer outer gap model to fit the phase-averaged spectrum of the mature -ray pulsars observed by the .
Although the general trend of the relation between the -ray luminosity and the spin down power is explained with a simple form , we can see in Figure 11 that some simulation samples deviate from the relation. For example, some simulated pulsars with a spin down power of have a -ray luminosity of , which is about two or three order smaller than the typical value of . We emphasize that this low efficiency of the -ray emission is mainly caused by the effects of viewing angle. The pulsars lying on the relation are observed with viewing angles of , whereas those (“apparently”) low-efficient -ray pulsars are observed with smaller viewing angles. Although the flux depends on also the inclination angle, the flux is more sensitive to the viewing angle than the inclination angle, as Figures 3 and 4 show. We note that lower efficient -ray pulsars tend to locate closer to the Earth.
Figure 12 shows the cut-off energy versus the magnetic field at the light cylinder, . The symbols and the histograms correspond to same cases as Figure 11. As sub-figure in Figure 12 indicates, the present simulation predicts that most -ray CPs and MSPs have a magnetic field at the light cylinder of G and G, respectively, and have a cut-off energy smaller than GeV. These features will be consistent with the observations. In the figure, some simulated CPs have a cut-off energy significantly smaller than the typical value GeV. As well as the case of the -ray luminosity, this deviation from the typical value is cause by the effects of the viewing angle, as Figures 5 and 6 imply. In Figure 12, our simulation predicts that the typical cut-off energy (1-1.5 GeV) of the MSPs is smaller than that ( GeV) of the CPs. It is difficult to discuss the difference in the observed cut-off energies between the CPs and the MSPs, because of the large observational errors.
Figure 13 represents the photon index versus the spin down power. We can find that the model distribution of the photon index has two peaks at and , and the observed distribution (dashed histogram) may also have two peaks at and . With the present model, the hard component of corresponds to the spectrum associated with the emission from the only main acceleration region, while the soft component corresponds to the spectrum composed of the emissions from both main and screening regions, as we discussed in section 4.1.3. The present model does not predict very hard spectrum with a index , which has been indicated for some pulsars.
Figures 14 and 16 represent the averaged apparent fractional thickness, which is defined by , and the photon index, respectively, as a function of the spin down power, and Figure 15 shows the averaged cut-off energy as a function of the magnetic field at the light cylinder. In the figures, the solid and dashed lines represent the results for the radio-selected and -ray-selected CPs, respectively. In addition, the thick and thin lines correspond to the results of the simulation and the observations, respectively. In Figure 14, our model predicts a tendency that the apparent fractional thickness, , tends to decrease with the increase of the spin down power. This is because the true fractional thickness, or , tends to decrease with the increase of the spin down power, that is, from equation (32) and from equation (34). Because the photon index of the spectrum tends to increase with the decrease of the fractional gap thickness as Figure 7 shows, the averaged photon index in Figure 16 increases with the spin down power. We find that these behaviors are qualitatively consistent with the observations. In Figure 15, our model predicts that the typical cut-off energy does not depend much on the magnetic field strength at the light cylinder, while the present data may have a tendency that the cut-off energy increases with the magnetic field strength at the light cylinder. However, because the observational errors are so large, a more deep observation to reduce the errors may be required to discuss the tendency.
In Figures 17 and 18, we summarize the distributions of the radiation characteristics for the simulated canonical and millisecond -ray pulsars, respectively, including both radio-selected and -ray-selected pulsars. The solid and dashed lines are results for the simulated six-month and ten-year observations, respectively. Comparing the solid and dashed lines, we find that the distributions do not depend much on the time span of the observations. However, we note that a longer observation enables to detect -ray pulsars with smaller fluxes, which include -ray pulsars with the viewing angle close to the rotation axis (c.f. Figures 3 and 4). For the observer with a viewing angle close to the rotation axis, the photon index tends to be , as Figures 7 and 8 show. Therefore, our model prediction is that a longer observation will detect more -ray pulsars with photon indexes , as right panels in Figures 17 and 18 indicate.
4.2.4 Pulse profiles
Figures 19-22 present the calculated pulse profiles for the different type of the -ray pulsars. For each type of the -ray pulsars, 64 samples are randomly chosen to present the model prediction on the statistical distribution of the morphology of the pulse profiles. From the left to right panels and from the top to bottom panels in the figures, the inclination angle increases. In principle, we can quantitatively compare the simulated morphology of the pulse profiles in Figures 19-22 (e.g. phase-separation, number of peak) with the observations. However, we would like to point out that it is very difficult to quantify the morphology to compare with the observations. In Figure 19, for example, the pulse profile represented in upper-left conner is indeed a double peak structure with the narrow phase-separation between two peaks. In the observations, however, the identification of the double peak structure with such narrow peak separation really depends on source counts and timing ephemerides of the pulsars. In Figure 20, the simulated pulse profile presented at the seventh-line and the first-column ( and ) has the first peak much smaller than the second peak. In the observations, the detection of such a small peak will depend on the strength of the background radiation. Moreover, because the intensity of pulse peak will depend on the modeling of the gap structure, it is difficult to discuss the distribution of the intensity ratio of the first and the second peaks with the present simple three-dimensional model. In the present paper, therefore, we avoid a quantitative discussion for the morphology of the pulsed profile. Instead, we can only present a qualitative comparison.
We note that the peaks emerging in the calculated pulse profiles are caused by the so-called caustic effect (Romani and Yadigaloglu 1995; Cheng, Ruderman and Zhang 2000; Dyks, Harding and Rudak 2004), in which more photons are observed at narrow width of the rotation phase due to the special-relativistic effects, i.e. the aberration of the emission direction and photon’s travel time. In such a case, the pulse phase and the number of the main peak are not affected much by modeling of the gap structure, whereas the intensity of the peak depends on the gap structure.
We can see in Figures 19 and 20 that the pulse profiles of the simulated CPs (in particular, -ray-selected CPs) are described by double peak structure rather than single peak profile. This result may explain the tendency that most canonical -ray pulsars observed by the show the double peak structure. In the present simulations, we have predicted that the -ray pulsars measured from are preferentially detected in the simulation (c.f. section 4.1). With the viewing angle closer to , the calculated pulse profile tends to have the double peak structure.
For the radio-selected canonical -ray pulsars, although the double peak structure are more or less common feature, single pulse structure or the double peak structure with a narrow phase separation stands out for pulsars with inclination angles , as we can see in Figure 19. This is because the simulated radio-selected canonical pulsars have the viewing angle similar to the inclination angle (c.f. Figure 9), . With the present outer gap geometry, the pulse profile of the smaller viewing angle () tends to have single peak or double-peak with a narrow phase separation, as the phase plot of Figure 2 shows.
Comparing the pulse profiles of the CPs (Figures 19 and 20) and of the MSPs (Figures 21 and 22), one may see that the pulse profile with single peak is more common for the MSPs than the CPs. In the present model, the fractional gap thickness of equation (33) for the MSPs tends to be larger than of equation (32) for the CPs. With a larger fractional gap thickness, the emission from the higher altitude (larger in units of the light radius) contributes to the pulse profile. Because the emission from the higher altitude produces two caustic peaks with a narrower phase separation, the calculated pulse profiles of the MSPs have single peak or double peak structure with the narrow phase separation more than that of the CPs.
5 Summary and Discussion
In this paper, we have applied the so called two-layer outer gap model for the -ray radiations from the pulsars, and have focused on the dependence of the -ray radiation characteristics on the inclination angle and the viewing angle. We showed that the -ray flux and the spectral cut-off energy decreases as the viewing angle deviates from . The spectrum above 100 MeV becomes soft with a photon index for the observer with a larger viewing angle (), whereas it becomes hard with a index for the observer with a smaller viewing angle (). The spectrum with a photon index consists of the emissions from both main acceleration and screening regions, while corresponds to the emission from the only main acceleration region.
We have developed the Mote-Carlo simulation for the population of -ray emitting pulsars. The our simulation predicts that 56 (or 59) radio-selected, 138 (or 182) -ray-selected canonical -ray pulsars and 14 (or 16) radio-selected -ray MSPs can be detected by five-year (or ten-year) observations. Even we drastically increase the radio sensitivity by a factor of ten, the most simulated MSPs are expected as the -ray selected MSPs, which will contribute as the unidentified sources and/or -ray background radiations. For the viewing geometry, our simulation predicts that the radio-selected CPs have the inclination angle () and the viewing angle () of , and that most -ray pulsars detected by the have been measured with a viewing angle of . We demonstrated that the spin down power and the -ray luminosity of the simulated pulsars is related as with for and for . The change of the slope is associated with the switching of the gap closure mechanism from the photon-photon pair-creation process of to the magnetic pair-creation process of . We showed that the distribution of the photon index of the simulated -ray pulsars has two peak at and , which may explain the observed distribution. We expect that more -ray pulsars with the hard spectrum of will be detected by the future observations. For the pulse profiles, the present simulation will explain the observational tendency that most canonical -ray pulsars detected by the have the pulse profiles with the double peaks. The our model expects that single pulse profile or the double pulse profile with a narrower phase separation is more common for MSPs than CPs.
The present model can be used to diagnose the viewing geometry of the -ray pulsars. For example, the present model predicts that most present -ray pulsars detected by the will have the viewing angle, , and hence the pulse profile with the double peaks is more common than that with the single peak. On the other hand, we expect that PSR J0659+1414, which is known as the extremely low efficient -ray pulsar (Abdo et al. 2010c), has a unique viewing geometry. PSR J0659+1414 is the radio-loud -ray pulsar and its spin down power is erg/s. Interestingly, the -ray emissions from PSR J0659+1414 has been observed with a -ray luminosity, , which is about two order smaller than the typical value for the pulsars with a similar spin down power. To explain the observed low efficiency of the -ray radiation, our simulation predicts that the inclination angle and the viewing angle are relatively small, say , and hence the apparent efficiency is significantly reduced from the typical value (c.f. Figure 3). PSR J0659+1414 is also known that the spectral cut-off energy, GeV, is suggestively smaller than the typical value of GeV. This behavior is also able to be explained by the effects of the viewing geometry, as Figure 5 indicates. Furthermore, our simulation expects that the pulsars measured as the low efficient -ray pulsars are located closer to Earth. In fact, PSR J0659+1414 with kpc is one of the nearest -ray pulsars. Finally, the observed broad single pulse profile of PSR J0659+1414 is also expected by the present calculation. As discussed in section 4.2.4 (Figure 19), the single pulse structure or double peak structure with a narrow phase separation is more common for the radio-selected canonical -ray pulsar with an inclination angle . On these ground, the unique radiation properties of PSR J0659+1414 can be explained, if the has measured the -ray emission from the our gap with the viewing geometry . It is expected that the population of the low-efficient -ray pulsars will be increased by the future observations. The diagnose its -ray efficiency, pulse profile and cut-off energy will provide a strong constraint on the emission models.
We thank A.H. Kong, C.Y. Hui, B. Rudak, Lupin-C.C. Lin, M.Ruderman, R.E. Taam and S.Shibata for the useful discussions. We express our appreciation to an anonymous referee for useful comments. We also thank the Theoretical Institute for Advanced Research in Astrophysics (TIARA) operated under the Academia Sinica Institute of Astronomy and Astrophysics, Taiwan, which enable author (J.T.) to use the PC cluster at TIARA. KSC is supported by a 2011 GRF grant of the Hong Kong SAR Government entitled “Gamma-ray Pulsars”.
References
- Abdo (2010) Abdo A.A. et al., 2010a, ApJS, 187, 460
- Abdo (2010) Abdo A.A. et al., 2010b, ApJS, 188, 405
- Abdo (2010) Abdo A.A. et al., 2010c, ApJ, 708, 1426
- Abdo (2010) Abdo A.A. et al., 2010d, ApJ, 712, 957
- Abdo (2009) Abdo A.A. et al., 2009a, Sci., 325, 840
- Abdo (2009) Abdo A.A. et al., 2009b, Sci., 325, 848
- Abdo (2009) Abdo A.A. et al., 2009c, ApJ, 706, 1331
- Aliu (2008) Aliu, E. et al., 2008, Sci, 322, 1221
- Arons (1983) Arons J., 1983, ApJ, 266, 215
- Bailes (1992) Bailes, M. & Kniffen, D.A., 1992, ApJ, 391, 659
- Binney (1987) Binney J. J., Tremaine S. D., 1987, Galactic Dynamics. Princeton Univ. Press, Princeton
- burton (1978) Burton, W.B. & Gordon, M.A., 1978, A&A, 63, 7
- Camilo (2009) Camilo, F. et al., 2009, ApJ, 705, 1
- Campana (1998) Campana, S., Colpi, M., Mereghetti, S., Stella, L., Tavani, M., 1998, A&ARv, 8, 279
- Caraveo (2010) Caraveo, P.A., 2010, in High Time REsolution Astrophysics IV-The Era of Extremely Large Telescopes-HTRA-IV, Creece Ma7 5-7, arXIV:1009.2421
- Cheng (2000) Cheng K.S., Ruderman M. & Zhang L. 2000, ApJ, 537, 964
- Cheng (1998) Cheng K.S. & Zhang, L. 1998, ApJ, 498, 327
- Cheng (1986a) Cheng K.S., Ho C., Ruderman M. 1986a, ApJ, 300, 500
- Cheng (1986b) Cheng K.S., Ho C., Ruderman M. 1986b, ApJ, 300, 522
- Cordes (2002) Cordes, J.M. & Lazio, T.J.W., 2002, preprint (astro-ph/0207156)
- Daugherty (1996) Davis, L. & Goldstein, M., 1970, ApJL, 159, 81
- Daugherty (1996) Daugherty J.K. & Harding, A.K., 1996, ApJ, 458, 278
- Daugherty (1982) Daugherty J.K., Harding, A.K., 1982, ApJ, 252, 337
- Dyks (2004) Dyks J., Rudak B. & Harding A.K., 2004, ApJ, 607, 939
- Faucher (2010) Faucher-Gigure, C.-A., & Loeb, A. 2010, J. Cosmol. Astropart. Phys., JCAP, 1, 5
- Faucher (2006) Faucher-Gigure, C.-A., & Kaspi, V.M., ApJ, 2006, 643, 332
- Goldreich (1992) Goldreich P., Reisenegger A. 1992, ApJ, 395, 250
- Goldreich (1969) Goldreich P., Julian W.H. 1969, ApJ, 157, 869
- Gonthier (2002) Gonthier, P.L., Ouellette, M.S., Berrier, J., O’Brien, S, Harding, A.K., 2002,
- Harding (2011) Harding, A. K. & Muslimov, A.G., 2011, ApJL, 726, 10
- Hirotani (2008) Hirotani K., 2008, ApJL, 688, 25
- Hirotani (2006) Hirotani K., 2006, ApJ, 652, 1475
- Hobbs (2005) Hobbs, G.; Lorimer, D.R., Lyne, A.G. & Kramer, M., 2005, MNRAS, 360, 974
- Hoyas (2008) Hoyos, J., Reisenegger, A. & Valdivia, J. A., 2008, A& A 487, 789
- ka (1996) Kaaret, P., & Cottam, J., 1996, ApJL, 462, 35
- kapsi (2001) Kaspi, V.M., Roberts, M.E., Vasisht, G., Gotthelf, E.V., Pivovaroff, M. & Kawai, N., 2001, ApJ, 560, 371
- keith (2011) Keith, M.J. et al. 2011, MNRAS (arXiv:1102.0648)
- kijak (2003) Kijak, J. & Gil, J., 2003, A& A, 397, 969
- kijak (1998) Kijak, J. & Gil, J., 1998, MNRAS, 299, 855
- Kramer (2000) Kramer, M., Xilouris, K.M., 2000, in Pulsar Astronomy – 2000 and Beyond, ed. M. Kramer, N. Wex, & R. Wielebinski (San Francisco: Astronomical Society of the Pacific), IAU Coll., 177, 229
- Kramer (1998) Kramer, M., Xilouris, K.M., Lorimer, D.R., Doroshenko, O., Jessner, A., Wielebinski, R., Wolszczan, A., & Camilo, Fernando, 1998, ApJ, 501, 270
- Kramer (1997) Kramer, et al. 1997 A&A, 322, 846
- Lorimer (2008) Lorimer D.R., 2008 Living Rev. Relaiv., 11, 8
- Lorimer (1995) Lorimer D.R. et al., 1995, ApJ, 439, 933
- Lyne (2006) Lyne, A.G., & Graham-Smith, F. 2006(ed.), in Pulsar Astronomy (3rd ed., Cambri dge Astrophysics Series; Cambridge Unive. Press), 264
- Manchester (2005) Manchester, R.N., Hobbs, G.B., Teoh, A., Hobbs, M., Astron. J., 129, 1993-2006 (2005) (astro-ph/0412641)
- marshall (1998) Marshall, F.E., Gotthelf, E.V., Zhang, W., Middleditch, J. & Wang, Q. D., 1998, ApJL, 499, 179
- Michel (1991) Michel, F.C., 1991, Theory of Neutron Star Magnetospheres. University of Chicago Press, Chicago
- Muslimov (2004) Muslimov, A.G. & Harding, A.K., ApJ, 617, 471
- Narayan (1990) Narayan, R. & Ostriker, J.P., 1990, ApJ, 352, 222
- Paczynski (1990) Paczynski, B., 1990, ApJ, 348, 485
- Ransom (2011) Ransom, S.M. et al., 2011, ApJL, 727, 16
- Ray (2010) Ray P.S., 2010, in ICREA Workshop on the High-Energy Emission from Pulsars and their Systems
- Romanova (2009) Romanova, M.M., Ustyugova, G.V., Koldoba, A.V., Lovelace, R.V.E., 2009, MNRAS, 399, 1802
- Romani (2010) Romani R.W., & Watters K.P., 2010, ApJ, 714, 810
- Romani & Yadigaroglu (1995) Romani, R.W. & Yadigaroglu, I.-A. 1995, ApJ, 438, 314
- Ruderman (1975) Ruderman M.A., Sutherland P.G., 1975, ApJ, 196, 51
- Parkinson (2010) Saz Parkinson, P.M. et al. 2010, 725, 571
- (59) Spitkovsky, A., 2006, ApJL, 648, 51
- Story (2007) Story, S.A., Gonthier, P.L., Harding, A.K., 2007, ApJ, 671, 713
- Stuner (1996) Sturner, S.J. & Dermer, C.D. 1996 A&AS, 120, 99
- Takata (2011a) Takata J., Wang, Y., Cheng, K.S., 2011a, ApJ, 726, 44
- Takata (2011b) Takata J., Wang, Y., Cheng, K.S., 2011b, accepted by MNRAS
- Takata (2010a) Takata J., Wang, Y., Cheng, K.S., 2010a, ApJ, 715, 1318
- Takatab (2010b) Takata J.,Cheng, K.S., Taam R.E., 2010b, ApJL, 723, 68
- Takata (2007) Takata J., Chang H.-K. & Cheng K.S., 2007 ApJ, 656, 1044
- Takata (2004) Takata J., Shibata S. & Hirotani K. 2004, MNRAS, 354, 1120
- Tauris (1998) Tauris, T.M., & Manchester, R.N., 1998, MNRAS, 298, 625
- Venter (2009) Venter C., Harding A.K., Guillemot L., 2009, ApJ, 707, 800
- Watters (2011) Watters, K.P. & Romani, R.W., 2011, ApJ, 727, 123
- Wang (2011) Wang, Y., Takata, J. & Cheng, K.S.,2011, accepted by MNRAS
- Wang (2010) Wang, Y., Takata, J. & Cheng, K.S.,2010, ApJ, 720, 178
- Yadigaroglu (1997) Yadigaroglu I. A., 1997, Ph.D. thesis, Standford Uinv.
- Zhang (1997) Zhang L., Cheng K.S., 1997, ApJ, 487, 370
- Zhang (2003) Zhang L., Cheng K.S., 2003, A&A 398, 639


