An XMM-Newton view of the ‘bare’ nucleus of Fairall 9††thanks: Based on observations obtained with XMM-Newton, an ESA science mission with instruments and contributions directly funded by ESA Member States and NASA.
Abstract
We present the spectral results from a 130 ks observation, obtained from the X-ray Multi-Mirror Mission-Newton (XMM-Newton) observatory, of the type Seyfert galaxy Fairall 9. An X-ray hardness-ratio analysis of the light-curves, reveals a ‘softer-when-brighter’ behaviour which is typical for radio-quiet type Seyfert galaxies. Moreover, we analyse the high spectral-resolution data of the reflection grating spectrometer and we did not find any significant evidence supporting the presence of warm-absorber in the low X-ray energy part of the source’s spectrum. This means that the central nucleus of Fairall 9 is ‘clean’ and thus its X-ray spectral properties probe directly the physical conditions of the central engine. The overall X-ray spectrum in the 0.5–10 keV energy-range, derived from the EPIC data, can be modelled by a relativistically blurred disc-reflection model. This spectral model yields for Fairall 9 an intermediate black-hole best-fit spin parameter of .
keywords:
galaxies: individual: Fairall 9 – X-rays: galaxies – galaxies: nuclei – galaxies: Seyfert – black hole physics1 Introduction
Fairall 9 (Fairall, 1977) is a type Seyfert galaxy at a redshift of z=0.047 (Lauberts & Valentijn, 1989). It has a black-hole (BH) mass of (based on reverberation mapping, Peterson et al., 2004) and an Eddington luminosity fraction of 0.05, assuming the bolometric luminosity, erg s-1, after Woo & Urry (2002).
From the early 70’s Fairall 9 (also known as ESO 113-IG 45, Holmberg et al., 1978) has been observed several times in the X-ray band with Uhuru (Forman et al., 1978), Ariel (McHardy et al., 1981), HEAO-1 A1 (Wood et al., 1984), HEAO-1 A2 (Piccinotti et al., 1982), Einstein (Petre et al., 1984) and EXOSAT (Morini et al., 1986). The Advanced Satellite for Cosmology and Astrophysics (ASCA) revealed a broad iron line which was well modelled by a relativistic line-emission model (Reynolds, 1997). Further observations with the X-ray Multi-Mirror Mission-Newton (XMM-Newton) observatory (Gondoin et al., 2001) unveiled the existence of an absorption edge at 7.64 keV (in the source’s rest-frame). In contrast to the ASCA observations, the iron line appeared to be narrow in the XMM-Newton data-set, suggesting that the reflection process arises from material far from the putative central BH. Brenneman & Reynolds (2009) reanalysed the same observation and found a third narrow emission-line at 6.78 keV (in the source’s rest-frame) corresponding to ionized iron.
Additionally, recent Suzaku observations of Fairall 9 showed a broad asymmetric iron line (Schmoll et al., 2009), which is consistent with a disc-origin. A relativistically blurred disc reflection model, was fitted to the broad-band Suzaku spectrum (0.7–30 keV) of Fairall 9, yielding a constraint for the BH spin parameter of , where (in the geometric unit system, Bardeen et al., 1972) and , with being the angular momentum of the BH and the BH mass. Finally, Patrick et al. (2011) reanalysed the same data using additionally data from the burst alert telescope (BAT) on board SWIFT satellite and derived a similar low value of .
In the current paradigm, active galactic nuclei (AGN) are thought to consist of an accretion disc surrounding a supermassive BH (Rees, 1984). Consequently, most of the emitted energy that is released in the X-rays is the result of the conversion of gravitational potential energy from matter falling towards the BH.
Thus, the X-ray spectroscopic properties of AGN can disclose valuable information about the physical properties of the processes operating in the immediate environment of the BH. In particular, broadening of the iron emission-lines, formed in the inner part of the accretion disc, can provide constraints about the BH spin parameter (Miller, 2007). Since the X-ray nucleus in Fairall 9 is ‘clean’, lacking X-ray warm-absorption features (Gondoin et al., 2001), it offers an ideal environment to investigate the physical properties of the central region.
However, there are alternative scenarios that can explain the broadening of the iron lines. Complex absorption processes from warm-absorbers can cause an apparently similar iron line profile to the profiles caused by strong gravity environments (Reeves et al., 2004; Turner et al., 2005). Moreover, it is reasonable to expect several weak helium- and hydrogen-like emission-lines from distant material around the same energy as the iron line (i.e. 6.4–6.7 keV energy-range in the source’s rest-frame), causing similar apparent broadening effects (Nandra et al., 2007). Also Nandra et al. (2007) showed that intermediate ionization species of the iron itself, can produce asymmetric broad line-profiles extending up to 6.97 keV (in the source’s rest-frame). Finally, blueshifted or redshifted spectral-features from ejected or infalling materiel, close to the nucleus, can appear in the energies around the iron line, broadening its profile (Yaqoob et al., 1999; Turner et al., 2002).
In this paper we report the analysis results of an XMM-Newton observation of Fairall 9 performed in December 2009. Initially, in Sect. 2 we present the data-reduction procedures for the X-ray data from the European photon imaging camera (EPIC), consisting of the pn-charge coupled device (pn-CCD) and the two metal oxide semi-conductor (MOS)-CCDs. In the same section, we present the data-reduction details for the soft X-ray data from the reflecting grating spectrometer (RGS). Then, in Sect. 3 we show the EPIC light-curve products together with a hardness-ratio analysis. In Sect. 4, we perform a spectral analysis of the RGS data and in Sect. 5 we investigate the spectral properties of the EPIC data. A discussion together with a summary of our results can be found in Sect. 6. The cosmological parameters used throughout this paper are: km s-1 Mpc-1, =0.73 and =0.27, yielding a luminosity distance to Fairall 9 of 208.5 Mpc.
2 OBSERVATIONS AND DATA-REDUCTION
2.1 EPIC-MOS and EPIC-pn data-reduction
Fairall 9 has been observed by XMM-Newton (Obs-ID: 0605800401) from 2009 December 9, 19:56:35 (UTC), to 2009 December 11, 08:04:07 (UTC) (on-time: 130052 s). The pn camera was operated in Prime Small Window mode and the two MOS cameras in Prime Partial W2 mode. Medium-thickness aluminised optical blocking filters were used for all EPIC cameras to reduce the contamination of the X-rays from infrared, visible, and ultra-violet light.
The EPIC raw-data are reduced with the XMM-Newton Scientific Analysis System (SAS) (Gabriel et al., 2004) version 10.0.2. After reprocessing the pn and the two MOS data-sets with the epchain and the emchain SAS-tools respectively, we perform a thorough check for pile-up using the task epatplot. The pn data do not suffer from pile-up, thus the source and the background count-rates are extracted from a circular region of radius 31.5 arcsec and 35 arcsec, respectively. Conversely, both MOS cameras appear to be slightly piled-up. Therefore, to be conservative, the final source count-rates are extracted from annuli of the same outer radius 35 arcsec and inner radius 2.75 arcsec and 2.5 arcsec for the MOS 1 and the MOS 2, respectively. The background count-rates are extracted from two circular regions of 3.33 arcmin and 3.42 arcmin for the MOS 1 and the MOS 2, respectively. Note that these apertures yield the optimum signal-to-noise ratio above 7 keV. We verify that the resulting light-curves are not affected by pile-up problems.
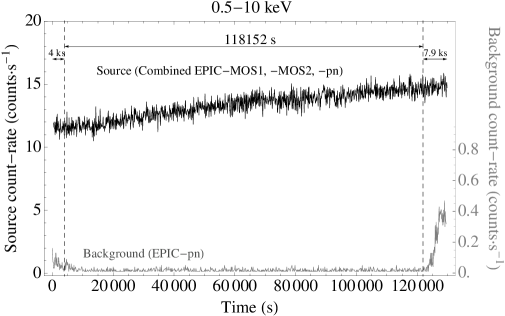
For the production of the light-curves at a given energy-range, we select events that are detected up to quadruple pixel-pattern on the CCDs i.e. PATTERN12. The corrected background-subtracted light-curves of the source are produced using the SAS-tool epiclccorr. Based on the pn background light-curve, in the 0.5–10 keV energy-range (Fig. 1, grey-points corresponding to the right-axis), an increased background activity was registered during the first 4 ks and the last 7.9 ks of the observations and thus, data from those periods are disregarded from our analysis111Despite the fact that the ‘high’ background-states are still minimal, in terms of count-rate, with respect to the source count-rate in 0.5–10 keV (Fig. 1, black-points corresponding to the left-axis), they consist of events having energies more than 2 keV. At these energies the source count-rate is of the order of 1.5 countss-1.. This leaves us with 118152 s clean exposure-time.
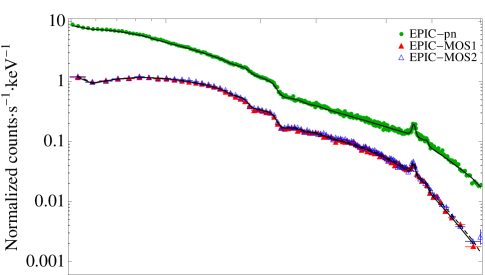
For the production of the spectra we use the SAS-task evselect and we select for the pn camera the pulse-invariant (PI) channels from 0 to 20479, having a spectral-bin-size of 5 eV. For the two MOS cameras we select the PI channels from 0 to 11999 with a spectral-bin-size of 15 eV. For the spectral analysis we have set more stringent filtering criteria from those in the case of the light-curves. For the pn data we allow events that are detected up to double pixel-pattern on the CCD i.e. PATTERN4 and we exclude all the events that are at the edge of a CCD and at the edge to a bad pixel i.e. FLAG0. For the MOS data we allow, as in the case of the light-curves, PATTERN12 but we restrict to those events having also FLAG0. After filtering the events, we calculate the area of the source and the background annular regions using the task backscale and finally we compute the detectors’ response matrices and the effective areas using rmfgen and arfgen, respectively.
The X-ray spectral fitting analysis (Sect. 5) has been performed by the high-level task XSPEC (Arnaud, 1996) version 12.6.0, of the HEAsoft version 6.10. We group the PI channels of the source-spectra, making use of the task grppha of the FTOOLS (Blackburn, 1995) version 6.10. The MOS source-spectra are grouped in bins of four (=60 eV) and eight (=120 eV) spectral-channels for the energy-ranges of 0.5–8 keV and 8–10 keV, respectively. The pn source-spectra are grouped in bins of four (20 eV) spectral-channels for the energy-range of 0.5–10 keV. All the grouped spectral-bins contain at least 20 photons.
2.2 RGS data-reduction
The RGS raw-data are processed following the standard data-reduction threads of SAS. We use the tool rgsproc to extract calibrated first-order spectra and responses for the RGS 1 and RGS 2 cameras. In general, XMM-Newton RGS observations can be affected by high particle background periods during parts of the XMM-Newton orbits, mostly caused by Solar activity. The high energy-band is the one being mostly affected by background flares, and high energy RGS photons are dispersed over the CCD-9 chip. We therefore extract the background light-curve of the CCD-9 chip and select, as good-time-intervals of the processed observation, only those during which the background count-rate deviates by less than two standard deviations from the average background count-rate of each observation. The final (i.e. after cleaning for high-background time-intervals) exposures of the RGS 1 and RGS 2 spectra are 129.6 ks and 129.8 ks, respectively.
Both RGS 1 and RGS 2 spectra are grouped at a resolution of 8 mÅ (0.16 eV at 0.5 keV), so allowing 8 spectral-bins for each RGS resolution element. For both the RGS 1 and the RGS 2, the photon count-rate of the background spectrum becomes comparable to the background-subtracted source count-rate, at energies less than 0.35 keV ( Å), and greater than 1.8 keV (7 Å). Moreover, due to failures of two different read-out detector chips, early in the life of the mission, both the RGS 1 and the RGS 2 lack response in two different spectral intervals of 0.9–1.2 keV and 0.5–0.7 keV, respectively. We therefore consider the following two spectral intervals for spectral fitting purposes: keV and keV, for RGS 1 and RGS 2, respectively.
For the spectral fits the Sherpa modelling and fitting application of the Chandra Interactive Analysis of Observation (CIAO) software version 4.2, has been used to fit simultaneously the RGS 1 and RGS 2 spectra of Fairall 9. In addition, the spectral fitting analysis results have been cross-checked and verified with XSPEC, but the latter values are less conservative and thus we report only the results coming from Sherpa.
3 X-RAY LIGHT-CURVES
The combined X-ray light-curves from the EPIC-pn and the two EPIC-MOS cameras in 0.5–1.5 keV, 2.5–4 keV, and 5–10 keV energy-ranges, are shown in Fig. 2. A steady count-rate increase can be noticed in all three energy-bands, of the order of 30 per cent, 20 per cent, and 10 per cent, respectively. Additionally, the fractional variability amplitudes (corrected for the photon noise e.g. Vaughan et al., 2003), for the three bands are 7.30.1 per cent, 5.70.6 per cent, and 2.22.2 per cent, respectively. Both the overall count-rate and the fractional variability amplitude increase with decreasing energies.


3.1 Hardness-ratio analysis
Observing different variability amplitudes in different energy-bands is usually indicative of spectral variations (e.g. Brinkmann et al., 2007). After binning the light-curves in bins of 5 ks, we estimate the hardness-ratios (5–10 keV)(0.5–1.5 keV) (HR 1) and (5–10 keV)(2.5–4 keV) (HR 2) versus the overall count-rate in 0.5–10 keV (Fig. 3). We see a decreasing trend implying that the source X-ray spectrum becomes softer when the source gets brighter.
In order to check the significance of such a trend, we fit to the 23 hardness-ratio points a linear model and we check how significantly the value of the slope differs from that of zero. For HR 1 the best-fit-model gives a slope of with a 95 per cent confidence interval (c.i.) of (,)222The value of -statistic is . Since the value of -statistic that we get from the data-set is 18.71, the probability of getting such a value by chance alone is only .
For HR 2 the best-fit model gives a slope of having a 95 per cent c.i. of (). The value of -statistic for this data-set is 11.95 yielding a chance coincidence probability of only . Since in both cases the zero value lies outside the estimated c.i., the null-hypothesis (i.e. the slope is equal to zero) is rejected at 5 per cent significance level.
This result implies that Fairall 9 shows significant X-ray spectral variations, becoming ‘softer-when-brighter’. This behavior is considered typical for radio-quiet type Seyfert (e.g. Sobolewska & Papadakis, 2009).


4 THE RGS SPECTRUM OF FAIRALL 9
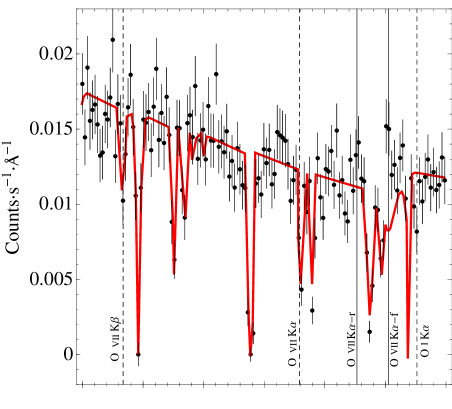
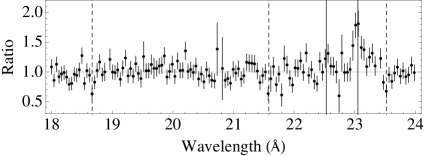
We search the Fairall 9 RGS 1 and RGS 2 spectra (in their available wavelength intervals) for narrow absorption and emission features. We inspect locally 2 Å wide spectral regions, and we model the local continua with simple power-laws attenuated, in this line of sight, by the Galactic neutral absorption cm-2 (estimated using the FTOOL nH, after Dickey & Lockman, 1990). When both the RGS 1 and the RGS 2 are available we fit simultaneously the same 2 Å regions from the two spectrometers. In Fig. 5 we show the 18–24 Å portion of the RGS 1 spectrum of Fairall 9, together with its best-fit continuum model (red-line) and the corresponding ratio plot (datamodel). Note that in this section all the centroid-energies of the emission- absorption-lines refer always to the observer’s frame.
From the ratio plot of Fig. 5 we find no significant evidence for absorption-lines imprinted either by intrinsic (i.e. nuclear) or by intervening (i.e. interstellar medium (ISM) or intergalactic medium) material down to 4 standard deviations (below the fluctuations of the continuum) line equivalent-width (eqw) sensitivity of 45 mÅ. The only exception is a relatively strong local O i K line (eqw mÅ), imprinted by our Galaxy ISM at E= keV (23.51 Å), and detected at a confidence level of 2.9 standard deviations (below the fluctuations of the continuum). Assuming a relative fraction (with respect to the ensemble of the oxygen species) of O i of the order of unity, i.e. neutral material, this gives an average ISM metallicity along the line of sight of the order of 20 per cent that of the Solar value. Moreover, we find evidence of two additional local absorption-lines O vii K (eqw mÅ) and O vii K (eqw mÅ) at E= keV (18.67 Å) and E= keV (21.58 Å), respectively. These lines are detected at a confidence level of 3.8 and 3.2 standard deviations (below the fluctuations of the continuum) and they are thought to be created by an ubiquitous local absorber (seen along virtually all lines of sight), which could be hot gas in an extended corona of our galaxy, or a local warm-hot intergalactic medium filament permeating our own Local Group and/or Milky Way, or both (Nicastro et al., 2002). However, from the ratio plot of Fig. 5 (dashed-lines at 18.67 Å and 21.58 Å) we notice that each of these two absorption-lines coincides with effective area features, i.e. instrumental features.
Additionally, we find evidence for the presence of few narrow (i.e. unresolved) emission-lines close to the systemic redshift of Fairall 9. In particular, we identify two of the three lines of the O vii K emission triplet, the resonant (r) and the forbidden (f) lines (Fig. 4, solid-lines). During the fit, the three lines (r,f and intercombination (i)) have positions linked to their rest-frame line energy-ratio and only the energy of O vii K-r is left to vary freely. The rest-frame wavelengths of these lines are 21.602 Å (r), 21.8 Å (f), and 22.1 Å (i). Unfortunately, the O vii K-i falls into an instrumental feature of the RGS 1 (the RGS 2 is blind at these wavelengths) and thus no density diagnostics are possible for the X-ray emitting gas. The O vii K-f line (eqw mÅ) at E=0.5379 keV (23.05 Å) and O vii K-r line (eqw=42 m Å) at E= keV (22.53 Å) are detected at a confidence level of 4.5 and 1.9 standard deviations (above the fluctuations of the continuum) at a redshift of z=0.0430.001, implying an outflow velocity relative to the optical systemic redshift of Fairall 9 of -1200 km s-1. The O vii K (f/r) 4.3 intensity ratio strongly suggests the photo-ionization nature of the emitting gas (Porquet & Dubau, 2000).
Despite the absence of individually significant absorption-lines, we check further for the presence of any ionized gas in the source. To this end, we jointly fit the RGS 1 and RGS 2 spectra with a model consisting of a power-law plus a warm-absorber attenuated, in this line of sight, by the Galactic neutral absorption . We use the self-consistent code Photoionized Absorption Spectral Engine (PHASE) (Krongold et al., 2003), that calculates the absorption caused by ionized plasma. The code has four parameters: the equivalent hydrogen column density of the absorber, the ionization parameter U of the gas (defined as the ratio between the density of ionizing photons and the electron density of the gas), the turbulent velocity, and the redshift of the absorber.
We freeze the absorber’s redshift to the systemic redshift of Fairall 9, and its turbulent velocity to v km s-1, while we leave the equivalent hydrogen column density and the ionization parameter of the absorber free to vary during the fit. The best-fit value that we obtain for is is rather low for typical type Seyfert warm-absorbers. Furthermore, although we can obtain just an upper limit for the equivalent hydrogen column-density of the absorber, this limit is rather tight: (the errors correspond to one standard deviation for the two interesting parameters). In Fig. 5 we show the 68.27, 95.45 and 99.73 per cent confidence contours for these two parameters. Clearly, a significant amount of intrinsic absorbing material along our line of sight to Fairall 9 is not required by the RGS data.

5 EPIC X-RAY SPECTRAL ANALYSIS
For the X-ray spectral results, all the errors on the best-fit parameters indicate their 90 per cent confidence range, corresponding to a of 2.706, unless otherwise stated. During the fitting procedures, we keep all the model-component parameters between the two MOS and the PN spectra tied together except from the normalizations (for the two MOS spectra they are still tied together). The model-flux is modified using the photoelectric absorption model wabs having a fixed interstellar column-density of . Note, that the best-fit values for the centroid energy of the emission-lines are given in the source’s rest-frame and the horizontal axis in the spectral-plots always refers to the energies in the observer’s frame.
5.1 A first look at the broad-band spectrum (Model 1)
In order to get a phenomenological view of the overall spectra we initially fit a redshifted power-law (Model 1) to the data in the 3–5 keV and 7–10 keV energy-bands. The value of the best-fit model is equal to 419.41 for 388 d.o.f. yielding a best-fit photon spectral index of . Figure 6 shows this best-fit model extrapolated over the energy-range of 0.5–10 keV together with the respective ratio plot.
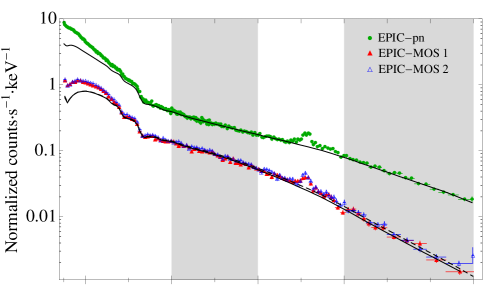
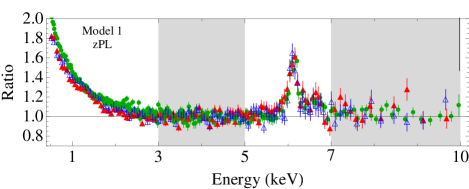
From the ratio-plot of Fig. 6 we can readily distinguish two very distinct spectral features. Below 2 keV, we notice a strong flux-excess on the top of the best-fit power-law extrapolation. Then, in the 5.7–8 keV energy-range a strong emission-line appears around 6.1 keV followed by an excess around 6.7 keV. In addition to those features, significant broad residuals appear above 7 keV as well as a feature at 6.8 keV suggestive of an absorption edge.
5.2 Spectral fitting in the 3–10 keV energy-range
Since Model 1 (Fig. 6) gives an adequate description of the data in the 3–5 keV and 7–10 keV energy-ranges, we keep it as a baseline model, for the following spectral-analysis over the 3–10 keV energy-range. The best-fit parameters for the following X-ray spectral models are given in Table 1.
5.2.1 Iron line and reflection (Model 2)
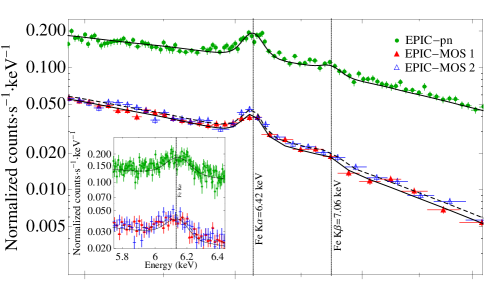
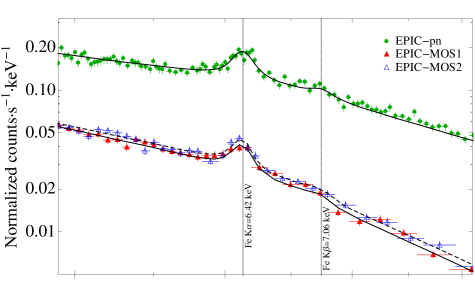
To account for the emission-line at 6.1 keV (in the observer’s frame), we consider a redshifted zero-width Gaussian-function model. Following both Gondoin et al. (2001) and Schmoll et al. (2009) and due to the fact that this line appears to correspond to the Fe K line from neutral iron, having a centroid energy of 6.4 keV in the source’s rest-frame, we add further a redshifted zero-width Gaussian-function model to account for the associated Fe K line333The exact energy position of these two iron lines depends on the ionization state of the Fe element in the source. Assuming neutral atoms (after Kaastra & Mewe, 1993) the Fe K is a doublet composed of a 6.391 keV and a 6.405 keV line, as well as the Fe K line consisting of a 7.057 keV and a 7.058 keV line. Since the energy resolution of the EPIC cameras at 6–7 keV energy-range is around 150 eV (full width half maximum), it is impossible to resolve them and thus we fit them with a zero-width redshifted Gaussian-function.. For the latter, we fixed the centroid energy at 7.06 keV (in the source’s rest-frame) and its normalization at a value equal to 0.16 of the Fe K normalization (Molendi et al., 2003).
We model the absorption-edge and the associated reflection-continuum as the reflection of an exponentially cut-off power-law spectrum from a neutral disc using the XSPEC model pexrav (Magdziarz & Zdziarski, 1995). In order to derive the reflected continuum only, we restrict the range of the relative-reflection scaling-factor to negative values. The energy cut-off is fixed at =200 keV (in the source’s rest-frame), the abundance of elements heavier than helium is set equal to that of the Solar value, the iron abundance is set equal 0.8 of the Solar value (Schmoll et al., 2009), and the inclination angle is fixed at degrees. Note that we do not tie together the photon index of the pexrav model with that of the redshifted power-law. If the reflecting material is associated with the distant molecular torus, which is expected in Seyfert galaxies, it will probably respond to the average X-ray source-spectrum, whose slope may be different than the spectral slope during this XMM-Newton observation.
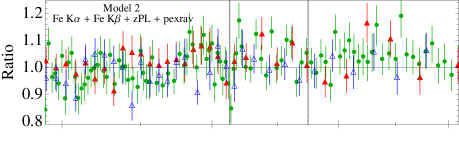
The best-fit model (Model 2) is plotted in the top panel of Fig. 7, having a value of 600.29 for 538 d.o.f. The best-fit centroid energy of the Fe K line is 6.42 keV. The best-fit values for the relative reflection and the power-law photon index, from the pexrav model, are and , respectively. Finally, the best-fit power-law photon index, coming from the redshifted power-law model-component is . From the ratio plot of the top panel of Fig. 7, we see that even after including the two narrow Fe lines and the reflection component, three broad emission components still remain around 5.9 keV, 6.1–6.7 keV, and 6.9–7.7 keV (in the observer’s frame).
Note that the photon indices coming from the pexrav and the power-law model-components are consistent within their errors. Tying the two photon-indices together and repeating the fit yields a value of , being consistent with the previously derived values.
5.2.2 Adding a relativistic disc-line (Model 3)
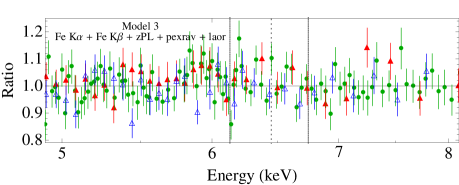
In order to quantify further the aforementioned spectral-excesses, we fix the parameters of Model 2 to their best-fitted values and we add the relativistic disc-line model of Laor (1991), denoted as laor in XSPEC, (Model 3). The latter model-component describes the line-profile emitted from an accretion disc around a rotating black hole including the strong relativistic effects that are produced in the innermost regions of the accretion disc.
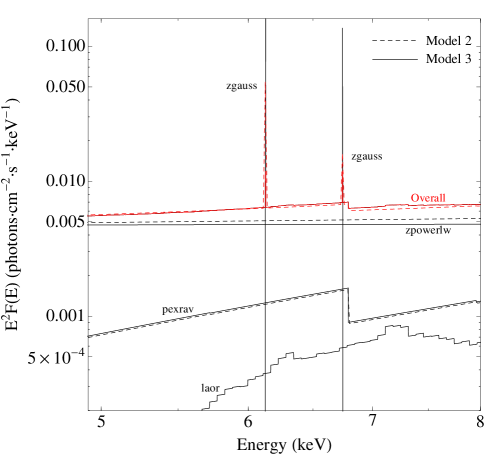
During the fit, we fix the parameters of the inner and the outer radius of the accretion disc to 6 and 300 gravitational radii, , respectively. From the bottom panel of Fig. 7 we can see that Model 3 gives a very good description of the excesses in the 6.1–7.7 keV energy-range (in the observer’s frame). The value of this fit is 559.18 for 536 d.o.f. The best-fit value for the centroid energy of the relativistic line is 6.75 keV. Also, the best-fit values for the emissivity index and the inclination angle are and degrees, respectively. Finally, the power-law photon index is steeper than that of Model 2 and equal to . In Fig. 8 we show the spectral components of both the best-fit Model 2 (dashed-line) (Sect. 5.2.1) and the best-fit Model 3 (solid-line) to the pn data, depicting the relative flux contribution of each component to the X-ray spectrum.
For this model, we can now estimate the eqw of the narrow and broad emission-lines, having as an underlying-continuum the contribution from all other components of Model 3. The eqws for the Fe K and Fe K lines that we get are 103 eV and 19 eV, respectively (mean values from the pn and the MOS data). The eqw of the relativistic disc-line is 362 eV and 162 eV, for the pn and the MOS data, respectively.
Theoretically, it is expected that the eqw of the narrow emission-lines should be tightly connected with the amount of the continuum reflection component (Matt et al., 1991). In fact, one can consider a linear correlation between the two parameters with the reflection strength, , ( is solid angle that the reflector subtends) being equal to unity when the Fe K line’s eqw is 120 eV (e.g. Matt et al., 1991; Bianchi et al., 2009). For the best-fit eqw-value of Fe K line, that we have found previously, the expected reflection should be . This value is entirely consistent with the reflection fraction estimates mentioned above (Model 2). Based on the estimated reflection value, the average solid angle that the distant reflector should subtend is (1.720.34) sr.
Note that if we replace the relativistic disc-line model with a narrow emission-line at 6.78 keV (in the source’s rest-frame), as observed by Brenneman & Reynolds (2009), the broad excess between 6.1–6.7 keV (in the observer’s frame) can not be modelled. Instead, we need at least three emission-lines to account for this excess resulting to an overparametrised physical model.
5.2.3 Ionized disc reflection with relativistic blurring (Model 4)
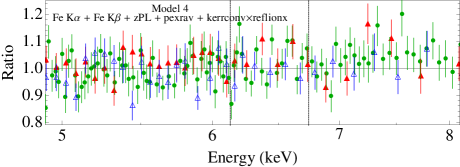
The simple relativistic disc-line component of Model 3 seems to give a good morphological description about the nature of the spectral excesses of Model 2. Nevertheless, the inclination angle, derived by the laor model, seems to be unphysically high for a type Seyfert galaxy. Also, the centroid energy of the relativistic line strongly indicates that the inner disk is moderately ionized, yet no ionized Compton reflection component is included in Model 3. In this section we consider a relativistic self-consistent spectral-model, using as an input the reflection coming from a constant density illuminated disc. This model (Model 4) consists of the X-ray ionized-reflection model of Ross & Fabian (2005), denoted as reflionx in XSPEC, convolved with the relativistic blurring multiplicative model of Brenneman & Reynolds (2006), denoted as kerrconv in XSPEC.
The ionized-reflection model takes into account several spectral signatures of ionized reflection in the source’s rest-frame including: the Compton-hump at 30 keV, a strong ionized iron line at 6.7 keV, multiple emission-lines on top of a soft continuum between 0.3–3 keV, and a further extreme-UV emission hump peaking at about 60 eV. The blurring model smears out the spectrum due to the strong gravity effects in a fully relativistic way and it allows the BH spin parameter, , to be a free fitting parameter.
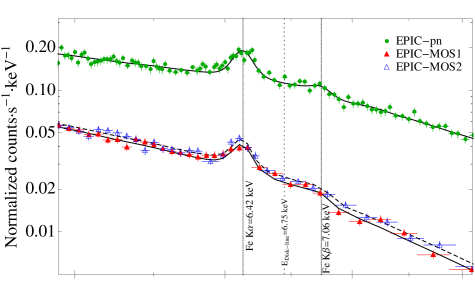
During the fitting procedure, we keep all the parameters of Model 3 (i.e. the Fe K and the Fe K lines, as well as the pexrav model-component) fixed at their best-fit values and we replace the disc-line component with the kerrconvreflionx. We assume a disc of uniform emissivity extending from the radius of the innermost stable circular orbit, , out to 400 . The photon index of the ionized-reflection model-component, , is tied to the photon index of the underlying redshifted-power-law model-component, representing the continuum.
The best-fit Model 4 gives a statistically acceptable fit for the X-ray EPIC-data of Fairall 9 (Fig. 9) yielding a value of 578.88 for 535 d.o.f. The best-fit model parameters are: power-law photon index of , emissivity index of , ionization parameter of erg cm s-1, inclination of degrees, and BH spin-parameter of .
Note that our data do not allow us to discern between uniform and non-uniform emissivity profiles. If we consider a kerrconv model-component with a non-uniform emissivity profile, we get two emissivity indices of and , and a break-radius of . The two indices are consistent with the value derived previously for the case of uniform emissivity.
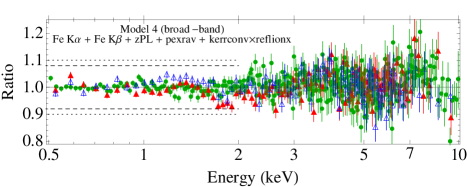
5.3 The broad-band spectrum, 0.5–10 keV: Ionized disc-reflection with relativistic blurring (Model 4 (broad-band))
As we have mentioned above, at soft energies (i.e. below 2 keV) in addition to the power-law continuum, the ionized-reflection model predicts the presence of multiple emission-lines that are expected to be almost entirely blurred, due to the strong relativistic effects that operate in the vicinity of the central BH. In fact, it has been suggested that the so-called ‘soft-excess’ emission in AGN could be the result of X-ray reflection from the inner parts of the accretion disc (e.g. Crummy et al., 2006). For this reason, we examine whether Model 4 is able to reproduce the broad-band X-ray spectrum of the source in the 0.5–10 keV energy-band.
To this end, we extend the energy-range down to 0.5 keV and we fit again Model 4 to the pn and MOS spectra simultaneously, having again the Fe K and the Fe K lines, as well as the pexrav model-component fixed at their best-fit Model 3 values. The value of the fit is 1052.63 for 749 d.o.f. and the best-fit-model is shown in Fig. 10. The best-fit model parameter values are: a power-law photon index of , an emissivity index of , an ionization parameter of erg cm s-1, and an inclination angle of degrees. Finally, the best-fit BH spin parameter is . We outline the fact that the value of is very sensitive to the rest of the fitting parameters. Even small deviations of the rest of the fitting parameters, around their best-fit values and within their quoted errors, can change significantly the result of .
The value of the fit-statistic for this best-fit model is rather high. Strictly speaking, for the given d.o.f., the null hypothesis probability is extremely small, 1.3, implying that the particular best-fit model is highly unlikely to be a good representation of the underlying spectrum in the 0.5–10 keV energy-range. However, we believe that there are good reasons that this may not be the case due to the larger collecting area at lower energies. The quality of the fit is mainly determined by the data below 2 keV which have higher signal-to-noise ratio, than those above 2 keV, and thus bigger statistical-weight, during the estimation of . At energies below 2 keV the cross-calibration uncertainties between the pn and the MOS detectors, as well as the individual calibration uncertainties of each detector separately are of the order of 8–10 per cent (e.g. Mateos et al., 2009). The dashed- and the dotted-lines in the ratio plot of Fig. 10 indicate the 8 and 10 per cent residual-amplitude areas. We see that all of the ratio estimates, below 2 keV, are within these areas. What is even more interesting is that the pn and the MOS residuals do not typically agree with each other, as we would expect if indeed the model did not provide an acceptable representation of the observed spectra, suggesting that calibration inaccuracies dominate the fit-statistic. Finally, in order to limit the systematic calibration uncertainties to those originating only from the pn instrument, we ignore the MOS data and we fit the pn spectra alone. In this case, the of the overall fit is better (572.91 for 469 d.o.f.) but now due to the lower signal-to-noise ratio, since the MOS data have been excluded, we can not constrain adequately the fitting parameters e.g. the black-hole spin parameter is and the inclination angle degrees.
Furthermore, as we have shown in Sect. 3.1, Fairall 9 does show flux variations during this XMM-Newton observation which are associated with spectral variations. In fact, the largest amplitude variations appear in the soft-band i.e. 0.5–1.5 keV. Therefore, it is not surprising that the fit-quality of (any) physically driven instantaneous spectral-model to the time-averaged spectrum may not be ‘acceptable’.444Obviously, it would be best to split the observation into smaller segments, e.g. three segments of 40 ks, and then fit the various models to the spectra of those segments. However, the source count-rate is not high enough in order to follow this approach and constrain the model parameters accurately. For these reasons, judging from the best-fit residuals plot in Fig. 10, we believe that Model 4 provides a broadly acceptable fit to the 0.5–10 keV spectrum of the source.
The new best-fit broad-band photon index is steeper than the one obtained from the best-fit Model 4 in the 3–10 keV (Sect. 5.2.3). Interestingly, the new best-fit broad-band values for the remaining model parameters i.e. inclination angle, emissivity index, ionization parameter, and BH spin parameter, are entirely consistent (within the 90 per cent confidence limits) with those we have obtained from the best-fit Model 4 to the 3–10 keV spectrum.
With respect to the BH spin-parameter, , Fig. 11 shows the form of the plot versus , used in order to derive its uncertainties , representing the 90 per cent confidence limit. Note here, a value of zero as well as the value of unity, are excluded at the 1 per cent significance level. We therefore conclude that relativistically blurred reflection from the innermost part of a slightly ionized disc, around a moderately spinning BH, may indeed be responsible for both the broad, asymmetric iron line and the ‘soft-excess’ emission that we detect from Fairall 9.
After estimating the best-fit parameters of Model 4 for the overall spectrum, we can compute the source X-ray flux and X-ray luminosity. In the 0.5–10 keV and 2–10 keV energy-ranges, the absorbedunabsorbed flux is (2.5[2.6]0.2) erg cm-2 s-1 and (1.5[1.5]0.1) erg cm-2 s-1, respectively. The corresponding X-ray luminosities for the same energy-bands are (1.26[1.33]0.03) erg s-1 and (0.76[0.77]0.05) erg s-1, respectively (the flux and luminosity errors correspond to one standard deviation in order to be easily comparable with previous observations). Finally, after applying the bolometric luminosity correction of Marconi et al. (2004) to the derived 2–10 keV X-ray luminosity, we get for Fairall 9 a bolometric luminosity of 2.34 erg s-1. This value corresponds to an Eddington luminosity ratio of 0.07, comparable to the one derived by Woo & Urry (2002) (see Sect. 1) but smaller by a factor of two than that derived by Schmoll et al. (2009).

| Number | Model-parameters | Model 2 | Model 3 | Model 4 | Model 4 (broad-band) |
| Redshift, z | 0.047 | 0.047 | 0.047 | 0.047 | |
| 1 | wabs: Column density, (cm-2) | 3.20 | 3.20 | 3.20 | 3.20 |
| 2 | zGauss: Fe K line-energy (keV) | 6.420.01 | 6.42 | 6.42 | 6.42 |
| 3 | zGauss: Fe K line-energy (keV) | 7.06 | 7.06 | 7.06 | 7.06 |
| 4 | zpowerlw: Photon index, | 1.85 | 1.97 | 1.84 | 2.01 |
| 5a | pexrav: Photon index, | 1.870.03 | 1.87 | 1.87 | 1.87 |
| 5b | pexrav: Relative reflection, | 0.87 | 0.87 | 0.87 | 0.87 |
| 5c | pexrav: Energy cut-off, (keV) | 200 | 200 | 200 | 200 |
| 5d | pexrav: Elem. Z2 abundance | 1 | 1 | 1 | 1 |
| 5e | pexrav: Iron abundance | 0.8 | 0.8 | 0.8 | 0.8 |
| 5f | pexrav: Inclination, (degrees) | 40 | 40 | 40 | 40 |
| 6a | laor: Line-energy (keV) | 6.750.18 | |||
| 6b | laor: Emissivity index, | 2.46 | |||
| 6c | laor: Inclination, (degrees) | 84 | |||
| 6d | laor: Inner radius () | 6 | |||
| 6e | laor: Outer radius () | 300 | |||
| 7a | kerrconv: Emissivity index, | 2.07 | 1.98 | ||
| 7b | kerrconv: Inclination, (degrees) | 50 | 64 | ||
| 7c | kerrconv: Spin parameter, | 0.43 | 0.39 | ||
| 7d | kerrconv: Inner radius, () | 1 | 1 | ||
| 7e | kerrconv: Outer radius, () | 400 | 400 | ||
| 8a | reflionx: Iron abundance | 0.8 | 0.8 | ||
| 8b | reflionx: Photon index, | Tied to param. 4 | Tied to param. 4 | ||
| 8c | reflionx: Ionization parameter, | 18.37 | 15.82 | ||
| (erg cm-2 s-1) | |||||
| d.o.f. | 600.29538 | 559.18536 | 578.88535 | 1052.63749 |
Values without uncertainties correspond to fixed fitting parameters.
6 Summary and Discussion
We have analysed a long observation of Fairall 9, obtained with the XMM-Newton observatory during December 2009. EPIC light-curves have been produced and studied in several energy-bands, a thorough X-ray spectral analysis has been performed on both the RGS and the EPIC data-sets.
The hardness-ratio analysis has revealed a ‘softer-when-brighter’ source-behaviour which is typical for radio-quiet type Seyfert galaxies. The observed spectral variations do not have a large amplitude, In particular, the 5–10 keV light-curve (Fig. 2, lower panel) shows a small amplitude flux-increase of the order of 10 per cent and a small fractional variability amplitude, 2.22.2 per cent. This result implies that our best-fit model results for the 3–10 keV spectral region should not be strongly affected by significant spectral variations which could make the study of the average spectrum problematic.
However, this is not the case for the lower energy-part of the spectrum between 0.5–2 keV (i.e. the ‘soft-excess’ spectral region) where the 0.5–1.5 keV light-curve (Fig. 2, top panel) exhibits an overall flux increase of 30 per cent and a fractional variability amplitude of 7.30.1 per cent. This indicates that any model fit to the overall broad-band average-spectrum will be affected by these variations. The 0.5–2 keV data have smaller uncertainties with respect to those in the 2–10 keV, and thus the soft-band data drive the overall fit by having larger statistical weight. In fact, these differences in the amplitude variations between the soft and the hard X-ray bands can possibly account for the statistically low-quality fit of Model 4 to the overall spectrum of the source.
The main results from our X-ray spectral analysis can be summarized as follows:
-
1.
Our view to the central source in Fairall 9 does not appear to be affected by significant absorption either from neutral or ionized material.
-
2.
Apart from a strong narrow iron emission-line and an absorption edge, we have also detected a broad emission feature in the 6.1–7.7 keV energy-band, which can be well explained with relativistically blurred reflection from the innermost part of a moderately ionized disc, around a moderately spinning BH.
Below, we discuss some implications of these two main results, within the context of current theoretical models of the X-ray emission in AGN.
6.1 On the absence of intrinsic absorption in Fairall 9
Early observations by EXOSAT and GINGA showed that around 50 per cent of all type Seyfert galaxies show strong evidence of warm-absorption (Turner & Pounds, 1989; Nandra & Pounds, 1994). Moreover ASCA observations suggested an even higher fraction of around 50–70 per-cent (Reynolds, 1997; George et al., 1998). Finally, Blustin et al. (2005), based on an XMM-Newton sample of 23 type Seyfert, found 17 objects having intrinsic ionized absorption, probably originating in outflows from the dusty torus.
Nevertheless, there is a significant population of type Seyfert galaxies that does not show any indication of strong X-ray warm-absorption features like: Akn 120 (Vaughan et al., 2004), Akn 564 (Papadakis et al., 2007), Mrk 205 (Reeves et al., 2001), Mrk 335 (Gondoin et al., 2002), Mrk 478 (Marshall et al., 2003), MCG–2-58-22 (Weaver et al., 1995), PKS 0558-504 (Papadakis et al., 2010), and TON S 180 (Turner et al., 2001; Vaughan et al., 2002) (but for this source see also Różańska et al. (2004) for very weak absorption features).
Our main result, from the spectral analysis of the RGS data, is that there is no indication of significant X-ray warm-absorbing material along the line of sight to the central nucleus of the Fairall 9. This is in agreement with the results of Gondoin et al. (2001). Even the 99.73 upper confidence limit of NH, 3.72 cm-2 (Fig. 5), is smaller then the column density of the warm-absorbing material in most type Seyfert galaxies (e.g. Blustin et al., 2005). This implies that our observations are not ‘contaminated’ by additional material between the central engine and us, making Fairall 9 an ideal source for studying the physical properties of the immediate environment of the BH.
The reason for the lack of warm-absorbing material in Fairall 9 (and the other sources listed above) remains still not fully understood. One possibility is that a significant column density of ionized gas exists but it is too highly ionized to show significant spectral features. We marginally detected weak emission-lines from ionized oxygen for which . This is a rather small value, and certainly not indicative of the presence of highly ionized material in the vicinity of Fairall 9’s nuclear region. Another possibility is that the covering fraction of the absorbing material is less than unity. This could naturally arise in the case when the absorbing material is associated with a disc-wind which rises perpendicularly from the disc at a narrow range of radii (e.g. Elvis et al., 2000).
Both the significant outflow velocity of the emitting gas, as well its main source of ionization, as inferred by the O vii K (f/r) ratio, 4.3 (i.e. photo-ionization), suggest that the emitting gas in Fairall 9 could be probably part of a nuclear wind driven out by radiation pressure. This same evidence is found in numerous other Seyfert galaxies, both absorbed (Guainazzi et al., 2008) and unabsorbed (Bianchi et al., 2009). It is commonly interpreted as a bi-conical outflow, launched from the innermost region of the AGN and spatially co-located with the optical ionization cones frequently seen in O iii emission in type Seyfert galaxies (Ogle et al., 2000; Bianchi et al., 2006).
6.2 The ‘bare’ central nucleus of Fairall 9
Our X-ray spectral results from the analysis of the pn and MOS data of Fairall 9, are in full agreement with the ‘canonical’ picture for the central region in Type I AGN, as it has been established the last 20 years. For example, the best-fit power-law continuum slope-estimate, coming from fitting Model 4 to the broad-band data in the 0.5–10 keV energy-range, is . This value is slightly softer than the one derived by Gondoin et al. (2001), 1.80 using earlier XMM-Newton data, (but still in accordance within the errors), and harder from the one reported by Schmoll et al. (2009), 2.09 using Suzaku data. This is absolutely in accordance with the spectral variability behaviour of the source as a function of flux. During this XMM-Newton observations the source flux in the 0.5–10 keV energy-range is around 2.510-11 erg cm-2 s-1 (Sect. 5.3). Gondoin et al. (2001) derived an equal value for the flux, in contrast to Schmoll et al. (2009) who derived a higher flux of 4 erg cm-2 s-1. Therefore, given the ‘softer-when-brighter’ source-behaviour, it is not surprising that the XMM-Newton spectral slope is slightly harder than that derived from the Suzaku data.
Moreover, we have detected a narrow emission iron line at 6.42 keV (in the source’s rest-frame). The best-fit value of the eqw for this line, is 10319 eV which is somehow lower from the ones derived by Gondoin et al. (2001) and Schmoll et al. (2009), 120 eV (no errors are quoted) and 13010 eV, respectively, but still within the quoted errors. Nowadays, narrow iron lines, at 6.4 keV (in the source’s rest-frame), are detected almost universally in bright AGN X-ray spectra. The eqw of this line in our spectrum is very consistent to those observed in other sources. For example, Bianchi et al. (2009), studying the spectra of 81 AGN, estimated an average eqw of the narrow Fe K line of 766 keV. Similar results have also been reported by Nandra et al. (2007) and de La Calle Pérez et al. (2010).
This narrow iron line is usually attributed to reprocessing from cold Compton-thick matter which is most probably associated with the putative, distant molecular-torus in Seyfert galaxies (e.g. Matt et al., 1991). Based on our best-fit results of Model 3, we find a reflection fraction of . From our estimate, the distant reflector should subtend an apparent solid angle of around sr at the X-ray source. However, a more accurate statement about this and about the opening angle of the torus, can be made only by fitting to the data a physical model of the torus itself, rather than a slab (as we have done by using the XSPEC model pexrav) to account for the continuum reflection associated with the narrow iron line.
Following the best-fit linear model (Bianchi et al., 2007) of the Iwasawa-Taniguchi (IT) effect (Iwasawa & Taniguchi, 1993), indicating the scenario of anticorrelation between the narrow Fe K emission-line and the 2–10 keV luminosity, we expect an eqw of 56 eV (for a source luminosity in 2–10 keV energy-range of 0.77 erg s-1, Sect. 5.3). In order to check the consistency between our direct estimates and the value predicted by the IT effect, we perform a -test. The value of -statistic is -4.38555Note that the standard deviation of the estimated eqw of Fe K line is 10 eV, having a chance coincidence probability of only 1.17. That means that with more than 99.99 per cent confidence we can reject the null hypothesis that the measured eqw of the Fe K line is comparable to that predicted by the IT relation.
The broad residuals of Model 2 around 6.1–7.7 keV (Fig. 7, top panel), can be modeled very well by a relativistically blurred disc-reflection model. A similar broad-emission spectral feature has also been observed by Suzaku from the same source (Schmoll et al., 2009). Due to the lack of any significant warm-absorption in the nucleus of Fairall 9, this picture should unveil directly the physical properties prevailing in the immediate environment of the BH. What is even more interesting is the fact that the same relativistically blurred disc-reflection model can also account satisfactorily, under certain assumptions (see Sect. 5.3), for the ‘soft-excess’ emission that we also detect from Fairall 9.
The emissivity index that we have derived from the best-fit Model 4 to the overall X-ray spectrum is . Schmoll et al. (2009) found an upper bound of 5 but more stringent constraints have been derived by Patrick et al. (2011), , which agrees reasonably well with our findings.
Our best-fit value for the BH spin parameter for Fairall 9, , is in accordance with the one derived by Schmoll et al. (2009), , using the Suzaku data. The latter value comes from a broader-band spectral-fit in the 0.7–10 keV (X-ray Imaging Spectrometer) and 12–30 keV (Hard X-ray detector/PIN) whereas ours has been derived from a smaller spectral-range of 0.5–10 keV. Note that after ignoring the spectral measurements below 2 keV, Schmoll et al. (2009) got a value of . Also, Patrick et al. (2011), used the same Suzaku data of Fairall 9, together with the hard X-ray data from the BAT, on board the SWIFT satellite. By performing spectral-fits in the 0.5–100 keV energy-range (excluding 2.7–1.95 keV and 10–15 keV) they obtained a value of which is even more consistent with our estimate.
Recent theories studying the effects of chaotic accretion episodes on the BH spin-parameter (King et al., 2008), predict that should peak at around 0.1–0.2 for a BH mass of , depending on the vertical viscosity of the accretion disc. On the other hand, prolonged accretion should result in much larger spin-parameters, of the order of (Berti & Volonteri, 2008). Consequently, the BH spin-parameter of around 0.4, that we found for Fairall 9, is more consistent with models which favour a chaotic accretion scenario.
Up to now, rather few studies have been conducted to specify the BH spin-parameter, , for the type Seyfert galaxies. A value of has been reported for MCG–6-30-15 (Brenneman & Reynolds, 2006) and (Miniutti et al., 2009) found for SWIFT J2127.4+5654 a value of . Moreover Zoghbi et al. (2010) found a high BH spin parameter value of for 1H 0707-495 and Gallo et al. (2010) derived a value of 0.7 for Mrk 79. Finally, Patrick et al. (2011) suggested intermediate BH spin-parameters for Mrk 335 and NGC 7469 of 0.70 and 0.69, respectively.
This long-look XMM-Newton observation of Fairall 9 has revealed that we are dealing with a ‘clean’ source since our X-ray spectrum is not affected by significant warm-absorption. Having this uncontaminated view of the central engine, a single relativistic disc-reflection model can explain the overall emission from 0.5 keV up to 10 keV. The existence of a moderately spinning Kerr BH is strongly favoured from our data consolidating firmly that this source is in the intermediate spin-class of AGN.
Acknowledgments
DE and IMM acknowledge the Science and Technology Facilities Council (STFC) for support under grant ST/G003084/1. IP and FN acknowledge support by the EU FP7-REGPOT 206469 grant. PA acknowledges support from Fondecyt grant-number 1110049. This research has made use of NASA’s Astrophysics Data System Bibliographic Services. Finally, we are grateful to the anonymous referee not only for the very prompt review, but also for the useful comments and suggestions that helped improved the quality of the manuscript substantially.
References
- Arnaud (1996) Arnaud K. A., 1996, in ASP Conf. Ser. 101: Astronomical Data Analysis Software and Systems V, Jacoby G. H., Barnes J., eds., pp. 17–+
- Bardeen et al. (1972) Bardeen J. M., Press W. H., Teukolsky S. A., 1972, ApJ, 178, 347
- Berti & Volonteri (2008) Berti E., Volonteri M., 2008, ApJ, 684, 822
- Bianchi et al. (2006) Bianchi S., Guainazzi M., Chiaberge M., 2006, A&A, 448, 499
- Bianchi et al. (2007) Bianchi S., Guainazzi M., Matt G., Fonseca Bonilla N., 2007, A&A, 467, L19
- Bianchi et al. (2009) Bianchi S., Guainazzi M., Matt G., Fonseca Bonilla N., Ponti G., 2009, A&A, 495, 421
- Blackburn (1995) Blackburn J. K., 1995, in ASP Conf. Ser. 77: Astronomical Data Analysis Software and Systems IV, Shaw R. A., Payne H. E., Hayes J. J. E., eds., pp. 367–+
- Blustin et al. (2005) Blustin A. J., Page M. J., Fuerst S. V., Branduardi-Raymont G., Ashton C. E., 2005, A&A, 431, 111
- Brenneman & Reynolds (2006) Brenneman L. W., Reynolds C. S., 2006, ApJ, 652, 1028
- Brenneman & Reynolds (2009) —, 2009, ApJ, 702, 1367
- Brinkmann et al. (2007) Brinkmann W., Papadakis I. E., Raeth C., 2007, A&A, 465, 107
- Crummy et al. (2006) Crummy J., Fabian A. C., Gallo L., Ross R. R., 2006, MNRAS, 365, 1067
- de La Calle Pérez et al. (2010) de La Calle Pérez I., et al., 2010, A&A, 524, A50+
- Dickey & Lockman (1990) Dickey J. M., Lockman F. J., 1990, ARA&A, 28, 215
- Elvis et al. (2000) Elvis M., Fiore F., Siemiginowska A., Bechtold J., Mathur S., McDowell J., 2000, ApJ, 543, 545
- Fairall (1977) Fairall A. P., 1977, MNRAS, 180, 391
- Forman et al. (1978) Forman W., Jones C., Cominsky L., Julien P., Murray S., Peters G., Tananbaum H., Giacconi R., 1978, ApJS, 38, 357
- Gabriel et al. (2004) Gabriel C., et al., 2004, in Astronomical Society of the Pacific Conference Series, Vol. 314, Astronomical Data Analysis Software and Systems (ADASS) XIII, F. Ochsenbein, M. G. Allen, & D. Egret, ed., pp. 759–+
- Gallo et al. (2010) Gallo L. C., Miniutti G., Miller J. M., Brenneman L. W., Fabian A. C., Guainazzi M., Reynolds C. S., 2010, MNRAS, 1686
- George et al. (1998) George I. M., Turner T. J., Netzer H., Nandra K., Mushotzky R. F., Yaqoob T., 1998, ApJS, 114, 73
- Gondoin et al. (2001) Gondoin P., Lumb D., Siddiqui H., Guainazzi M., Schartel N., 2001, A&A, 373, 805
- Gondoin et al. (2002) Gondoin P., Orr A., Lumb D., Santos-Lleo M., 2002, A&A, 388, 74
- Guainazzi et al. (2008) Guainazzi M., Barbarisi I., Bianchi S., Osuna P., Salgado J., 2008, Advances in Space Research, 41, 1998
- Holmberg et al. (1978) Holmberg E. B., Lauberts A., Schuster H., West R. M., 1978, A&AS, 31, 15
- Iwasawa & Taniguchi (1993) Iwasawa K., Taniguchi Y., 1993, ApJ, 413, L15
- Kaastra & Mewe (1993) Kaastra J. S., Mewe R., 1993, A&AS, 97, 443
- King et al. (2008) King A. R., Pringle J. E., Hofmann J. A., 2008, MNRAS, 385, 1621
- Krongold et al. (2003) Krongold Y., Nicastro F., Brickhouse N. S., Elvis M., Liedahl D. A., Mathur S., 2003, ApJ, 597, 832
- Laor (1991) Laor A., 1991, ApJ, 376, 90
- Lauberts & Valentijn (1989) Lauberts A., Valentijn E. A., 1989, The surface photometry catalogue of the ESO-Uppsala galaxies, Lauberts, A. & Valentijn, E. A., ed.
- Magdziarz & Zdziarski (1995) Magdziarz P., Zdziarski A. A., 1995, MNRAS, 273, 837
- Marconi et al. (2004) Marconi A., Risaliti G., Gilli R., Hunt L. K., Maiolino R., Salvati M., 2004, MNRAS, 351, 169
- Marshall et al. (2003) Marshall H. L., Edelson R. A., Vaughan S., Malkan M., O’Brien P., Warwick R., 2003, AJ, 125, 459
- Mateos et al. (2009) Mateos S., Saxton R. D., Read A. M., Sembay S., 2009, A&A, 496, 879
- Matt et al. (1991) Matt G., Perola G. C., Piro L., 1991, A&A, 247, 25
- McHardy et al. (1981) McHardy I. M., Lawrence A., Pye J. P., Pounds K. A., 1981, MNRAS, 197, 893
- Miller (2007) Miller J. M., 2007, ARA&A, 45, 441
- Miniutti et al. (2009) Miniutti G., Panessa F., de Rosa A., Fabian A. C., Malizia A., Molina M., Miller J. M., Vaughan S., 2009, MNRAS, 398, 255
- Molendi et al. (2003) Molendi S., Bianchi S., Matt G., 2003, MNRAS, 343, L1
- Morini et al. (1986) Morini M., et al., 1986, ApJ, 307, 486
- Nandra et al. (2007) Nandra K., O’Neill P. M., George I. M., Reeves J. N., 2007, MNRAS, 382, 194
- Nandra & Pounds (1994) Nandra K., Pounds K. A., 1994, MNRAS, 268, 405
- Nicastro et al. (2002) Nicastro F., et al., 2002, ApJ, 573, 157
- Ogle et al. (2000) Ogle P. M., Marshall H. L., Lee J. C., Canizares C. R., 2000, ApJ, 545, L81
- Papadakis et al. (2010) Papadakis I. E., Brinkmann W., Gliozzi M., Raeth C., Nicastro F., Conciatore M. L., 2010, A&A, 510, A65+
- Papadakis et al. (2007) Papadakis I. E., Brinkmann W., Page M. J., McHardy I., Uttley P., 2007, A&A, 461, 931
- Patrick et al. (2011) Patrick A. R., Reeves J. N., Porquet D., Markowitz A. G., Lobban A. P., Terashima Y., 2011, MNRAS, 411, 2353
- Peterson et al. (2004) Peterson B. M., et al., 2004, ApJ, 613, 682
- Petre et al. (1984) Petre R., Mushotzky R. F., Holt S. S., Krolik J. H., 1984, ApJ, 280, 499
- Piccinotti et al. (1982) Piccinotti G., Mushotzky R. F., Boldt E. A., Holt S. S., Marshall F. E., Serlemitsos P. J., Shafer R. A., 1982, ApJ, 253, 485
- Porquet & Dubau (2000) Porquet D., Dubau J., 2000, A&AS, 143, 495
- Rees (1984) Rees M. J., 1984, ARA&A, 22, 471
- Reeves et al. (2004) Reeves J. N., Nandra K., George I. M., Pounds K. A., Turner T. J., Yaqoob T., 2004, ApJ, 602, 648
- Reeves et al. (2001) Reeves J. N., Turner M. J. L., Pounds K. A., O’Brien P. T., Boller T., Ferrando P., Kendziorra E., Vercellone S., 2001, A&A, 365, L134
- Reynolds (1997) Reynolds C. S., 1997, MNRAS, 286, 513
- Ross & Fabian (2005) Ross R. R., Fabian A. C., 2005, MNRAS, 358, 211
- Różańska et al. (2004) Różańska A., Czerny B., Siemiginowska A., Dumont A., Kawaguchi T., 2004, ApJ, 600, 96
- Schmoll et al. (2009) Schmoll S., et al., 2009, ApJ, 703, 2171
- Sobolewska & Papadakis (2009) Sobolewska M. A., Papadakis I. E., 2009, MNRAS, 399, 1597
- Turner et al. (2001) Turner T. J., et al., 2001, ApJ, 548, L13
- Turner et al. (2005) Turner T. J., Kraemer S. B., George I. M., Reeves J. N., Bottorff M. C., 2005, ApJ, 618, 155
- Turner et al. (2002) Turner T. J., et al., 2002, ApJ, 574, L123
- Turner & Pounds (1989) Turner T. J., Pounds K. A., 1989, MNRAS, 240, 833
- Vaughan et al. (2002) Vaughan S., Boller T., Fabian A. C., Ballantyne D. R., Brandt W. N., Trümper J., 2002, MNRAS, 337, 247
- Vaughan et al. (2003) Vaughan S., Edelson R., Warwick R. S., Uttley P., 2003, MNRAS, 345, 1271
- Vaughan et al. (2004) Vaughan S., Fabian A. C., Ballantyne D. R., De Rosa A., Piro L., Matt G., 2004, MNRAS, 351, 193
- Weaver et al. (1995) Weaver K. A., Nousek J., Yaqoob T., Hayashida K., Murakami S., 1995, ApJ, 451, 147
- Woo & Urry (2002) Woo J., Urry C. M., 2002, ApJ, 579, 530
- Wood et al. (1984) Wood K. S., et al., 1984, ApJS, 56, 507
- Yaqoob et al. (1999) Yaqoob T., George I. M., Nandra K., Turner T. J., Zobair S., Serlemitsos P. J., 1999, ApJ, 525, L9
- Zoghbi et al. (2010) Zoghbi A., Fabian A. C., Uttley P., Miniutti G., Gallo L. C., Reynolds C. S., Miller J. M., Ponti G., 2010, MNRAS, 401, 2419