The Radio - 2 mm Spectral Index of the Crab Nebula Measured with GISMO***Based on observations carried out with the IRAM 30m Telescope. IRAM is supported by INSU/CNRS (France), MPG (Germany) and IGN (Spain).
Abstract
We present results of 2 mm observations of the Crab Nebula, obtained using the Goddard-IRAM Superconducting 2 Millimeter Observer (GISMO) bolometer camera on the IRAM 30 m telescope. Additional 3.3 mm observations with the MUSTANG bolometer array on the Green Bank Telescope are also presented. The integrated 2 mm flux density of the Crab Nebula provides no evidence for the emergence of a second synchrotron component that has been proposed. It is consistent with the radio power law spectrum, extrapolated up to a break frequency of or GHz. The Crab Nebula is well-resolved by the beam (FWHM) of GISMO. Comparison to radio data at comparable spatial resolution enables us to confirm significant spatial variation of the spectral index between 21 cm and 2 mm. The main effect is a spectral flattening in the inner region of the Crab Nebula, correlated with the toroidal structure at the center of the nebula that is prominent in the near–IR through X-ray regime.
Subject headings:
ISM: individual (Crab Nebula) — ISM: supernova remnants — Radiation mechanisms: non-thermal1. Introduction
The Crab Nebula is the prototypical example of a pulsar wind nebula (PWN), plerion, or filled–center supernova remnant (Davidson & Fesen, 1985; Gaensler & Slane, 2006; Hester, 2008). As one of the brighter objects in the sky across the entire electromagnetic spectrum from the radio to gamma rays, the Crab Nebula is often one of the first targets observed by new instruments, whether they provide new spectral windows, or offer improvements in sensitivity, or spatial or spectral resolution (e.g. Bolton & Stanley, 1949; Marsden et al., 1984; Temim et al., 2006; Waller et al., 1995; Bowyer et al., 1964; Fazio et al., 1972).
At radio wavelengths the Crab Nebula’s integrated emission is well known to exhibit a power law spectrum , with a spectral index (Baars et al., 1977). This spectral index is fairly typical of the synchrotron emission exhibited by PWNe, and is distinctly flatter than the spectral indices of more common shell-like SNRs where the relativistic electrons are accelerated in the shocks of the expanding blast wave rather than by a pulsar wind. In the optical regime, the synchrotron emission exhibits a steeper spectral index (e.g. Veron-Cetty & Woltjer, 1993). Thus, a spectral break has been inferred to lie at wavelengths between 10 and 1000 (Marsden et al., 1984; Woltjer, 1987). However, the sharpness of the break and the exact location are somewhat obscured by the difficulty in obtaining high precision measurements at mm wavelengths, and the presence of stronger thermal emission from dust at mid IR wavelengths (Marsden et al., 1984; Mezger et al., 1986; Strom & Greidanus, 1992). The dust is associated with the knots and filaments of ejecta in the Crab Nebula, although spectral observations have not revealed characteristic features such as silicate or PAH bands in the spectrum (Douvion et al., 2001; Temim et al., 2006).
Resolved imaging of the Crab Nebula indicates that there is very little variation in the radio spectral index across the Crab Nebula (Bietenholz et al., 1997). There has been some indication of a spectral index variation between the radio and mm regimes, suggesting the possibility of a physically distinct, second synchrotron component (Bandiera et al., 2002), although Green et al. (2004) argue that the variations may in fact be due to known temporal variability of the SNR.
In this paper, we further probe the synchrotron component using a map we obtained with the GISMO 2 mm camera on the IRAM 30 m telescope. The paper is organized as follows: in section 2 we introduce the various maps that were used. In the process we describe the GISMO instrument, the data reduction package (CRUSH) and the data analysis. The 21 cm and 6 cm radio maps used for comparison are introduced. In section 3, we study the integrated radio/sub-millimeter spectrum of the SNR. We derive the location of the break in the spectrum. In section 4, we present and discuss spectral index maps created by comparison of the GISMO data with the radio maps. We also discuss the correlation of features in the spectral index maps with features at other wavelengths (section 5). Finally our conclusions are stated in section 6.
2. Observations
2.1. GISMO Data
The Crab Nebula was observed at the 30 m telescope located on Pico Veleta (near Granada, Spain) and operated by the Institute de Radioastronomie Millimétrique (IRAM) (Baars et al., 1987). The observations were centered at . The data were obtained during the first run of the Goddard-IRAM Superconducting 2 Millimeter Observer (GISMO) in November of 2007.
The GISMO instrument is a bolometric camera developed for operation in the 2 mm atmospheric window. The central frequency of the GISMO band is 150 GHz, with (or a bandwidth of 22 GHz @ 150 GHz). The instrument uses an 816 planar array of multiplexed superconducting transition edge sensor (TES) bolometers which incorporates the Backshort Under Grid (BUG) architecture (Allen et al., 2006). The size and sensitivity of the detector array (Staguhn et al., 2006) give this instrument significantly greater mapping speed at higher angular resolution in this wavelength than has previously been possible. GISMO has a pixel size of 2 mm which provides for an angular separation of on the sky corresponding to a sampling of at 2 mm wavelength. With an array of pixels, the GISMO instrument has a gapless field of view of which allows it to take advantage of a significant fraction of the telescope’s optical capabilities. The FWHM of the beam at 2 mm is , which is wider than the ideal diffraction limited beam. Staguhn et al. (2008) gives a more detailed description of the instrument. On this first run of the instrument, there was a mechanical problem that caused one quadrant of the pixels to malfunction. The data reduction also identified pixels that exhibited increased noise and these too were excised, leaving 62 detector pixels used for this analysis.
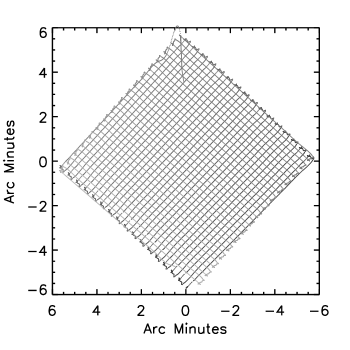
The maps were obtained on November 12, 2007 using five pairs of on-the-fly scans. The first scan in each pair used 33 scan lines in the azimuth, long, offset by . The second scan of each pair transposes the same pattern with 33 scan lines in elevation (Fig. 1). Each scan lasts 512 seconds, and a pair of scans requires 1035 seconds. The integration time per pixel in the final map is 7.4 sec for each pair of scans. During a complete raster scan each element of the bolometer array then samples the whole of the Crab which has an apparent size of (Trimble, 1973).
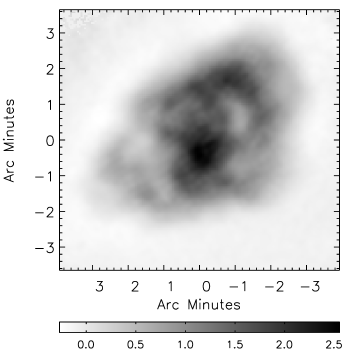
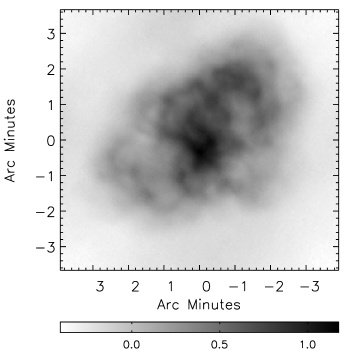
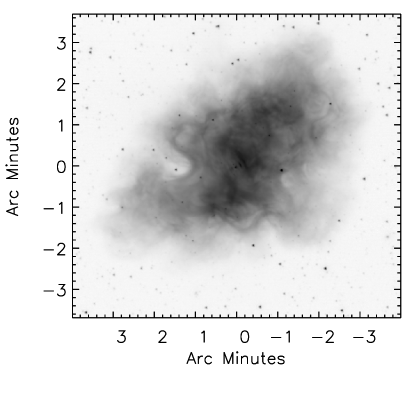
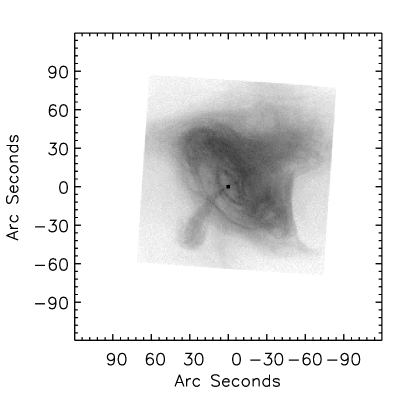
The data were reduced using the Comprehensive Reduction Utility for SHARC-2 (CRUSH; Kovács, 2008). CRUSH was initially developed for data reduction of SHARC-2 observations, but it has been enhanced to reduce data from other instruments, including GISMO. CRUSH uses an iterated sequence of statistical estimators to separate source, atmosphere and instrument signals. As part of this reduction, the final map is smoothed by a Gaussian function with 2/3 beam width (the CRUSH default for faint sources) to have an effective FWHM of . This smoothing is done to minimize spurious high spatial frequency features that are related to the relatively coarse sampling of the beam with the the GISMO detector pixels (Kovács, 2008). The final map produced by CRUSH has a pixel scale of (Figure 2). The noise level of the map varies as a function of position due to the coverage of the scans, but over the region where the Crab Nebula is brighter than 0.5 Jy beam-1 the noise level is Jy beam-1.
The total integrated flux density of the Crab Nebula is determined to be Jy at 2 mm, after adjustment for the slightly negative local background level in the image produced by CRUSH. This value is based on use of Saturn as a calibrator, which was observed after the Crab Nebula during a period of poorer weather ( vs. ).
2.2. MUSTANG Data
Additional observations of the Crab Nebula were carried out with Multiplexed Squid TES Array at Ninety GHz (MUSTANG; Dicker et al., 2008) instrument on the Green Bank Telescope (GBT). The data were acquired during Feb 2008, under project code AGBT08A056. The data were calibrated relative to Mars using Weiland et al. (2011) and Wright (2007). A map was made with a maximum likelihood imaging pipeline developed for the Atacama Cosmology Telescope (ACT; Fowler et al., 2010) that was adapted for use with MUSTANG (Figure 2). The MUSTANG camera has (FWHM) spatial resolution, compared to for the GISMO instrument. Due to the comparatively small instantaneous FOV of MUSTANG (), the total integrated flux density for the Crab Nebula is not well constrained. Structures on angular scales from to are recovered with good fidelity.
2.3. Radio Data
To understand the synchrotron emission from the Crab Nebula, we compared the GISMO 2 mm map to radio maps at lower frequencies. Radio maps at two different frequencies and two different epochs were used for comparison. The first map at 1.41 GHz (21 cm) was obtained using all 4 configurations of the VLA over the period from 1987–1988 (Bietenholz & Kronberg, 1990). This image has a cleaned beam size of . A second VLA map at 5 GHz (6 cm) was obtained during 2001, and has a cleaned beam size of (Bietenholz et al., 2001). The 5 GHz image (only) has been corrected for the VLA’s primary beam response ( FWHM at 5 GHz).
For comparison with the GISMO image, the radio images were rescaled in both size and brightness. We have used 1987.49 as the epoch of the 1.4 GHz image, and 2007.87 is the epoch for the GISMO image. This 20.38 yr time difference results in a 3.1% increase in the size the nebula according the the expansion measured by Bietenholz et al. (1991). This expansion corresponds to of the GISMO beam width at the outermost edges of the SNR. There is a 3.5% decrease in the radio brightness between the dates of the 1.41 GHz VLA and 2 mm GISMO observations, assuming a fading rate of -0.167% yr-1 (Aller & Reynolds, 1985). More recent reports (Vinyaikin, 2007; Weiland et al., 2011) confirm that the fading rate is not a strong function of frequency or time. After applying these corrections to the radio image, the map was convolved with a Gaussian function to match the 07 resolution of the GISMO data. Equivalent adjustments were made to the 5 GHz VLA image, resulting in a size increase of 1.05% and a brightness decrease of 1.169%. The similarity of results derived from both the 1.41 and 5 GHz images indicates that the corrections for expansion are sufficiently accurate at GISMO resolution.
3. Integrated Flux Density and Spectral Index
Figure 3 shows the integrated spectrum of the Crab Nebula including the 2 mm GISMO flux density, and other measurements from the radio to optical wavelengths (30 cm – 3000 Å or 1 – GHz). All flux densities have been corrected to the GISMO epoch of 2007.87. The 2 mm GISMO flux density is consistent with an extrapolation of the 1 – 35 GHz radio spectrum with a power law index as determined by Baars et al. (1977).

At 10 m to 200 m, the spectrum exhibits a bump due to thermal emission from dust. Shorter wavelengths appear to resume a power law spectrum, but with a steeper slope than at the radio - mm wavelengths. We characterize the spectrum by fitting a broken power law of:
| (1) |
characterized by the four parameters , , , and . The 10 - 100 measurements are not used to constrain the fit because of the possible influence of the dust emission at these wavelengths. At the shorter wavelengths we choose to constrain the fit only with the 3.6 – 8 Spitzer IRAC measurements of Temim et al. (2006), because the near-IR and optical measurements are much more dependent on the application of extinction corrections, and may also be affected by additional intrinsic steepening of the spectrum. We find (or Jy), (or GHz), , and . The low frequency spectral index, , is consistent with Baars et al. (1977), while the high frequency spectral index, , is consistent with result () obtained by Douvion et al. (2001) using ISO ISOCAM data covering the central of the SNR at 4.5 and 11.4 (LW1 and LW8 filters). If the near-IR data of Graselden were included in the fit, then would decrease by , would increase (flatten) by , and would remain unchanged. Additional inclusion of the optical measurements would result in very significant changes in the derived break frequency () and a steeper high frequency spectral index (). However this fit systematically overshoots the IRAC measurements, especially at 8 m where dust and line emission should result in an enhancement over the synchrotron emission. Therefore we conclude that there is either a problem with the extinction correction or relative calibration of the optical observations, or the intrinsic synchrotron spectrum has curvature or additional breaks such that it cannot be properly characterized by a single power law at mid-IR to optical wavelengths.
A detailed account of the synchrotron spectrum of the Crab Nebula (and other pulsar wind nebulae) is provided by the diffusive synchrotron radiation (DSR) model of Fleishman & Bietenholz (2007). In the DSR model, the magnetic field is tangled on a range of spatial scales characterized by a power law index () and a maximum scale length (). The predicted emission spectrum will contain a break at a frequency that is a function of and , the magnetic field strength (), and the minimum energy () of the power law distribution of relativistic particles, specifically . Adopting nominal values of these parameters Fleishman & Bietenholz (2007) find the break frequency to be at GHz. A shift in the break frequency may be accommodated by adjusting any or all of the parameters. With being fairly strictly constrained to values of by the spectral index of the low frequency (radio) emission (), the value of will be most sensitive to changes in and least sensitive to changes in .
The GISMO measurement and our analysis support the conclusion of Green et al. (2004) that the integrated spectrum of the Crab Nebula continues as a power law from the radio regime down to wavelengths . While the Bandiera et al. (2002) 1.3 measurement lies slightly above the power law, the integrated spectrum including newer data does not exhibit a significant excess component at millimeter wavelengths. The 170 ISO measurement (Green et al., 2004) seems to confirm the location of the break. Future observations in the 200 – 800 range should help to better refine the location and sharpness of the break.
4. Spectral Index Maps
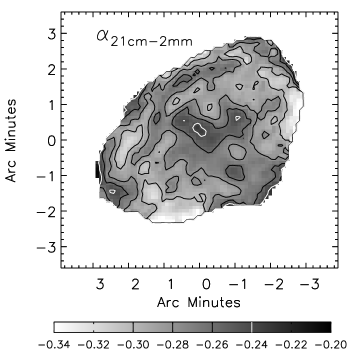
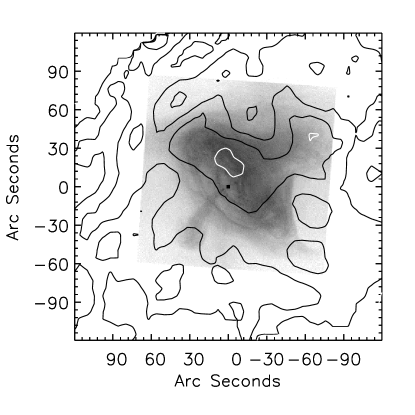
Maps at resolution of the Crab Nebula’s spectral index between 2 mm and radio wavelengths are shown in Figure 4. These maps show significant structure in the spectral index, and strongly resemble those of Bandiera et al. (2002) (1.3 mm - 21 cm) and Green et al. (2004) (850 - 21 cm). There is a slight offset between the mean spectral index of the two maps because the radio data themselves are not an exact match to the spectral index. A multiplicative scale error in the absolute calibration of the radio (or GISMO) data will affect the mean spectral index, but not any relative variations in spectral index. Therefore, the contours chosen for Fig. 4 are slightly offset to emphasize the strong similarity in structure between the two spectral index maps.
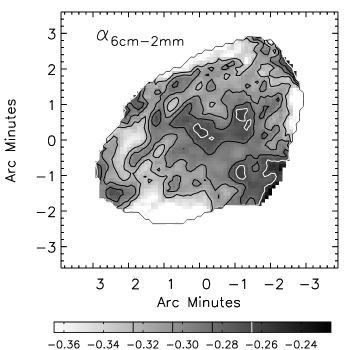
The random uncertainties (noise) in the intensity maps propagate into uncertainties in the derived spectral index. For , we have . For spectral indices involving the GISMO (150 GHz) and VLA (1.4 or 5 GHz) data, the random uncertainties are dominated by the GISMO data. Except at the faint edges of the SNR, the random uncertainties in the GISMO data are (See section 2.1). Thus .
Although the random uncertainties spectral index maps are relatively modest, there are at least four potential sources of systematic errors which may affect the apparent structure in these spectral index maps. The first is the significant difference in the resolution of the original maps. The radio maps were convolved to the resolution of the GISMO image (§2.3). However, if this process did not accurately reproduce the GISMO beam, then there would be artificial changes in the spectral index in regions where there are steep brightness gradients. To check for errors introduced by a resolution mismatch, the convolved resolution of the radio map was changed by a factor of 50%. This produced minimal changes the spectral index map, indicating that the observed spectral index variations are not a result of mismatched resolution.
A second potential source of error is improper background subtraction. The background levels were checked by examining the correlation of the radio and 2 mm intensities at intermediate brightness levels ( MJy sr-1). The correlations between the radio and GISMO images are very linear and extrapolate to zero intercepts indicating 2 mm background errors of MJy sr-1 with respect to the 21 cm data, and MJy sr-1 with respect to the 6 cm data. Comparison with Figure 2 indicates that except in the outermost portions of the SNR, this background error is of the observed surface brightness, and thus any induced errors in the spectral index should be , (much less in the brighter central regions). Furthermore, as the background errors have opposite signs with respect to the 21 and 6 cm images, yet the spectral index maps are very similar, we conclude that improper background subtraction cannot account for the observed structure in the central regions of the spectral index maps. However, at the edges of the Crab Nebula, the emission of the SNR falls to levels at or below the uncertainty in the background. Therefore, we cannot reliably determine changes in the spectral index at the edges of the SNR and do not draw conclusions about the spectral index in the outermost of the maps shown in Figure 4.
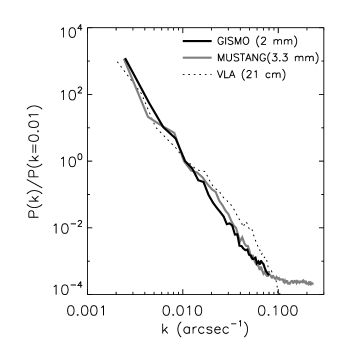
A third possible source of error is that either the radio or the 2 mm images may be missing flux at particular spatial scales. This may clearly affect the radio data due to the limited coverage provide by an interferometer such as the VLA. It may also affect the GISMO data due to the periodic nature of the scan pattern and the processing needed to separate and remove the temporal variation of the atmospheric emission. The radio maps were created using Maximum Entropy Deconvolution provided with a low- resolution model to account for flux at missing spatial scales. The GISMO maps were reduced using the CRUSH package which iteratively removes celestial, foreground, and instrument components as measured with the scan pattern one-by-one until all that remains is the source and white noise. Figure 5 shows the normalized spatial power spectra ( as a function of spatial frequency ) of the 2 mm GISMO map, the 3.3 mm map, and the 21 cm radio map. For each data set, the power spectrum is calculated on the images at their original spatial resolution. The 2 mm and 21 cm power spectra are well correlated at low spatial frequencies (, or spatial scales ). Because of the larger PSF, the power seen by GISMO (and MUSTANG) becomes increasingly attenuated with respect to that of measured by the VLA at smaller scales. At the smallest angular scales, the MUSTANG power spectrum flattens due to white noise (instrumental in nature, and thus unaffected by the beam). This comparison indicates that missing flux at certain spatial scales is not a likely source of the observed spectral index variations.
The fourth potential source of error may be caused by the difference in the epochs of the two maps. In addition to the overall evolution in the Crab Nebula’s size and brightness, there have been observations of very rapid changes at small spatial scales at optical, X-ray, and radio wavelengths (e.g. Hester et al., 1995; Greiveldinger & Aschenbach, 1999; Bietenholz et al., 2004). However, the similarity between the 21 cm and 6 cm spectral index maps provides a strong indicator that the temporal variations are not significant. For temporal changes to be responsible for the observed spectral index variations, they would need to be negligible between 1987 and 2001 (the epochs of the radio maps), and then rapidly become significant in the interval from 2001 to 2008.
We also attempted to calculate the 2 - 3.3 mm and 1.3 - 2 mm spectral index maps using the GISMO data and either the 3.3 mm MUSTANG data or the 1.3 mm MAMBO (Bandiera et al., 2002) observations. However, because of the close proximity of the wavelengths, small errors in the background or large scale structure lead to magnified effects in the derived spectral index, which cause the resulting spectral index map to be unreliable. The mm data sets alone are insufficient to provide accurate spectral index maps over such small ranges in wavelength.
5. Discussion
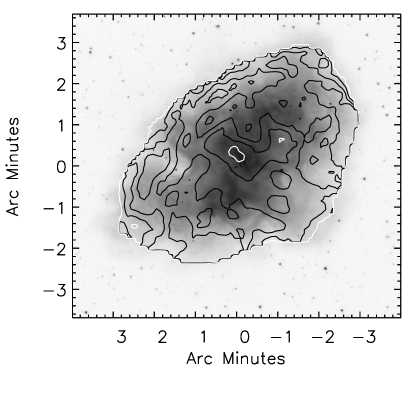
Having ruled out various sources of systematic error above, we conclude that the observed spectral index variations shown in Figure 4 are real properties of the SNR, and are not caused by systematic effects inherent in the data or the analysis procedures. The reality of the spectral index variations is strengthened by a very strong correlation with those found by Bandiera et al. (2002) at 1.3 mm and Green et al. (2004) at 850 using different instruments. Additionally, in Figure 6 we compare the spectral index with the synchrotron emission as depicted at IR (catalog ADS/Sa.Spitzer#0034837248) and X-ray (catalog ADS/Sa.CXO#obs/01997) wavelengths. The regions of flatter spectral index are well correlated with the toroidal structure of emission that surrounds the pulsar. This structure is present at IR wavelengths, but is most distinct at X-ray wavelengths.
Bandiera et al. (2002) have argued that the spectral index variations, along with the integrated 1.3 mm flux density which appeared to lie above the extrapolation of the radio synchrotron spectrum, were indications of a distinct synchrotron component generated by a separate population of relativistic electrons. With measurements at 850 , Green et al. (2004) found similar spectral index variations, but with better signal to noise and correspondingly less apparent small-scale structure. However, their integrated flux density is a good match to the extrapolation of the radio spectrum. They conclude that a second synchrotron component is not required, and suggest that the known temporal variations in the region near the pulsar may be responsible for the flatter spectral index in the region. From analysis of WMAP (Page et al., 2007), Archeops (Désert et al., 2008; Macías-Pérez et al., 2007), and published integrated flux densities, Macías-Pérez et al. (2010) also conclude that the data are not significantly better fit by the inclusion of an additional synchrotron or cold dust component to enhance emission at mm wavelengths. Our integrated 2 mm flux density measured by GISMO supports the conclusions of Macías-Pérez et al. (2010) and Green et al. (2004), and weaken the argument for a second component. However, because we find the same spectral index variations when comparing to radio images for two different epochs, we do not believe that temporal variation between the times of the radio and mm observations can be responsible for the spectral index variations.
The presence of small-scale spectral index variations at wavelengths mm implies the integrated spectrum of the Crab Nebula is probably better characterized by a more gradual change in slope rather than a sharp break from one spectral index to another (Eq. 1). However, the present far-IR to mm data are insufficient to reveal this distinction in the integrated emission. The spectral index variations of the synchrotron emission also impact study of the dust emission, which is strongest between 10 and 100 m. Accurate spatial and spectral information for the dust requires subtraction of the synchrotron component. The synchrotron emission cannot be simply extrapolated from longer or shorter wavelengths using the global spectral index. If local variations are not included, residual synchrotron emission will mistakenly be attributed to dust, which will adversely impact assessments of the dust temperature, mass, composition, and spatial distribution.
6. Conclusion
We present 2 mm observations of the Crab Nebula using the Goddard IRAM Superconducting 2 mm Observer (GISMO) at the IRAM 30 m telescope. As these are among the first GISMO observations, they provide a test of the instrument, the observing strategy, and the data reduction with respect to extended sources.
The GISMO map for the Crab Nebula gives a total integrated flux density of Jy which is in accordance with the known radio/sub millimeter spectrum of the Crab Nebula. The radio end of the spectrum is described well using a power law with which matches the well-established value of Baars et al. (1977). A simultaneous power law fit to synchrotron emission at 3 – 8 allows us to locate the break in the spectrum to be at GHz. However in detail, the break may not be sharp, and the frequency may vary at different locations within the nebula. We observe no excess of flux which would indicate the presence of a new synchrotron component as proposed in Bandiera et al. (2002).
Spectral index maps were created to compare the GISMO data with the radio regime. Two VLA maps at 1.4 GHz and 5 GHz were used. Comparisons with these maps produce similar results and both seem to show a trend of flattening of the spectral index in the inner regions of the nebula close to the pulsar. The region of flattest spectral index is well correlated with the torus in the central region of the nebula as seen at IR and X-ray wavelengths. We confirm the mm - radio spectral index variations observed by Green et al. (2004) and Bandiera et al. (2002), but as we derive the same spectral index variations when comparing to radio data from two different epochs, we conclude that temporal variations in the synchrotron emission near the pulsar cannot account for the observed changes in spectral index.
References
- Allen et al. (2006) Allen, C. A., Benford, D. J., Chervenak, J. A., Chuss, D. T., Miller, T. M., Moseley, S. H., Staguhn, J. G., & Wollack, E. J. 2006, Nuclear Instruments and Methods in Physics Research A, 559, 522
- Aller & Reynolds (1985) Aller, H. D., & Reynolds, S. P. 1985, ApJ, 293, L73
- Baars et al. (1977) Baars, J. W. M., Genzel, R., Pauliny-Toth, I. I. K., & Witzel, A. 1977, A&A, 61, 99
- Baars et al. (1987) Baars, J. W. M., Hooghoudt, B. G., Mezger, P. G., & de Jonge, M. J. 1987, A&A, 175, 319
- Bandiera et al. (2002) Bandiera, R., Neri, R., & Cesaroni, R. 2002, A&A, 386, 1044
- Bietenholz et al. (2001) Bietenholz, M. F., Frail, D. A., & Hester, J. J. 2001, ApJ, 560, 254
- Bietenholz et al. (2004) Bietenholz, M. F., Hester, J. J., Frail, D. A., & Bartel, N. 2004, ApJ, 615, 794
- Bietenholz et al. (1997) Bietenholz, M. F., Kassim, N., Frail, D. A., Perley, R. A., Erickson, W. C., & Hajian, A. R. 1997, ApJ, 490, 291
- Bietenholz & Kronberg (1990) Bietenholz, M. F., & Kronberg, P. P. 1990, ApJ, 357, L13
- Bietenholz et al. (1991) Bietenholz, M. F., Kronberg, P. P., Hogg, D. E., & Wilson, A. S. 1991, ApJ, 373, L59
- Bolton & Stanley (1949) Bolton, J. G., & Stanley, G. J. 1949, Australian Journal of Scientific Research A Physical Sciences, 2, 139
- Bowyer et al. (1964) Bowyer, S., Byram, E. T., Chubb, T. A., & Friedman, H. 1964, Nature, 201, 1307
- Davidson & Fesen (1985) Davidson, K., & Fesen, R. A. 1985, ARA&A, 23, 119
- Désert et al. (2008) Désert, F.-X., et al. 2008, A&A, 481, 411
- Dicker et al. (2008) Dicker, S. R., et al. 2008, Proc. SPIE, 7020, 702005
- Douvion et al. (2001) Douvion, T., Lagage, P. O., Cesarsky, C. J., & Dwek, E. 2001, A&A, 373, 281
- Fazio et al. (1972) Fazio, G. G., Helmken, H. F., O’Mongain, E., & Weekes, T. C. 1972, ApJ, 175, L117
- Fleishman & Bietenholz (2007) Fleishman, G. D., & Bietenholz, M. F. 2007, MNRAS, 376, 625
- Fowler et al. (2010) Fowler, J. W., et al. 2010, ApJ, 722, 1148
- Gaensler & Slane (2006) Gaensler, B. M., & Slane, P. O. 2006, ARA&A, 44, 17
- Grasdalen (1979) Grasdalen, G. L. 1979, PASP, 91, 436
- Green et al. (2004) Green, D. A., Tuffs, R. J., & Popescu, C. C. 2004, MNRAS, 355, 1315
- Greiveldinger & Aschenbach (1999) Greiveldinger, C., & Aschenbach, B. 1999, ApJ, 510, 305
- Hester (2008) Hester, J. J. 2008, ARA&A, 46, 127
- Hester et al. (1995) Hester, J. J., et al. 1995, ApJ, 448, 240
- Kovács (2008) Kovács, A. 2008, Proc. SPIE, 7020, 70201S
- Macías-Pérez et al. (2010) Macías-Pérez, J. F., Mayet, F., Aumont, J., & Désert, F.-X. 2010, ApJ, 711, 417
- Macías-Pérez et al. (2007) Macías-Pérez, J. F., et al. 2007, A&A, 467, 1313
- Marsden et al. (1984) Marsden, P. L., Gillett, F. C., Jennings, R. E., Emerson, J. P., de Jong, T., & Olnon, F. M. 1984, ApJ, 278, L29
- Mezger et al. (1986) Mezger, P. G., Tuffs, R. J., Chini, R., Kreysa, E., & Gemuend, H.-P. 1986, A&A, 167, 145
- Page et al. (2007) Page, L., et al. 2007, ApJS, 170, 335
- Staguhn et al. (2008) Staguhn, J., et al. 2008, Journal of Low Temperature Physics, 151, 709
- Staguhn et al. (2006) Staguhn, J. G., et al. 2006, Proc. SPIE, 6275, 62751D
- Strom & Greidanus (1992) Strom, R. G., & Greidanus, H. 1992, Nature, 358, 654
- Temim et al. (2006) Temim, T., et al. 2006, AJ, 132, 1610
- Trimble (1973) Trimble, V. 1973, PASP, 85, 579
- Veron-Cetty & Woltjer (1993) Veron-Cetty, M. P., & Woltjer, L. 1993, A&A, 270, 370
- Vinyaikin (2007) Vinyaikin, E. N. 2007, Astronomy Reports, 51, 570
- Waller et al. (1995) Waller, W. H., et al. 1995, AJ, 110, 1255
- Weiland et al. (2011) Weiland, J. L., et al. 2011, ApJS, 192, 19
- Woltjer (1987) Woltjer, L. 1987, NATO ASIC Proc. 195: High Energy Phenomena Around Collapsed Stars, 209
- Wright (2007) Wright, E. L. 2007, arXiv:astro-ph/0703640
- Wright et al. (1979) Wright, E. L., Harper, D. A., Hildebrand, R. H., Keene, J., & Whitcomb, S. E. 1979, Nature, 279, 703