Precision half-life measurement of the 4-fold forbidden electron capture of 50V
Abstract
A sensitive search of the 4-fold forbidden non-unique beta decay of 50V has been performed. A total exposure of 185.8 kg d has been accumulated. A reliable half-life value with the highest precision so far of years of the electron capture decay of 50V into the first excited state of 50Ti could be obtained. A photon emission line following the 4-fold forbidden beta decay into the first excited state of 50Cr could not be observed, resulting in a lower limit on the half-life of the beta decay branch of years. This is barely in agreement with a claimed observation of this decay branch.
P ACS: 13.15,13.20Eb,14.60.Pq,14.60.St
I Introduction
In the history of particle and nuclear physics the study of weak interactions and especially of beta decay has played a vital role. Those studies helped, among others, to establish the V-A structure of weak
interactions. Nowadays, this interest in exploring beta decays and related issues
is rather reduced but still there are interesting topics
to investigate like the endpoint measurements of tritium and 187Re electron spectra to determine
the neutrino mass ott08 or to search for S,T,V contributions to the weak interaction bec06 .
In addition to these “beyond the standard-model” searches also interesting nuclear physics questions are
still open which can be addressed by studying highly forbidden beta decays.
The majority of beta emitters is characterized
as allowed or single forbidden, however there are a few isotopes in nature
which are even at least 4-fold forbidden sin98 .
Their decays are extremely rare with half-lives well beyond
years. Compared to those decays, which are at least 5-fold forbidden transitions (like 48Ca and 96Zr), even a double beta decay is more likely to happen.
In this paper the focus is on the 4-fold forbidden -decay of 50V.
There are only three nuclei in nature which permit a feasible study of 4-fold
forbidden beta decay, namely 50V, 113Cd and 115In, all of them are non-unique ().
Half-lives of these transitions are long ( years) and would produce very low count rates in typical experiments.
Such measurements can only be performed in well shielded facilities with a low radioactive background.
Recent measurements of half-lives of 113Cd are reported in goe05 ; bel07 ; daw09 and of 115In
in pfe79 ; cat05 , the latter including also a transition into the first excited state. These activities triggered
for the first time theoretical attempts to calculate the energy spectra of such beta decays mus06 ; mus07 .
The isotope 50V is quite unique in the sense that in contrast to 113Cd and 115In
the ground state transition is even higher-forbidden, leaving only 4-fold forbidden non-unique decay modes
into the first excited states of 50Cr and 50Ti, both characterized as 6 transitions.
The ground state transitions to both isotopes are even 6-fold forbidden non-unique decays. The decay
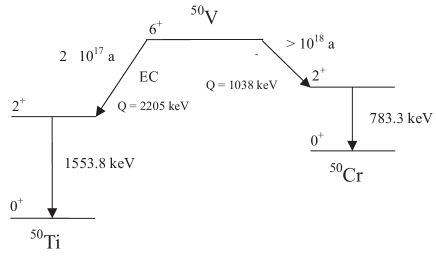
scheme is shown in Fig. 1. The Q-value for the beta decay into 50Cr is (1037.9 0.3) keV and for electron capture (EC) into 50Ti it is (2205.1 1) keV, respectively wap03 . There is only one excited state in each daughter nucleus
which can be populated. The corresponding gamma lines to search for are 1553.77 keV for EC into the first excited state of 50Ti and 783.29 keV for the beta decay into the first excited state of 50Cr, respectively. The photon emission probability of both E2 transitions is 1 (with a negligible uncertainty).
Various attempts have been made to observe the decay of 50V into 50Ti hei55 ; glo57 ; bau58 ; mcn61 ; wat62 ; son66 ; pap77 ; alb84 ; sim85 ; sim89 . However, the deduced half-life
changed by several orders of magnitude over the decades, while uncertainties claimed were typically well beyond 20 %.
For the beta decay into the excited state of 50Cr only lower
limits were published except one vague indication of an observation sim89 .
The measurements within the last 45 years are compiled in Tab. 1.
All these measurements were performed more than at least two decades ago.
| Mass | Time | Ref. | ||
|---|---|---|---|---|
| g | d | a | a | |
| 4000 | 48.88 | pap77 | ||
| 4250 | 135.5 | alb84 | ||
| 100.6 | 8.054 | sim85 | ||
| 337.5 | 46.21 | sim89 | ||
| 255.8 | 97.8 | this work |
The aim of this paper is to perform a high statistics search and provide a precision measurement of the 50V decay taking advantage of a sophisticated detector system and also of developments in low background techniques.
II Experimental procedure
The measurement was performed using an ultra-low background Ge-detector (ULB detector) at the underground laboratory for dosimetry and spectrometry of the PTB (UDO) close to Braunschweig (Germany). UDO is located inside the Asse salt mine providing shielding with respect to the secondary cosmic radiation of about 1200 m of water equivalent. The p-type extended range ULB detector has an efficiency of 89 % and an energy resolution of 2.1 keV at 1.33 MeV. The mass of the Ge single crystal is 1.9 kg. It is surrounded by a shielding of low activity made of inner 10 cm of electrolytic copper and two outer layers of lead with a 210Pb content of 2 Bq/kg and 6 Bq/kg, respectively. For a detailed description of the apparatus see neu09 .
The detector was calibrated by recording the spectra of cans filled with solutions of well known activity provided by PTB. The activity of single nuclides within these solutions is known within an uncertainty between 1 % and 2 %. The solutions covered an energy range of strong emission lines from 21.0 keV to 1836 keV, using 11 radionuclides producing 18 major emission lines. To obtain
the efficiency the sample-detector geometry was modeled by applying the Monte Carlo code GESPECOR (some geometrical parameters of the detector known from the technical drawing were altered slightly to achieve a better agreement between measurement and Monte Carlo simulation). Summing corrections were obtained by using the same code. The code served to calculate the efficiency of the detector concerning the 50V sample as well. An efficiency transfer was calculated from a 100 ml can containing a known radionuclide concentration to the same 100 ml can filled with vanadium powder (with a natural isotopic composition). This procedure led to an uncertainty of the efficiency of less than 3 % in the covered energy region. More information on this detector and its performance can be found in neu09 .
The uncertainties published in this article were calculated by adding all known uncertainty contributions quadratically to obtain the value of the total uncertainty. This procedure is in agreement with the Guide to the expression of uncertainty in measurement, GUM gum08 . The uncertainties in this article are expressed as standard uncertainties (coverage factor ).
III Experimental details
The background of the applied detector in the region of the 1553.8 keV line, integrated from 1553 keV to 1555 keV, is lower than 0.025 counts per day. The pure background in the region of the 783.3 keV line is also rather low: Integrated from 782 keV to 784 keV, it is about 0.25 counts per day. But thorium and uranium impurities of the sample lead to a much higher background in the region of the 783.3 keV line (see below), while there are no natural lines near the 1553.8 keV line.
As the measurement is completely dominated by contaminations within the sample, the intrinsic background of the
set-up can be neglected.
A sample of vanadium powder with a total mass of 255.82 g, corresponding to a volume of 100 ml, was filled in a cylindrical film can (made of plastic) and placed on top of the above mentioned detector.
The total measuring time was 97.8 days resulting in a total detector mass times measuring time product of 185.8 kg d. The measurement confirmed that the sample was not highly purified because various emission lines from the natural decay chains of uranium and thorium are visible, caused by activities in the mBq range.
Vanadium is a base metal, hence the surface will oxidize when it has contact with air. In addition, it can absorb some water. The can in which the vanadium powder was kept was not completely hermetically sealed, so that it had contact with the surrounding air. The oxygen content of the sample of () % by mass was measured by the German Federal Institute for Materials Research and Testing (BAM) with a high precision. The water content of ( % by mass was determined by PTB by drying the sample at low temperatures ( C). The mass of the oxygen and water was subtracted from the mass of the total sample before calculating the activity concentration and half-lives of vanadium.
IV Results
IV.1 The 1553.8 keV line from electron capture
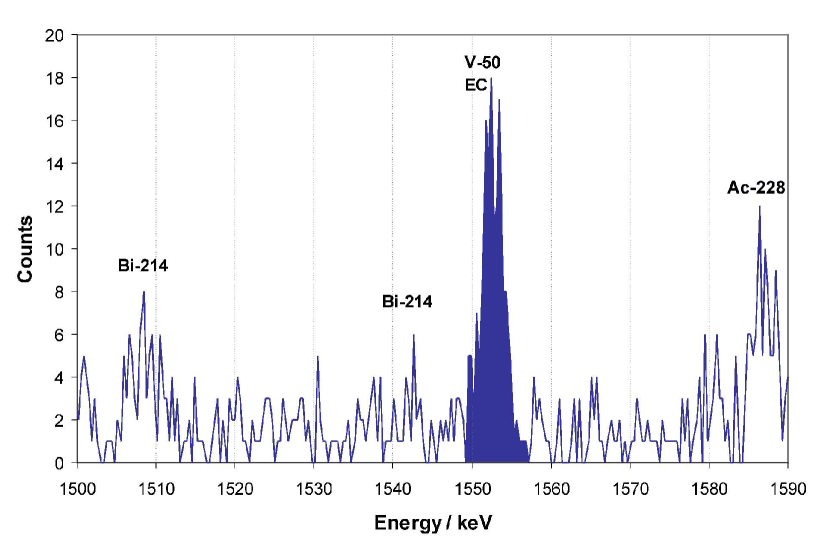
The energy range around the expected line from EC is shown in Fig. 2. The region shows two prominent lines, one at the expected energy and one at 1588 keV. The latter is emitted by 228Ac, a progeny of 232Th (nuclear data information taken from nudat ). A fit to the first line results in 123 net counts. By taking into account the detection efficiency of 2.17 % and the natural abundance of 50V of 0.25 % lae03 this can be converted into a partial half-life of years. The fact that the 1554.1 keV line from 234mPa (from the 238U series) could interfere with the line of interest has to be taken into account. This 234mPa line is in equilibrium with a gamma line at 1001.1 keV, which should include 139 times more counts because of a higher emission probability and a higher efficiency of the detector at that energy. As the line at 1001.1 keV is not visible at all in the measured spectrum, the 234mPa line contribution at 1554.1 keV is neglected.
All known sources of uncertainty bigger than 0.001%, which have an influence on the calculated life-time, are listed in Table 2. The total uncertainty of the half-life of the EC decay is clearly dominated by the uncertainty of the determination of the number of detected counts (i.e. fitting of the 1553.8 keV line and its background).
| Contribution | Uncertainty |
| in % | |
| 50V abundance in sample (total) | 2.5 |
| including: | |
| Natural 50V isotopic abundance | 1.6 |
| V concentration due to manufacturer | 0.1 |
| Water content of sample | 0.7 |
| Oxygen content of sample | 2.0 |
| Weight of sample | 0.04 |
| Activity determination | 10 |
| including: | |
| Number of detected counts | 10 |
| Detector efficiency | 3 |
| Total uncertainty of half-life | 11 |
IV.2 The 783.3 keV line from beta decay
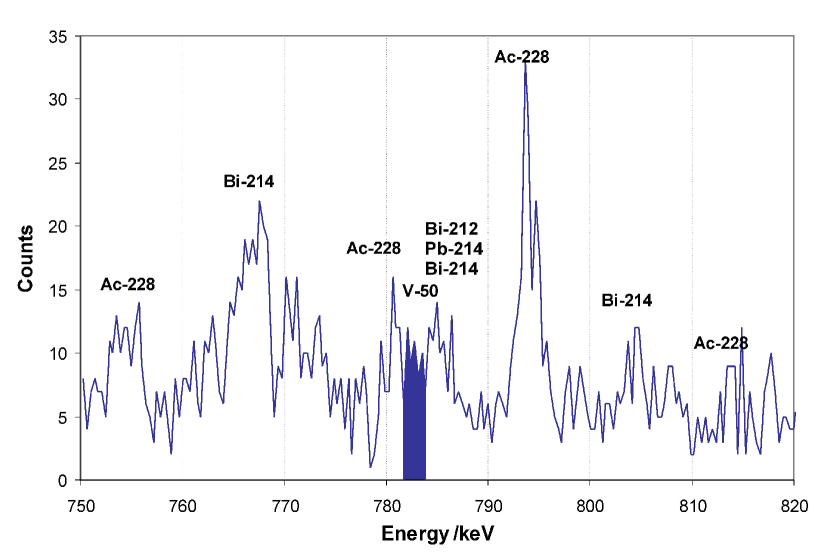
Many more lines are visible in the range of the potential -line from the beta decay into the first
excited state of 50Cr (Fig. 3). At around 783 keV there are six known lines from the U and Th
chains: 782.1 keV (228Ac), 783.4 keV (234mPa), 785.4 keV (212Bi), 786.0 keV (214Pb), 786.1 keV (214Bi) and 786.3 keV (234mPa) nudat . The contributions of the 234mPa lines can be neglected for similar reasons that were explained in the section before. But in direct proximity to the energy of interest, 783.3 keV, the contributions of the remaining lines form peak-like structures. A line at 783.3 keV is not visible. On the contrary, a dip is found at that energy. An upper detection limit of 27 events (using a significance level of ) for a potential line can be calculated according to the ISO 11929 standarddin11 , a well defined standard procedure for sample measurements. With a detection efficiency of 3.35 % this converts into a lower limit on the partial half-life of the beta decay years. This is larger than the claimed observation in sim89 . If the partial half-life published in sim89 had been correct, a total of 39 events should have been observed in our measurement, which is excluded by two standard deviations, if the large upper error of 160 % stated in sim89 is not taken into account.
The lower limit of the half-life of the beta decay published in this article shows that the value of years entering current nuclear tables (like nudat ) is too small, as the new value of the lower limit is nearly twice as high.
The uncertainty budget of our evaluation of the 783.3 keV line is very similar to that of our evaluation of the 1553.8 keV line, but here an uncertainty resulting from the determination of the number of detected counts is not applicable. As the evaluation of the region of the 783.3 keV line only results in a lower limit, this value is not combined with an uncertainty.
V Summary and Conclusions
More than two decades since the last attempt, the 4-fold forbidden decays of 50V were investigated ahain with an ultra-low background Ge-detector system located deep underground. For the first time ever oxygen and water content of the vanadium sample were determined to get a more accurate value for the real vanadium mass. The electron capture decay branch, which populates the first excited state of 50Ti, is clearly visible with a half-life of
| (1) |
This is roughly a factor of two more precise compared to the best claimsim89 . The beta decay branch, which leads to the first excited state of 50Cr, could not be observed and a lower half-life limit of
| (2) |
is concluded (with a significance level of 5 %). This is barely in agreement with the only positive claim made of this decay in the past. From both results of this article a combined total half-life of 50V with a lower limit of years can be derived. That means that 7.1 % of the decays happen by beta decay at maximum. As a consequence, the branching ratio of the two decay modes of 50V is not correctly implemented in nudat .
The current search was limited by an intrinsic contamination of the vanadium sample and of the detector. The actual background spectrum of the detector itself is about a factor of 4 lower concerning the 238U decay chains and a factor of 2 better concerning the 232Th decay chain. Thus, after purifying the vanadium, a follow-up measurement allows a more sensitive search for the beta decay mode of 50V.
VI Acknowledgements
The authors would like to express their gratitude to the following members of the PTB radioactivity department for their support of this work: Dirk Arnold, Marion Ehlers, Karsten Kossert, Michael Schmiedel and Herbert Wershofen. In addition, the authors are very grateful for the support of Heinrich Kipphardt and Nicole Langhammer, both members of BAM.
References
- (1) E. W. Otten, C. Weinheimer, Rep. Prog. Phys. 71, 086201 (2008)
- (2) N. Severijns, M. Beck, O. Naviliat-Cuncic, Rev. Mod. Phys. 78, 991 (2006)
- (3) B. Singh et al., Nucl. Data Sheets 84, 487 (1998)
- (4) C. Gössling et al., Phys. Rev. C 72, 064328 (2005)
- (5) P. Belli et al., Phys. Rev. C 76, 064603 (2007)
- (6) J. Dawson et al., Nucl. Phys. A 818, 264 (2009)
- (7) L Pfeiffer et al., Phys. Rev. C 19, 1035 (1979)
- (8) C. M. Cattadori et al., Nucl. Phys. A 748, 333 (2005)
- (9) M. T. Mustonen, M. Aunola, J. Suhonen, Phys. Rev. C 73, 054301 (2006), err. Phys. Rev. C 76, 019901 (2007)
- (10) M. T. Mustonen, J. Suhonen, Phys. Lett. B 657, 38 (2007)
- (11) G. Audi, A. H. Wapstra, C. Thibault, Nucl. Phys. A 729, 337 (2003)
- (12) J. Heintze, Z. Naturforschung A 10, 77 (1955)
- (13) R. N. Glover, D. E. Watt, Philos. Mag. 2, 697 (1957)
- (14) E. R. Bauminger, S. G. Cohen, Phys. Rev. 110, 953 (1958)
- (15) A. McNair, Philos. Mag. 6, 559 (1961)
- (16) D. E. Watt, R. L. G. Keith, Nucl. Phys. 29, 648 (1962)
- (17) C. Sonntag, K. O. Münnich, Z. Phys. 197, 300 (1966)
- (18) A. Pape, S. M. Refaei, J. C. Sens, Phys. Rev. C 15, 1937 (1977)
- (19) D. E. Alburger, E. K. Warburton, J. B. Cumming, Phys. Rev. C 29, 2294 (1984)
- (20) J. J. Simpson, P. Jagam, A. A. Pilt, Phys. Rev. C 31, 575 (1985)
- (21) J. J. Simpson, P. Moorehouse, P. Jagam, Phys. Rev. C 39, 2367 (1989)
- (22) S. Neumaier et al., Appl. Rad. Isot. 67, 726 (2009)
- (23) BIPM: Evaluation of measurement data - Guide to the expression of uncertainty in measurement, JCGM 100:2008, www.bipm.org (2008)
- (24) J. R. de Laeter et al., Pure Appl. Chem. 75, 683 (2003)
- (25) C. L. Dunford and R. R. Kinsey, NuDat system for access to nuclear data. IAEA-NDS-205 (BNL-NCS-65687), July 1998, information extracted from the NuDat data base, version of 17 March 2004, using the PC version of the program NuDat (Vienna, Austria: IAEA) (2004)
- (26) Deutsches Institut für Normung E.V. (German National Institute for Standards). Determination of the characteristic limits (decision threshold, detection limit and limits of the confidence interval) for measurements of ionizing radiation - Fundamentals and application (DIN ISO 11929:2011-01) (Berlin: DIN) (1993)