.
Electronic Raman Scattering in copper oxide Superconductors: Understanding the Phase Diagram
Abstract
Electronic Raman scattering measurements have been performed on hole doped copper oxide (cuprate) superconductors as a function of temperature and doping level. In the superconducting state coherent Bogoliubov quasiparticles develop preferentially over the nodal region in the underdoped regime. We can then define the fraction of coherent Fermi surface, around the nodes for which quasiparticles are well defined and superconductivity sets in. We find that is doping dependent and leads to the emergence of two energy scales. We then establish in a one single gap scenario, that the critical temperature where is the maximum amplitude of the d-wave superconducting gap. In the normal state, the loss of antinodal quasiparticles spectral weight detected in the superconducting state persists and the spectral weight is only restored above the pseudogap temperature . Such a dichotomy in the quasiparticles dynamics of underdoped cuprates is responsible for the emergence of the two energy scales in the superconducting state and the appearance of the pseudogap in the normal state. We propose a 3D phase diagram where both the temperature and the energy phase diagrams have been plotted together. This 3D diagram advocates in favor of a low temperature phase transition inside the superconducting dome. We anticipate that the development of coherent excitations on a restricted part of the Fermi surface only is a general feature in high cuprate superconductors as the Mott insulating is approaching.
————————————————————————————————————————–
Des mesures de diffusion Raman électronique ont été menées sur les oxydes de cuivre supraconducteurs dopés en trous en fonction de la température et du dopage. Dans l’état supraconducteur du régime sous dopé le poids spectral des quasiparticules de Bogoliubov reste important dans les regions nodales alors qu’il est réduit dans les regions antinodales. On peut alors définir la fraction cohérente de la surface de Fermi, , autour des noeuds, sur laquelle la supraconductivité se développe. Nous avons découvert que dépend du dopage et est à l’origine de l’apparition de deux échelles d’énergie dans le régime sous dopé de l’état supraconducteur. Nous avons alors établi dans un scenario à un seul gap que la température critique où est l’amplitude maximale d’un gap de symétrie d. Dans l’état normal, la perte de poids spectral (observée dans l’état supraconducteur) presiste et ne disparait qu’au dessus de la température de pseudogap . Nous pensons que cette forte dichotomie dans la dynamique des quasiparticules est responsable à la fois de l’apparition des deux échelles d’énergie dans l’état supraconducteur et du pseudogap dans l’état normal des cuprates sous dopés. Nous proposons un diagramme de phase 3D où sont représentés simultanéement les diagrammes de phase en température et en énergie. Ce diagramme 3D privilégie un scenario où un changement d’état devrait exister à basse température à l’interieur du dome supraconducteur. Nous pensons que le développement des excitations cohérentes sur des portions restreintes de la surface de Fermi est un trait caractéristique des cuprates à haute température à l’approche d’un isolant de Mott.
INTRODUCTION
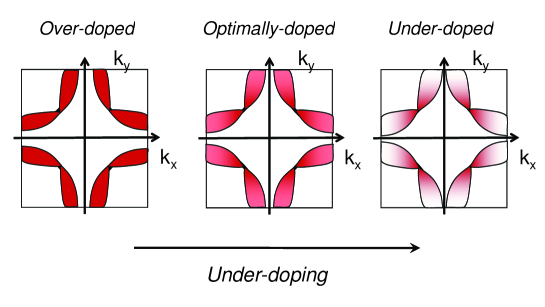
One of the most challenging issues in copper oxide superconductors is to understand how superconductivity emerges from a Mott insulating state as a hole concentration (doping level, p) is increased Anderson . Cuprates consist of an alternated stacking of planes and reservoir planes . The low energy electronic structure of these planes is characterized by a single energy band Pickett . At low doping level, this energy band is half filled. Band theory would predict this to be a metal but the actual material is an insulator. The origin of this insulating behavior is the Coulomb repulsion which prevent the hopping of an electron from one Cu site to the next. The electrons are then localized. The spins of these Cu ions form an antiferromagnetic order (known as a Néel lattice). As the doping level increases, electrons are transfered from planes to the “reservoir” planes. Holes then appear in the planes allowing the electron hopping from one Cu site to an other, and so rapidly destroy the Néel lattice. En artificial metal is then built and remarkably, around , a superconducting state emerges (see fig. 1-a).
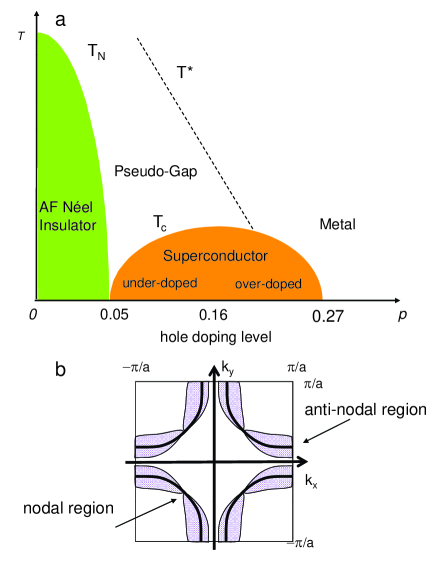
The evolution of the superconducting transition temperature, , as a function of the hole doping level, is remarkably universal. has a dome-like shape and exhibits two distinct regimes : (i) the underdoped regime where the critical temperature increases with doping until the optimal doping, and (ii) the overdoped regime where decreases with doping and vanishes for . It is now established that the superconducting gap has a dominant d-wave symmetry across the entire phase diagram although a smaller s-wave component cannot be ruled out Tsuei ; Khasanov . The superconducting gap reaches its maximum values along the principal axes of the Brillouin zone (BZ) and vanishes along the diagonal of the BZ. This corresponds respectively to the antinodal and nodal directions (see fig. 1b).
In the underdoped regime, above and below the temperature a pseudogap state develops. It corresponds to a partial suppression of spin and charge excitations Alloul ; Timusk and it is also associated to broken symmetries Fauque ; Xia ; Lawler ; He .
On one hand, a growing number of transport measurements such as electrical and thermal conductivities, entropy, heat capacity and Hall coefficient, see for a review Tallon ; Taillefer ; Alloul2 advocate in favor of a temperature phase diagram where do not merge with in the overdoped side but rather cuts through (or end at) the dome (see fig. 2a).
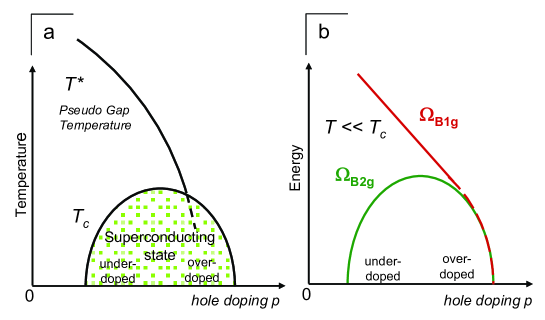
On the other hand, spectroscopic investigations such as Andreev-Saint-James reflection Deutscher , electronic Raman sacttering (ERS) LeTacon ; Guyard01 ; Gallais ; Opel angle resolved photoemission spectroscopy (ARPES)Mesot ; Tanaka ; Lee , infrared reflectivty (IR)Bernhard , and scanning tunneling microscopy (STM) Boyer ; Kohsaka ; Yazdani lead to an energy phase diagram at low temperature (well below ) where a single energy scale is detected in the overdoped regime while two distinct energy scales appear in the underdoped side of the superconducting state (see fig. 2b). The low energy scale decreases while the high energy one increases with underdoping. How can we understand these two distinct phase diagrams in a global picture of high cuprate superconductors? Are we able to depict a 3D cuprate phase diagram which involves both energy and temperature as a function of hole doping level?
These questions are a real challenge that we propose to address here. More precisely, we will try to reveal physics which control and by performing and discussing Raman experiments on several high cuprate superconductors through a large range of doping levels and temperatures. This leads us to point out the emergence of two distinct quasiparticle dynamics and two distinct energy scales in the superconducting state of underdoped cuprates.
We show that Coherent Bogoliubov quasiparticles develop preferentially over a restricted region of the momentum-space in underdoped regime: around the nodal direction. The density of Cooper pairs appears to be strongly anisotropic in momentum space with underdoping. Most of the supercurrent is then carried out by electronic states around the nodal region in the momentum space. This contrasts to conventional superconductors where superconductivity develops uniformly along the normal-state Fermi surface.
We can then define the fraction of coherent Fermi surface, around the nodes for which quasiparticles are well defined and superconductivity sets in. We find that is doping dependent and we establish that where is the maximum amplitude of the d-wave superconducting gap. This new relation differs from the standard BCS theory and give us some clues for increasing in the cuprates.
Just above , in the underdoped regime, the fraction of coherent Fermi surface is still observable. This manifests experimentally by a sizeable quasiparticle spectral weight in the nodal region while it is strongly reduced in the antinodal region. This is the signature of the pseudogap state. The quasiparticle spectral weight in the antinodal region is only recovered above .
The loss of coherent quasiparticles in the antinodal region is then acting as a foe of superconductivity since it prevents from the formation of coherent Cooper pairs around the antinodes in underdoped cuprates. Loss of coherent quasiparticles on restricted parts of the Fermi surface is then responsible for both the existence of the two energy scales in the superconducting state and the appearance of the pseudogap in the normal state.
These results have bearing on the fundamental problem of how superconductivity emerges as holes are doped into a Mott insulating state. We anticipate that the development of coherent excitations on a restricted part of the Fermi surface only is a general feature in high cuprate superconductors.
ELECTRONIC RAMAN SCATTERING
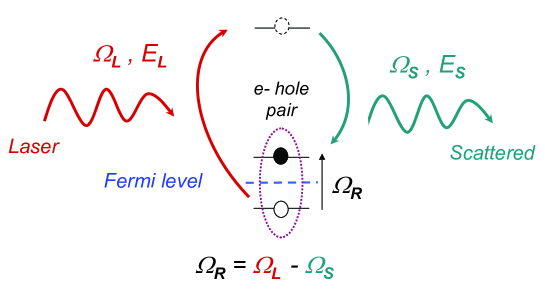
Raman scattering is usually known for its ability to probe the vibrational modes of the crystal lattice. However Raman scattering is also an efficient tool to investigate electronic excitations in the spin and charge channels such as collective modes (magnon, plasmon) or single particles excitations (quasiparticles). Indeed, electronic Raman scattering (ERS), like angle resolved photoemission spectroscopy (ARPES), is both an energy and a momentum probe of quasiparticles. ERS allows us to reach an energy accuracy of less than one tenth meV on a selected part of the BZ. ERS is an inelastic light scattering process where an incident photon is absorbed by the crystal and a scattered one is emitted, with the simultaneous creation (Stokes) or annihilation (anti-Stokes) of an electronic excitation. ERS is particulary suitable for cuprates where the light penetration depth is typically of the order of corresponding roughly to one hundred cells iradiated. Here we will deal only with Stokes process illustrated in fig. 3.
Since two photons are coming into play, Raman scattering is a second order process in the electromagnetic field. This second order effective interaction with electronic excitations comes from both a direct second order term in the interaction Hamiltonian, and from a first order term treated up to second order in perturbation. As introduced by Abrikosov and Genkin Abrikosov , one may consider that both terms can be gathered in a single effective second order term in the Hamiltonian which can be written as:
| (1) |
where is the electronic charge and its bare mass. and are the vector potentials of the incoming laser and scattered light, and the bracket is for the proper matrix element over the photons states. The difference between the incident and the scattered photon frequencies is noted , and the difference between the photon momenta is . The operator is given by :
| (2) |
It is quite similar to the standard density operator, where is the initial electronic momentum and are the final and inital electronic bands. The only difference is the term for the scattering process, known as the Raman vertex which is given explicitely by :
| (3) | |||||
and are respectively the electric field polarizations of the incident and scattered light and the electronic states.
The Raman vertex depends on the electronic band structure of the material studied and it is far to be easy to calculate it explicitly. Stricly speaking, the Raman vertex depends on and . However, in the visible range which is the applied field of ERS, the photon momentum transfered is negligeable with respect to the BZ. Pratically, we consider in the Raman scattering process. Moreover for low frequency range (typically less than 1/8 eV ) in comparison with the electronic transitions (2 eV), we consider that the Raman vertex does not depend on Sacuto . The Raman vertex is dependent however and its contraction in eq. 3, by the incident and scattered electric fields allows us to select different part of the BZ. Indeed, cuprates have a pure or slightly distored tetragonal structure. As a consequence, the Raman vertex (related to plane) can be decomposed on the basis of the 2D irreductible representations of the space group .
| (4) |
In a such a case, the contraction of the Raman vertex tensor () by the incident and scattered electric field polarizations fix one of its component, each component having a well defined symmetry which corresponds to a specific momentum space dependence.
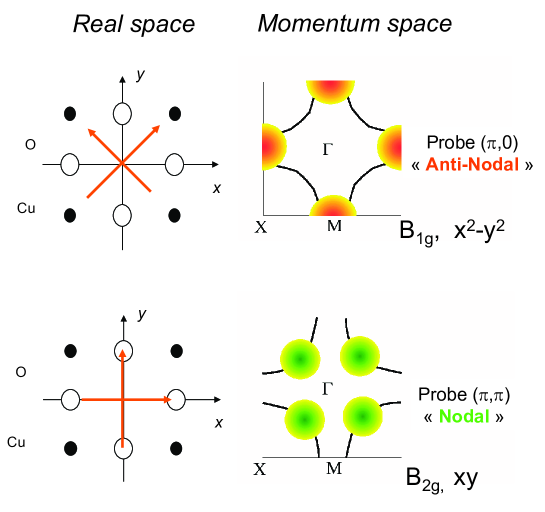
As for an example, see fig. 4, diagonal cross polarizations and
active the tensor component while the and tensor components are not active. The tensor (with respect to the Neuman’s theorem) Burns transforms as (). It vanishes along the diagonal of the BZ and therefore probes mainly the principal axes of the BZ (the antinodes). On the opposite, cross polarizations and will select the tensor component which transforms as () and probes mainly the diagonal of the BZ (the nodes).
In summary, by a judicious choice of the incident and scattering electric fields we are able to probe different parts of the BZ. The contraction of the Raman vertex acts as a filter which hides some specific regions of the BZ. In cuprates, we can probe the nodal region (N) and the antinodal regions (AN).
Raman experiments give a direct access to the Fourier transform of the density-density correlation function called the “dynamical structure factor” Klein :
| (5) |
where is the thermal average.
According to the fluctuation dissipation theorem Callen , is related to the imaginary part of the response function as follows:
| (6) |
where is the Bose-Einstein factor.
is related to the electronic density fluctuations induced by the electric field of the incident light into the crystal.
The Raman response function (or the dynamical structure factor) can be explicitly calculated in some specific cases such as the normal state of a Fermi liquid with or wihout impurity or the superconducting state in BCS theory. We can consider several ways to calculate the dynamical structure factor, one of them consists to use the Matsubara formalism which leads to an analytical expression of the Raman response function at finite temperature. This formalism will be used in the next sessions. We invite the reader to refer to the references Rychkasen ; Mahan ; Devereaux1 for more details.
K-SPACE ISLANDS OF COHERENT COOPER PAIRS IN THE SUPERCONDUCTING STATE OF UNDERDOPED CUPRATES
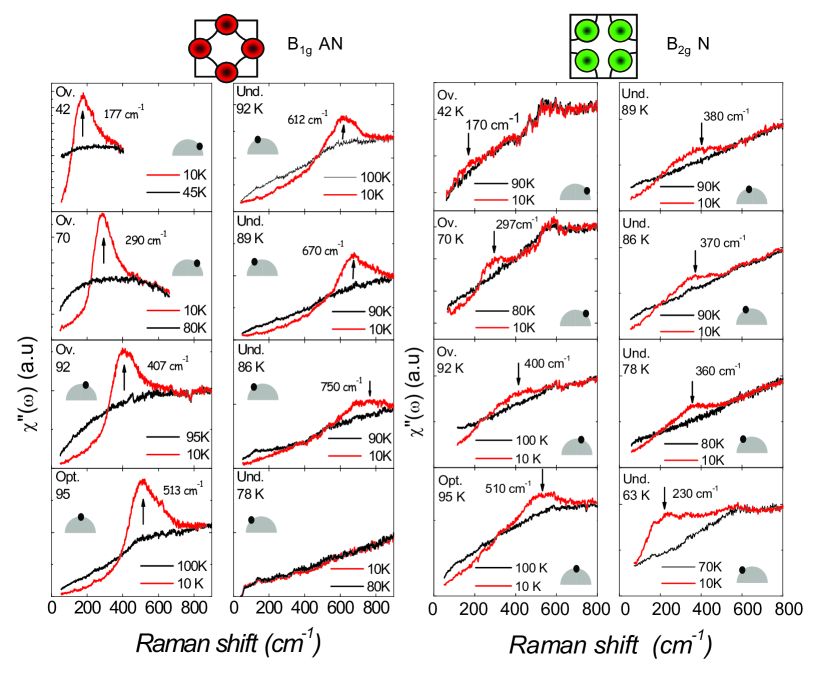
We have first performed Raman measurements on a single layer compound: (). Raman spectra in both (AN) and (N) geometries (for several doping levels) are displayed in fig. 5.
.
At a first glance, we observe in the superconducting state of overdoped samples a strong peak in the geometry and a weaker one in the geometry (first and third pannels from the left). Remarquably these and peak energies exhibit two distinct doping dependence in the underdoped regime (second and forth pannels from the left). The peak increases in energy while the one decreases in energy with underdoping.
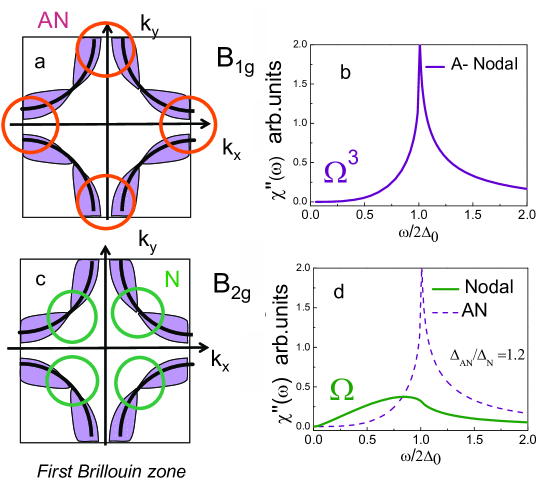
At the optimal doping level, ( = 95 K, bottom of the first and third pannels from the left), the low energy spectrum (below ) exhibits a nearly cubic frequency dependence. On the opposite, the low energy spectrum displays a linear frequency dependence. These two distinct power laws (cubic and linear) are the Raman signature of a d-wave superconducting gap and can be qualitatively understood as follows (see for more details Devereaux2 ). In the geometry (around the antinodes, see fig. 6-a), the superconducting gap has its maximum amplitude which prevents low energy electronic excitations. We then expect the electronic continuum to be weak below , (see fig. 6-b).
On the opposite, in geometry (close to the nodes, see fig. 6-c), the amplitude of the superconducting gap vanishes. This allows substantial low energy electronic excitations. Since the number of available electronic states increases with energy, we expect the Raman spectrum to exhibit a linear frequency dependence at low energy (see fig. 6-d).
.
Area of the nodal and antinodal superconducting peaks and evolution of the density of Cooper pairs with underdoping
Beyond the analysis of the low energy electronic continuum in and geometries, fig. 5 reveals that the antinodal peak measured at exhibits a strong decrease in intensity with underdoping before disapearing (close to , ) while the nodal peak persists down to the lowest doping level (, ).
In order to make reliable comparison between the Raman intensities of the and superconducting peaks, we have performed quantitative Raman measurements which allow a direct comparison of the intensities for different doping levels (see Methods).
Obtaining intrinsic Raman measurements on cuprates with various doping levels is a true challenge for experimentalists. It requires not only an extremely high level of control of the crystal surface quality, the optical set up but also the knowledge of the optical constants for each crystal studied. In order to overcome these difficulties, we have chosen to work on () system rather than on the one LeTacon ; Guyard01 ; Gallais . One of the reason is that crystals can be easily cleaved providing large homogeneous surfaces ()
We have performed all the measurements during the same run and the crystals with various doping levels have been mounted on the same sample holder in order to keep the same optical configuration. With a laser spot of about in diameter, we have measured Raman intensity variations of less than from one point to another on the same cleaved surface. Crucially, we have also observed only weak intensity changes for two distinct crystals of the same nominal doping level mounted side by side on the sample holder of the cryostat. These observations give us confidence that the doping dependence of the Raman intensity variations reported here are intrinsic. Finally, the Raman cross-section at each doping level was obtained by correcting the Raman response function for the optical constants Blanc .
.
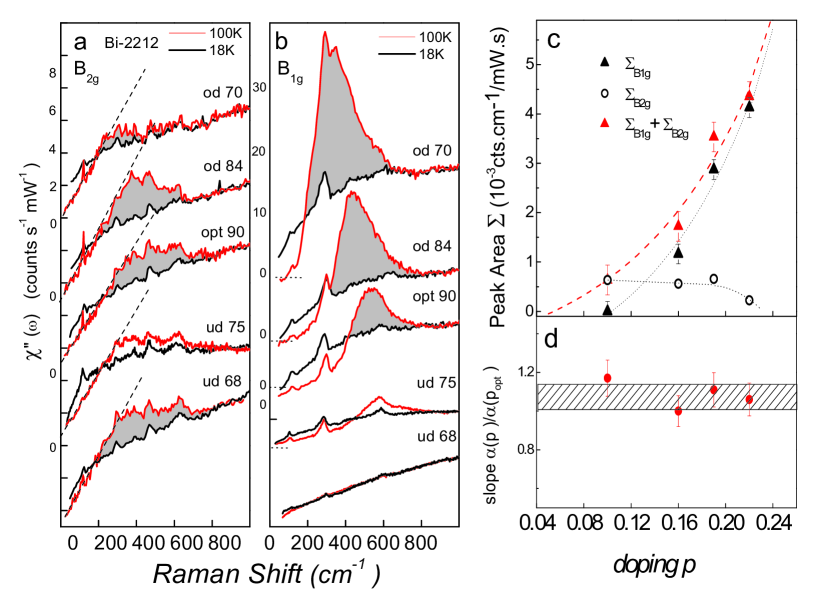
Figures 7-a and b display the intrinsic and superconducting responses of for several doping levels in the superconducting and normal states.
We focus first on the and peak areas deduced from the subtraction between the superconducting and the normal Raman responses (in gray in fig. 7a and b).
Our data reveal a strong decrease of the area under the peak with underdoping. It disappears close to while the superconducting peak area slightly increases from to and then remains almost constant as the doping level is reduced down to . The doping evolution of the and peak area () are reported on fig. 7-c.
Are these two peaks truly associated to coherent excitations of the superconducting state or can subsist above ? In order to precisely answer to this question, we have performed Raman measurements as a function of both doping level and temperature. In figure 8-a and b are displayed the Raman responses of () single crystals with different doping levels, in (antinodal) and (nodal) geometries, for several temperatures ranging from well below to K above .
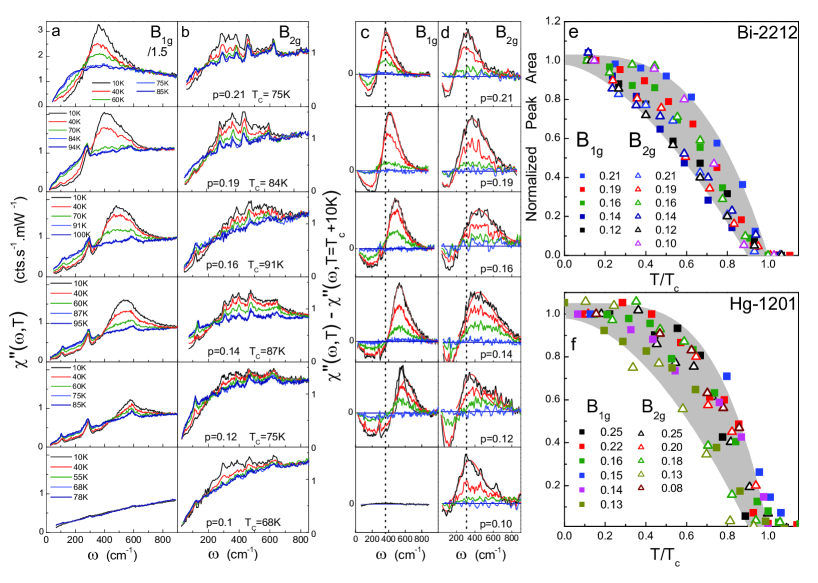
In both geometries, these spectra show the gradual decreasing of a peak (or rather a broad shoulder in the geometry) as the sample is heated up to .
In order to clearly reveal the temperature-dependence of the and peak areas, we have plotted in fig. 8-c-d, the difference between these spectra and the spectrum measured at K above on the same sample. From these subtracted spectra, we obtain the normalized areas of the and peaks, which are displayed in fig. 8-e as a function of . Figure 8-f shows the and areas for the crystals.
These plots demonstrate that the peak intensities vanish continuously at , providing quantitative support to our interpretation as coherence peaks of the superconducting state.
What is the meaning of the superconducting peak area? For a non interacting Fermi liquid, in the framework of BCS theory, the Raman response in the limit and use of Matsubara formalism Devereaux1 ; Klein2 leads to :
| (7) |
where refers to the and geometries, is the Raman vertex, , the superconducting gap and the Boltzman constant. is the Bogoliubov quasiparticle energy defined such as: and . is the electronic state energy and the chemical potential.
It is then straightforward to show that the integral of the Raman response over when tends to zero, gives:
| (8) |
The sum is equal to where and are the probabilities of the pair being occupied and unoccupied respectively. This sum is non-vanishing only around the Fermi energy in the range of deGennes . This quantity corresponds to the density of Cooper pairs, formed around the Fermi level as the gap is opening Leggett . A priori, the density of coherent Cooper pairs is distinct from the superfluid density which is just the total carrier density at . The integral of the Raman response is then proportional to the density of Cooper pairs, weighted by the square of the Raman vertex which selects specific area of the Brillouin zone: the nodal or the antinodal regions.
Applying this analysis to our data reveals that the superconducting peak area (in gray in fig. 7-a and b) provides a direct estimate of the density of Cooper pairs in the nodal and antinodal regions Note .
The data reported in fig. 7-c show that the density of Cooper pairs is strongly anisotropic in the space as a function of doping level.
At low doping level, the density of Cooper pairs becomes very weak at the antinodes and vanishes below , while it is still sizeable around the nodes. Therefore we are led to conclude that Cooper pairs are k-space confined. At low doping level Cooper pairs form k-space islands around the nodes. This is consistent with the picture where most of the supercurrent is carried out by electrons’ small patches centered on the nodal points on the underdoped regime as proposed by Ioffe and Millis Ioffe_98 . This picture is consistent with the loss of antinodal quasiparticles coherence reported in tunneling Kohsaka ; McElroy and ARPES Feng ; Ding ; Vishik . The doping evolution of the density of Cooper pairs is sketched in fig. 9-a-c.
.
TWO ENERGY SCALES IN THE SUPERCONDUCTING STATE OF UNDERDOPED CUPRATES
Nodal and Anti-Nodal energy scales in the underdoped side of the superconducting dome
As pointed out in previous section (see fig.5), the and peak energies exibit distinct doping dependences in both and systems. This can also be seen in fig. 8-c and d. The peak energy increases while the one decreases with underdoping. This gives rise to two energy scales in the superconducting state of underdoped cuprates as reported in fig. 10-a. The and energy scales coincide at high doping levels (), but depart from each other as doping level is reduced. The energy scale increases monotonically as doping is reduced, while the energy scale follows a dome-like shape approximately similar to that of the critical temperature .
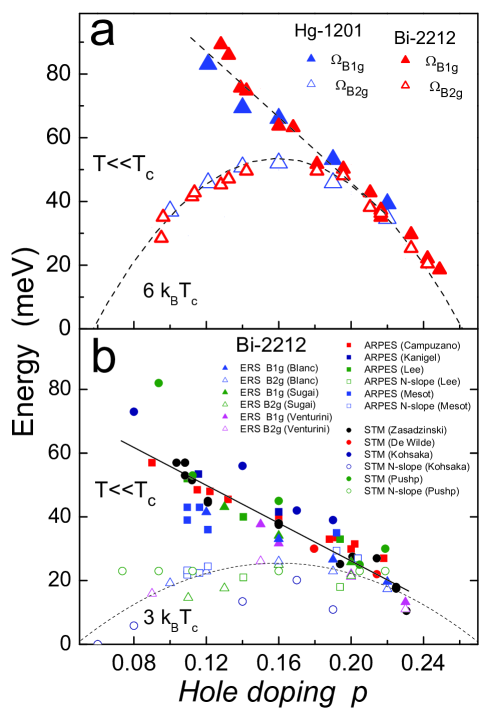
In fig. 10-b, are reported on the same plot the ERS LeTacon ; Venturini ; Sugai , tunneling Kohsaka ; Yazdani ; DeWilde ; Zasadzinski and ARPES Mesot ; Lee ; Campuzano ; Kanigel measurements performed on system well below . We clearly observe two energy scales as a function of doping level. The high energy scale (in filled symbols) corresponds to quasiparticles related to the antinodal region while the lower energy scale (in open symbols) corresponds to quasiparticle related to the nodal region.
Toward an understanding of the two energy scales in the underdoped side of the superconducting dome
The origin and significance of these two scales are largely unexplained, although they have often been viewed as evidence for two distinct gaps in the superconducting state of under-doped cuprates. A popular view has been to associate one of the gap to the superconducting state while the other one is unrelated to superconductivity but associated with pseudogap Tallon ; Millis ; Hufner . In principle angular resolved photoemission spectroscopy (ARPES) should be able to distinguish between these two gaps but contradictory results have been reported up to now Terashima ; Shi ; Kondo ; Chatterjee .
We have shown that the two energy scales disappear at and are associated with coherent excitations of the superconducting state (see fig.8). This leads us to another view. Using a simple model, we show that these two energy scales do not require the existence of two distinct gaps: a pseudo gap and a superconducting one Storey ; Belen ; Leblanc ; Tallon2 . Rather, a single d-wave superconducting gap with a loss of Bogoliubov quasiparticle spectral weight in the antinodal region is shown to reconcile spectroscopic and transport measurements in underdoped cuprates.
In order to shed light on the origin of the two energy scales revealed by Raman in and geometries, we consider a very simple phenomenological model of a superconductor with a gap function .
The angle is associated with momentum k on the Fermi surface. The gap function vanishes at the nodal point while it is maximal at the antinodes .
Within a Fermi liquid description the quasiparticle contribution to the Raman response in the superconducting state is described by LeTacon ; Devereaux1 :
| (9) |
The angular average over the Fermi surface is denoted . is the density of states at the Fermi level, are the Raman vertices which read and , respectively. is a BCS coherence factor. Eq. (9) can be easily deduced from Eq. (7), (see Methods).
The function is the spectral weight of the Bogoliubov quasiparticles, while is a Fermi liquid parameter associated with the coupling of these quasiparticles to the electromagnetic field. Expression (9) differs from simple BCS theory for a non interacting Fermi liquid at (see eq.5) by the presence of these quasiparticle renormalizations, which importantly only enter through the product .
In the following, we will show that the angular dependence of this quasiparticle renormalization plays a key role in accounting for the experimental observations.
Let us first consider the geometry the Raman vertex is peaked at the antinode which dominates the response, resulting in a pair-breaking coherence peak at due to the singularity of the BCS coherence factor. The weight of this peak is directly proportional to the antinodal quasiparticle renormalization . Hence, the fact that the coherence peak looses intensity at low doping (and even disappears altogether at low doping) strongly suggests that decreases rapidly as doping is reduced. This has been first suggested in earlier Raman studies Chen .
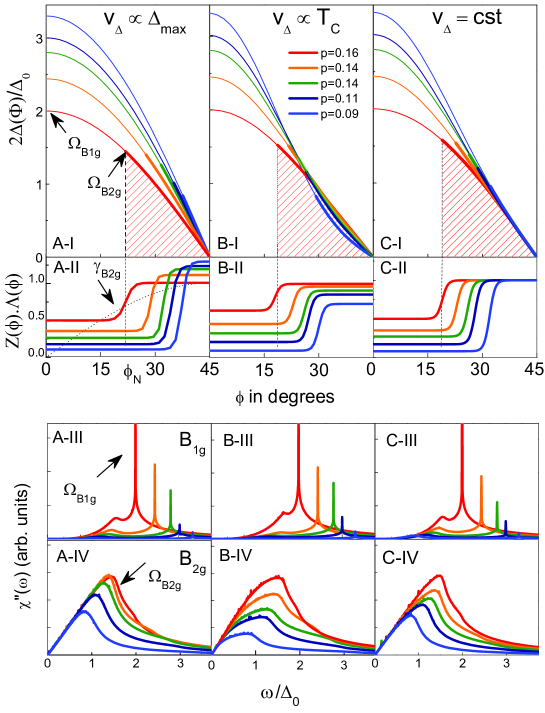
In the geometry, the situation is more subtle because the Raman vertex is largest at the nodes, where the gap function (and hence the BCS coherence factor) vanishes. This is illustrated in fig. 11, pannels (AI-II).
As a result, the energy of the coherence peak depends sensitively on the angular dependence of the quasiparticle renormalization . If the latter is approximately constant along the Fermi surface, then the energy of the peak is determined solely by the angular extension of the Raman vertex .
In contrast, let us consider a which varies significantly from a larger value at the node to a small value at the antinode, with a characteristic angular extension around the node smaller than the intrinsic width of the Raman vertex . Then, it is itself which controls the position of the peak: .
As shown below, this explains the origin of the differentiation between the two energy scales in the underdoped regime.
To proceed further in the simplest possible way, we consider a simple crenel-like shape for , varying rapidly from for to for (see fig. 11, AII-CII).
Furthermore, we adopt the often-used Mesot parametrization of the gap function. , consistent with d-wave symmetry where the nodal slope of the gap does not necessarily track . We thus have 5 parameters: , (or ), , and the angular extension . These parameters are determined by attempting a fit to our spectra, obeying the following constraints: (i) the maximum gap is determined from the measured energy of the peak according to ; (ii)the antinodal quasiparticle renormalization is determined such as to reproduce the intensity of the coherence peak; (iii) the angular extension is determined from the energy of the nodal coherence peak. Throughout the underdoped regime, this amounts to as discussed above and finally the nodal renormalization is constrained to insure that the ratio does not change as a function of doping level, at least in the range . This has been observed experimentally in Ref. Blanc and reported in fig. 7d.
This ratio controls the low-frequency behavior of the Raman response. We assume here that the density of states (associated with the Fermi velocity perpendicular to the Fermi surface) does not depend sensitively on doping level in this range.
These 4 constraints leave one parameter undetermined, which can be taken as the deviation of the gap function from a pure form, as measured by the ratio of the nodal velocity to the maximum gap.
We will thus consider three possible scenarios:(A) Pure gap: (). This corresponds to a superconducting gap involving a single characteristic energy, which increases as the doping level is reduced. (B) tracks the critical temperature . In this case, the gap function is truly characterized by two scales varying in opposite manner as the doping level is reduced. (C) remains constant as a function of doping. This is also a two-scale superconducting gap scenario, although with a milder variation of .
In figure 11, are displayed our fits of the and Raman spectra in the framework of this simple theoretical analysis, following each of the three scenarios (A-C) above.
We observe that the main aspects of the experimental spectra, and most importantly the existence of two energy scales , varying in opposite manners as a function of doping, can be reproduced within any of the three scenarios.
A common feature between all three scenarios is that the quasiparticle renormalization function varies significantly along the Fermi surface. Quasiparticles have a large spectral only on a restricted region around the nodes, defined by , corresponding to a fraction of the Fermi surface.
While increases with falling doping, decreases because of the rapid contraction of the coherent fraction , leading to the opposite doping dependence of the two scales, as illustrated on fig. 12-a.
We note that linearizing the gap function in the coherent region is a reasonable approximation for the A and C scenarios, leading to the relation which links the nodal () energy scale (proportional to ), the nodal velocity and the coherent fraction. Note2 . This approximation is not valid for the B scenario because it leads to as a constant in contradiction with this scenario.
It is clear that having uniformly coherent Bogoliubov quasiparticles along the Fermi surface (corresponding to a constant ) is inconsistent with our data, especially in view of the rapid suppression of the coherence peak and the corresponding decrease of .
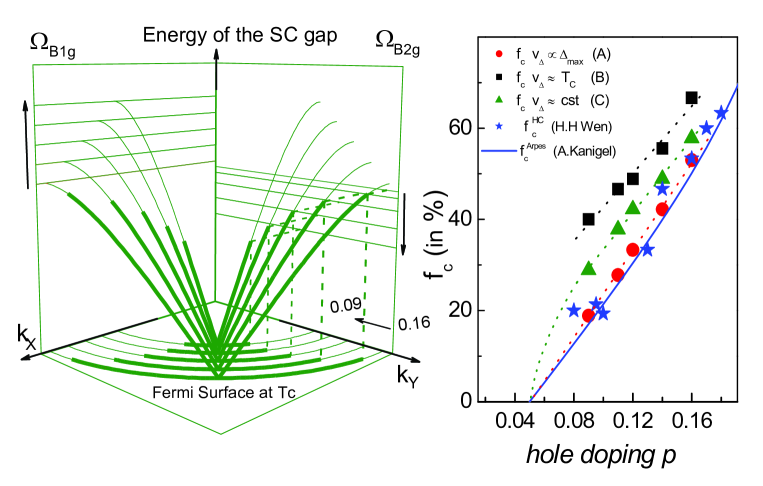
Although the above features are common to all three scenarios, there are two key differences between them. The first one is qualitative: in scenario A (a single gap ) the nodal renormalization factor increases as doping level is reduced, while it decreases for scenario B () and stays constant for scenario C (). The second, quantitative, difference is the rate at which the coherent fraction of the Fermi surface decreases with falling doping, being largest for scenario A and smallest for B (Fig. 12-b).
Clearly, highly accurate spectroscopy measurements in the nodal region aiming directly at the determination of or would discriminate between these three scenarios. Such measurements are, unfortunately, notoriously difficult and a consensus has not been yet reached.
A determination of the coherent fraction has been reported from heat-capacity (HC) measurements HHWen ; Matsuzaki and reproduced on Fig. 12-b. It was also reported from ARPES Kanigel ; Kanigel2 in the normal state that the Fermi arcs shrink upon cooling as . The doping evolution of coherent fraction at is displayed in Fig.12-b. Remarkably, we find that there is a good quantitative agreement between the doping dependence of reported from HC and ARPES and our determination from Raman within scenario A (a single gap scale ), which appears to be favored by this comparison.
Although this quantitative agreement should perhaps not be overemphasized in view of the uncertainties associated with each of the experimental probes, we conclude that this single-gap scenario (A) stands out as the most likely possibility.
We note that this interpretation reconciles the distinct doping dependence of the two energy scales with the thermal conductivity measurements of underdoped samples. Thermal conductivity measurements interpreted within the clean limit and a Fermi velocity almost constant (in the doping range ) show that Sutherland ; Hawthorn .
We can further note by combining the ratios (deduced from Raman and penetration depth measurements Blanc ; Panagopoulos ) and (deduced from heat capacity measurements under magnetic field HHWen ) that we get: and . Both and increase with underdoping as expected within the single gap scenario (A). Here we have assumed that the nodal quasiparticles renormalization, , takes roughly the same value for Raman, penetration depth and heat capacity measurements.
With a single-scale superconducting gap, the relation between the critical temperature (or ) and the coherent fraction reads: (10). This is consistent with previous investigations Ding ; HHWen and more recent ones Yazdani ; Ideta . This relation carries a simple physical meaning, namely that it is the suppressed coherence of the quasiparticles that sets the value of , while increases with falling doping. This relation differs from the standard BCS theory. Crucially, in cuprates depend on a prefactor, which is doping dependent.
We can also pointed out that scenario (A) is consistent with the Uemura relation (valid in the underdoped regime) and Homes’law Uemura ; Homes . Indeed, and (valid in the dirty limit) lead to (11). and are respectively the superfluid density and dc conductivity. By combining eq.(10) and (11) we obtain which makes sense since current flows on the fraction of coherent Fermi surface.
Finally, our interpretation is also in agreement with previous observations on Giaver and Andreev Saint-James (ASJ) tunneling experiments which pointed out the existence of two distinct energy scales in superconducting state of underdoped cuprates Deutscher . The high energy scale was assigned to the single particle exictation energy. This is the energy of the first excited state required to break a Cooper pair in Giaver tunneling experiment Giaver . This corresponds to the Raman scale associated to the pair breaking peak energy. The low energy scale was assigned to the energy range over which Cooper pairs can flow in the ASJ tunnelling. It is directly related to the Raman scale since, this last one, is controlled by the fraction of coherent Fermi surface around the nodes where supercurrents flow.
THE PSEUDO GAP AND LOSS OF ANTI-NODAL QUASIPARTCLES IN UNDERDOPED CUPRATES
Raman experimental observation of the pseudo gap
The exploration of the superconducting state of underdoped cuprates reveals that coherent Bogoliubov quasiparticles are reduced on restricted regions of the Fermi surface around the antinodes. This manifests itself by a strong decrease of the coherent Cooper pairs density at the antinodes while it is still sizeable around the nodes. We have defined a fraction of coherent Fermi surface around the nodes where the d-wave superconducting gap developps. The loss of quasiparticles spectral weight is then responsible for the strong dichotomy in the quasiparticles dynamics between the antinodal and the nodal regions and the emergence of two energy scales in the superconducting state.
The loss of antinodal Bogoliubov quasiparticles in underdoped regime below is concomitant with a strong depletion of the electronic continuum in the normal state as the temperature is decreasing down to a temperature just above . This can be seen in fig. 13 for an underdoped sample ( and ). As the sample is cooled down from to the low energy electronic background level drecreases. Similar observations have been reported in earlier works Gallais ; Venturini1 .
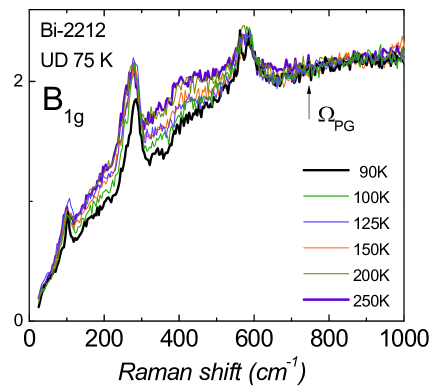
Such a coincidence leads us to wonder if the loss of quasiparticle spectral weight on restricted parts of the Fermi surface that we have revealed in the superconducting state of underdoped cuprates (see previous section) persists above and more generally is a salient feature of the underdoped cuprates physics.
In order to address this question we have performed Raman measurements on a large range of temperatures below and above . In fig. 14-a is displayed the temperature dependence of the Raman response of an underdoped single crystal. For each temperature, the Raman response has been subtracted from the one measured at and it has been reported on fig. 14-b.
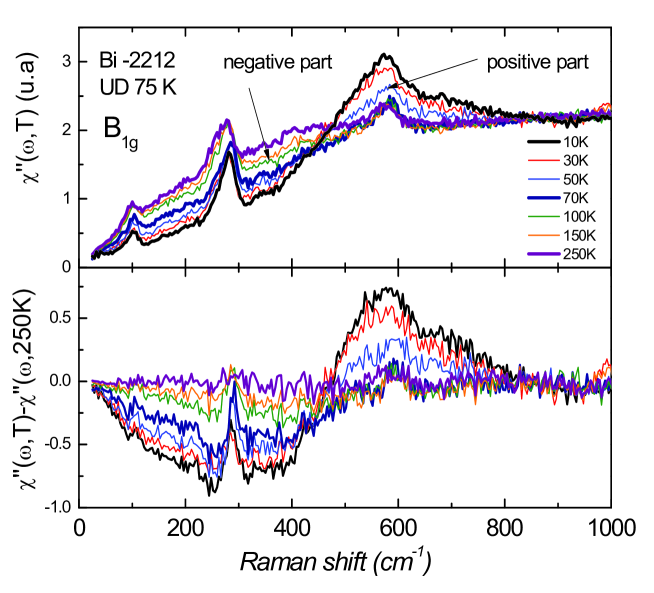
The subtracted Raman responses can then be decomposed in two parts: a positive and a negative one. The positive part (at high energy above ) developps in the superconducting state up to and corresponds to the coherent pairs breaking peak already discussed in the previous section. The negative part (below ) corresponds to the depletion of the low energy electronic continuum which is filled up when temperature increases. It persists well above and only disapears in the normal state around 200 K. The persistence of a low energy negative part well above is interpreted by us as the experimental signature of the pseudogap in ERS. The lowest temperature from which the negative part is no more temperature dependent will set the pseudogap temperature . Here is close to 200 K.
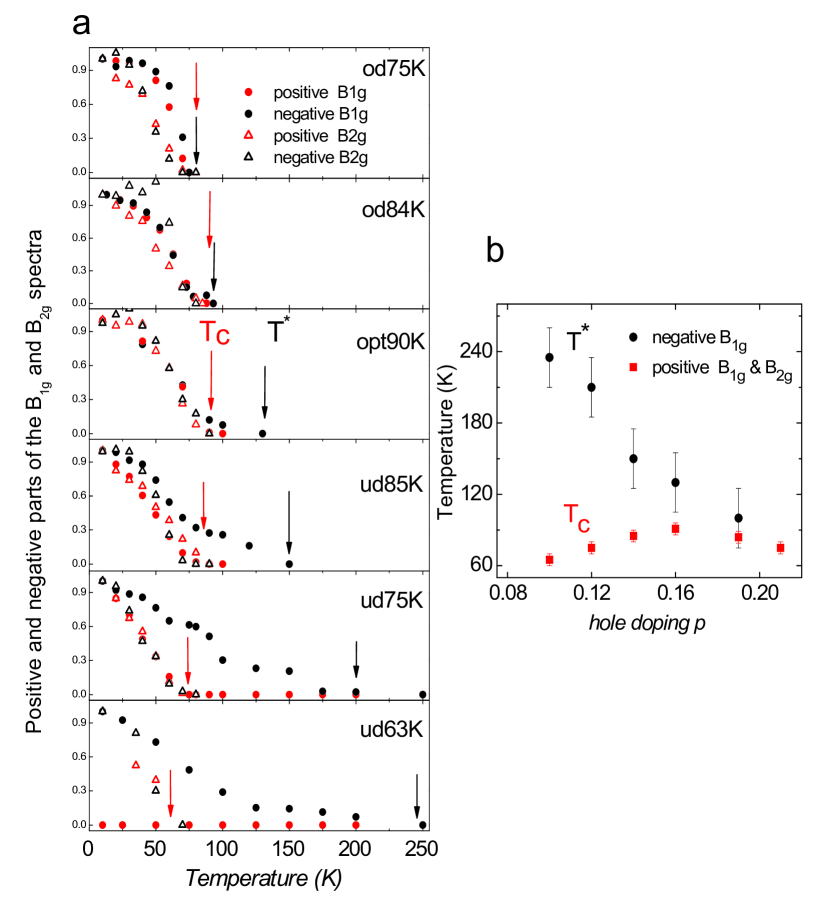
In fig. 15-a is displayed the temperature dependence of the positive and negative parts obtained from the subtracted (Anti-Nodal) and (Nodal) Raman spectra of . The Raman spectra will be shown in the next section. For each doping level, the and Raman spectra have been subtracted by the lowest temperature from which no more depletion is detected. is indicated by a gray (red) arrow. We observe that the negative parts of the subtracted Raman spectra (black dot) persist well above in particular for low doping levels. Lower is the doping level higher is the temperature from which the depletion disappears. This gives us an estimate of (marked by a black arrow). In contrast the negative parts (related to the nodal region) (open black triangle) disappears around . This shows that the pseudo gap is predominent in the antinodal region and becomes sizeable below the optimal doping level. This is consistent with ARPES data Kanigel ; Kanigel2 ; Norman . We are then able to extract the pseudogap temperature from our experimental data. for an optimal doping level (Opt90K), for an underdoped sample with a , beyond for an underdoped sample with a and in between and 250 K for an underdoped sample of . The positive parts of the and Raman spectra (red dot and open triangle) both disappear at as expected since they correspond to coherent Cooper pairs (see previous section). The doping dependence of and extracted from our data are plotted in fig.15-b and it is consistent with the values of reported by other techniques Nakano .
In summary, our experimental findings show that the pseudogap manifests itself in the normal state just above , as a strong depletion of low lying electronic excitations at the antinodes which are only restored well above at . Simultaneously, in the superconducting state the coherent Bogoliubov quasiparticles are strongly reduced at the antinodes with underdoping (see fig. 7). This leads us to conclude that the pseudogap suppresses quasiparticles around the antinodes above and below in the underdoped regime. The pseudogap is then ”‘harmful”’ to the formation of Cooper pairs and acts as a ”foe” of superconductivity in underdoped cuprates.
The doping dependence of is still a subject of intense debate, although a consensus emerges concerning the underdoped regime where is reported to increase as the doping level is reduced. In the overdoped regime the situation is not yet claryfied: three schemes are in discussion. (i) merges with , (ii) crosses or (iii) ends at the superconducting dome in the overdoped regime Norman2 .
Let’s return to our experimental findings in the superconducting state (see previous sections). We have defined two distinct regions in the superconducting state of the cuprates. The first one (in the overdoped side of superconducting dome) corresponds to a single energy scale. The and energy scales merge together and quasipartciles are well defined over the whole Fermi surface. On the contrary, in the underdoped side of the supercondcuting dome, we clearly detect two distinct energy scales inside the superconducting state. The and energy depart from each other and result from a loss of quasiparticles around the antinodes. Such a dichotomy inside the superconducting state which manifests itself by a loss of quasiparticles in the underdoped part of the superconducting dome leads us to think that has to cross the superconducting dome.
Interpretation of the pseudo-gap
In the underdoped regime, the pseudogap develops around the antinodes and suppresses quasiparticles below which are not restored below . A loss of quasiparticles in the antinodal region below should manifest distinctly in the Raman spectra according to the or geometries. We expect a depletion of the (AN) electronic continuum level over a large energy range which is filled up as the temperature is rised before disappearing above when coherent quasiparticles are restored over the whole Fermi surface.
On the other hand, we expect no continuum depletion at low energy in the since the pseudogap vanishes in the nodal region. The low energy quasiparticle dynamic is then expected to have a standard Fermi liquid behaviour. This means that the low energy slope of the electronic continuum is expected to be proportional to the quasiparticle lifetime according to a simple Drude like model Zawadovwski and increases with cooling. The pseudogap only manifests itself in the spectrum at higher energy by an electronic continuum depletion which disappears above and involves the loss of quasiparticles induced by the end of the pseudogap amplitude away from the antinodes. This is indeed what is experimentally observed on the temperature dependence of the and Raman spectra of an underdoped single crystal () and are reported in fig. 16-a and b.
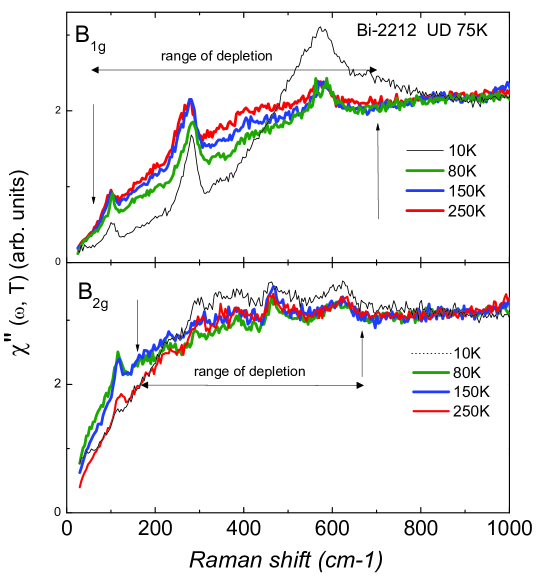
In fig. 16-a, the electronic background exibits a strong depletion which is filled up as the temperature is rised from to . This extends from to approximatively . We can then notice that the onset of the depletion is localized close to the energy of the coherent peak. On the contrary, the electronic background do not exhibits depletion below 180 and only a weak depletion between and which extends from 180 to approximatively 700 . Such a weak depletion has been also observed in earlier works Nemetschek ; Gallais . We can notice that this weak depletion does not really affect the temperature dependence of the global negative part reported in fig. 15.
Below 180 the low energy background level decreases as the temperature increases in opposite way to the low energy electronic background level. This is a standard temperature dependence of the slope of an electronic Raman continuum free of a pseudogap. As the consequence, the low and high energy parts of the Raman spectra exhibit two distinct temperature dependences in contrast to the spectrum where the electronic background continuously increases as the temperature increases.
The experimental observations are different for the overdoped cuprates. In fig. 17-a and b are displayed the temperature dependence of the and Raman spectra of an overdoped single crytal (). No clear depletion (which is filled up with heating) is observed in the and electronic Raman continua. In Raman spectra, solely, the decrease of the low energy slope of the electronic continuum is detected as the temperature is raised according to a simple Drude model.
In summary our experimental findings in the normal state of underdoped cuprates have permitted us to detect the pseudogap in the electronic Raman responses and assign it to a partial suppression of coherent quasiparticles around the antinodes which are only restored above .
This depletion which starts in the superconducting state of underdoped cuprates, is responsible for the strong decrease of the density of Cooper pairs in the antinodal region.
CONCLUSION
As the Mott insulating is approaching, superconductivity is paradoxically confined in the nodal region where the superconducting gap amplitude is weak. k-space coherent Cooper pair islands are then formed in the nodal region while a strong decrease of coherent Bogoliubov quasiparticles in the antinodal region is experimentally observed. We have defined a fraction of coherent Fermi surface upon which superconductivity developps around the nodal region. Below the optimal doping, controls such as . is decreasing while the superconducting gap amplitude is increasing. This leads to two energy scales in the superconducting state of underdoped cuprates. Such a dichotomy in the quasiparticle dynamics persists in the normal state of underdoped cuprates up to and is responsible for the emergence of the pseudogap phase which manifests itself as a loss of quasiparticles around the antinodes. Physics of the nodal quasiparticles is then predominant in underdoped cuprates.
A tentative 3D phase diagram
Let’s now try to answer to the first question put in the introduction about a 3D phase diagram which involves both the energy and temperature phase diagrams. An attempt to depict such a phase diagram is shown in fig. 18.
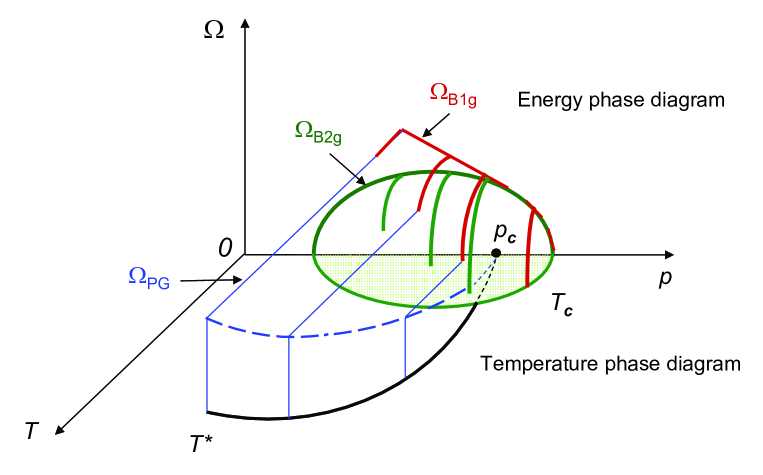
The energy phase diagram () is plotted on the vertical plane. The and energy scales (which correspond to the locations of the coherent peaks detected below ) are displayed. The upper energy scale is no more detected at low doping level while the lower energy scale is still observable. The temperature phase diagram () is plotted in the horizontal plane. As suggested by our experimental findings, cuts the superconducting dome in the overdoped side. The and curves are respectively in gray (green) and black.
The thin (blue) lines correspond to the onset energy of the depletion, , detected below and above (see fig. 13). Our preliminary results (see for an example figs. 14) seem to indicate that is roughly temperature independent and merges with the energy scale measured just below . In fig. 18, the dashed (blue) line delimit the zone of the 3D phase diagram beyound which the depletion disappears and is no more detected.
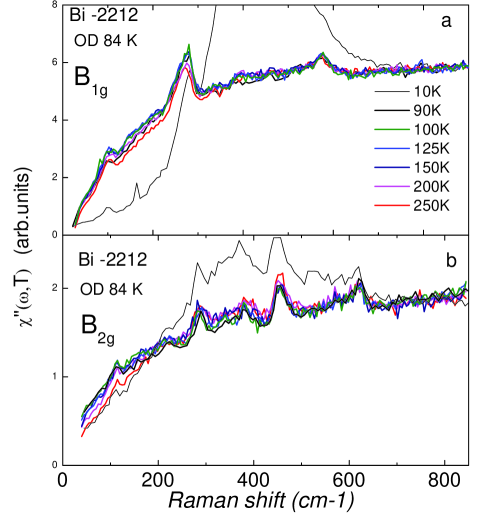
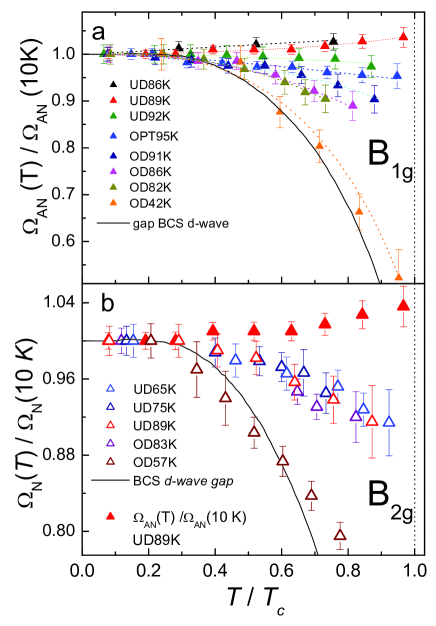
In the strongly overdoped regime, above , the and energies exhibit the same temperature dependence and they both decrease as is reached. These observations have been reported in our previous studies Guyard01 ; Guyard02 and shown in figures 19-a and b. As the doping level is reduced, however the energy scale is no longer temperature dependent while the energy scale is still temperature dependent and decreases (even slightly) as the temperature is increased up to (see fig. 19-a and b). This is sketched in fig. 18 by the appearance of two distinct branches for and as the temperature increases.
Although more investigations are needed to track the doping dependence inside the superconducting dome, its extrapolation (drawn in fig. 18) seems to indicate that it rises from the doping level. is also the doping level from which the and energy scales (in red and green respectively) depart form each other. Our interpretation is that is the starting doping level below which antinodal coherent quasiparticles become suppressed. Above , superconductivity developps over the whole Fermi surface like in conventional superconductors. Below superconductivity is k-space confined and only developps on the fraction of coherent Fermi surface around the nodes.
How increasing Tc?
Our experimental findings in the underdoped cuprates tell us that is limited by such as . The true challenge is then to increase in the underdoped regime. In other words: if we are able to restore a full Fermi surface in the underdoped regime of cuprates, we should increase in the cuprates. Unfortunately, loss of quasiparticles with underdoping around the antinodes acts against superconductivity and reduces .
Why coherent quasiparticles at the antinodes are suppressed as the doping level is reduced? We do not know yet. Strong electron-electron interaction plays probably an important role in this mechanism. We are then looking for cuprates with a normal resistivity as weak as possible above the optimal doping level (where both nodal and antinodal quasiparticles contribute to transport). We follow the simple idea that weak resistivity corresponds to weak electron-electron coupling. This contrasts with conventional superconductors where resistivity has to be chosen as large as possible to get a strong electron-phonon coupling. Here, the “glue” of pairing should be electron-electron interactions but if they are too strong, they reduce the coherent length and induce localization of Cooper pairs working against superconductivity.
METHODS
Details of the experimental procedure
The ERS experiments have been carried out using a triple grating spectrometer (JY-T64000) equipped with a nitrogen cooled CCD detector. ERS measurements give access to the dynamical structure factor, so the imaginary part of the Raman response function is obtained after correcting all the spectra for the Bose-Einstein factor. is also corrected for the spectral response of the spectrometer which involve mainly the efficency of the grattings and the CCD detector. In some special cases, for obtaining intrinsic Raman measurements from Bi-2212 crystals with various doping levels, we have placed an extremely high level of control of the crystal surface quality, the optical set up and the knowledge of optical constants for each crystal studied.
ERS measurements on single crystals have been performed with the red excitation line (1.9 eV) of a Kr+ laser to obtain the electronic and Raman response functions, the reason is that we have experimentally noticed that the Raman phonon activity is strongly reduced with the red line in comparison with the blue one Kang ; Gallais2 ; LeTacon2 . This gives us a direct view of the electronic response without invoking ad hoc phonon subtraction procedures usually used in cuprate systems. In some cases, however, the green line has been used for probing the nodal region () due to the high efficiency of our detection in this energy range. Raman measurements on single crystals have been carried out mostly with the green excitation line (2.4 eV).
Crystal growth
The single crystals have been grown by the flux method, and oxygen annealing have been performed in order to overdope crystals [Bertinotti, ]. The oxygen annealing is efficient within a few m from the surface which is satisfactory for performing Raman scattering (the light penetration depth being of the order of the ). The underdoped crystals are homogeneous as-grown single crystals. is a quite ideal cuprate material for ERS measurements see ref. [Guyard01, ; LeTacon, ] for more details. It takes a pure tetragonal symmetry without any Cu-O chain contrary to (Y-123) or buckling which alters the unit cell of . We can then separately measure pure nodal and antinodal Raman responses, without mixing effects. Hg- is made of one single layer which is a plane of symmetry in the unit cell. Raman active modes are therefore forbidden in the layer. This allows us to investigate the low energy electronic Raman spectrum without being hindered by extra phonons lines.
The single crystals were grown by using a floating zone method Gu . system can be easily cleaved providing large homogeneous surfaces (). By using the same protocol as the one developped elsewhere Blanc , we have obtained intrinsic Raman measurements to make reliable quantitative comprarisons between the Raman intensities of crystals with distinct doping level.
For both and systems, the doping value is inferred from using Presland and Tallon’s equation: Presland and has been determined from magnetization susceptibility measurements for each doping level.
Derivation of equation (8) from equation (5)
When , the Raman susceptibility becomes:
| (10) |
with
We can first notice that (i) the integrant is predominant when goes to zero which means and (ii) is a function of . This means
. Here are the zeros of .
We consider a 2D Brillouin zone (convenient for cuprates) and we transform the sum over by an integration such as “”is chosen perpendicular to the constant-energy line. We put:
.
We then obtain for a non interacting Fermi liquid:
| (11) |
where
For an interacting Fermi liquid, we have to take into account the square of the quasiparticle renormalization factor which then appears in the integrant of (eq.11) LeTacon .
ACKNOWLEDGEMENTS
We are grateful to A. Georges, Ph. Bourges, J. Carbotte, J. C. Campuzano, J. Mesot, M. Le Tacon, G. Kotliar, G. Blumberg, L. Taillefer, N. Hussey, J. Tallon, H. H. Wen, D. Pavuna, J. C. Davis, A. Yazdani, C. Ciuti, R. Lobo, M. Civelli, A. J. Millis, P. Coleman, P. Hirschfeld, Ph. Monod, F. Rullier Albenque , C. C. Homes and Z. Tesanovic for very helpful discussions. The authors A. S., Y. G., M. C. and S. B. would like to thank support from french national agency for research (ANR), BLAN07-1-183876, GAPSUPRA. Correspondences and requests for materials should be adressed to A.S.(alain.sacuto@univ-paris-diderot.fr).
References
- (1) P. W. Anderson, Science 235, 1196 (1987).
- (2) W. E. Pickett, Rev. Mod. Phys. 61, 433 (1989).
- (3) C. C. Tsuei et al., Phys. Rev. Lett. 93, 187004 (2004).
- (4) R. Khasanov et al., Phys. Rev. Lett. 98, 057007 (2007).
- (5) H. Alloul et al., Phys. Rev. Lett. 63, 1700 (1998).
- (6) T. Timusk, and B. W. Statt, Rep. Prog. Phys., 62, 61-122 (1999).
- (7) B. Fauqué et al., Phys. Rev. Lett. 96, 197001 (2006).
- (8) J. Xia et al., Phys. Rev. Lett. 100, 127002 (2008).
- (9) M. J. Lawler et al., Nature 466, 347 (2010).
- (10) Rui-Hui He et al., Science 331, 1579 (2011).
- (11) J. L. Tallon and J. W. Loram, Physica C 349, 53 (2001).
- (12) L. Taillefer, Annual Review of Condensed Matter Physics 1, 51 (2010).
- (13) H. Alloul et al., Europhys. Lett. 91,37005 (2010)
- (14) G. Deutscher, Nature 397, 410 412 (1999).
- (15) M. Le Tacon et al., Nat. Phys. 2, 537 (2006).
- (16) W. Guyard et al., Phys. Rev. B 77, 24524 (2008).
- (17) Y. Gallais, A. Sacuto, T. P. Devereaux, and D. Colson , Phys. Rev. B 71, 012506 (2005).
- (18) M. Opel et al., Phys. Rev. B, 61, 9752-9844 (2000).
- (19) J. Mesot et al. Phys. Rev. Letters 83, 840 (1999).
- (20) K. Tanaka et al., Science 314, 1910 (2006).
- (21) W. S. Lee et al., Nature 450, 81 (2007).
- (22) C. Bernhard et al., Phys. Rev. B 59, R6631 (1999).
- (23) M. C. Boyer et al., Nat. Phys. 3, 802 (2007).
- (24) Y. Kohsaka et al. Nature 454, 1072 (2008).
- (25) A. Pushp et al., Science 26, 1689 (2009).
- (26) A. A. Abrikosov, et V. M. Genkin, Sov. Phys.-JETP, 38,417 (1974).
- (27) A. Sacuto et al., Phys. Rev. B 58, 11721, (1998).
- (28) G. Burns “introduction to group theory with applications”, Academic Press, (1977).
- (29) M. V. Klein, “Electronic Raman scattering in Light Scattering in Solids 1”, Springer Verlag, Berlin, (1983).
- (30) H. B. Callen and T. A. Welton, Phys. Rev. 83, 34 (1951).
- (31) G. Rychkazen “Green’s functions and condensed matter,Academic Press, London, (1984).
- (32) G. D. Mahan Many Body Particle Physicse, Plenum Press, New York (1990).
- (33) T. P. Devereaux and R. Hackl, Rev. Mod. Phys. 79, 175 (2007).
- (34) X. K. Chen et al., Phys. Rev. B 56, R513 (1997).
- (35) T. P. Devereaux and D. Einzel, Phys. Rev. B 51, 16336-16357 (1995).
- (36) S. Blanc et al., Phys. Rev. B 80, 140502R (2009).
- (37) S. Blanc et al., Phys. Rev. B 82, 144516 (2010).
- (38) M. V. Klein and S. B. Dierker, Phys. Rev. B 29, 4976-4991 (1984).
- (39) This analysis makes the assumption that for an interacting Fermi liquid (as it is the case for cuprates), the renormalized quasiparticles spectral weight which comes from the coupling between quasiparticles in interaction and the electromagnetic field follows the same doping dependence than the coherent Bogoliubov quasiparticles.
- (40) P. G. de Gennes, Superconductivity of Metals and Alloys, Addison Wesley Publishing Company, (1966).
- (41) A. J. Legett, Quantum Liquids, Bose Condensation and Cooper Pairing in Condensed-Matter Systems, Oxford University Press,(2006).
- (42) L. B. Ioffe and A. J. Millis, J. Phys. Chem. of Solids 63, 2259 (2002).
- (43) K. McElroy et al., Phys. Rev. Lett. 94, 197005 (2005).
- (44) D. L. Feng et al., Science 289, 277 (2000).
- (45) H. Ding et al. Phys. Rev. Lett. 87, 227001 (2001).
- (46) I. M. Vishik et al. Nature Phys. 5, 718, (2009).
- (47) F. Venturini, et al., J. Phys. Chem. Solids 63, 2345 (2002).
- (48) S. Sugai, et al., Phys. Rev. B 68, 184504 (2003).
- (49) Y. DeWilde, et al. Phys. Rev. Lett. 80, 153 156 (1998).
- (50) J. F. Zasadzinski, et al. Phys. Rev. Lett. 87,067005 (2001).
- (51) J. C. Campuzano et al. Phys. Rev. Lett. 83, 3709 3712 (1999).
- (52) S. Hufner, M. A. Hossain, A. Damascelli, and G. A. Sawatzky, Rep. Prog. Phys. 71, 062501 (2008).
- (53) A. Millis, Science 314, 1888 (2006).
- (54) K. Terashima et al. Phys. Rev. Lett. 99, 017003 (2007).
- (55) M. Shi et al., Phys. Rev. Lett. 101, 047002 (2008).
- (56) K. Kondo, R. Khasanov, T. Takeuchi J. Schmalian, and A. Kaminski , Nature 457, 296 (2009).
- (57) U. Chatterjee et al., Nature Phys. 5, 1456 (2009).
- (58) J. G. Storey, J. L. Tallon, G. V. M. Williams, J. W. Loram, Phys. Rev. B 76, 060502 (2007).
- (59) B. Valenzuela and E. Bascones Phys. Rev. B78, 174522 (2008).
- (60) J. P. F. LeBlanc, J.P. Carbotte and E. J. Nicol, Phys. Rev. B 81, 064504 (2010).
- (61) J. L. Tallon and J. G. Storey, arxiv:0908.4430v1 (2009).
- (62) A. Kanigel et al., Phys. Rev. Lett. 99, 157001 (2007).
- (63) M. R. Presland, et al. Physica C, 176, 95-105 (1991).
- (64) This contrasts with earlier work (A. V. Chubukov and M. R. Norman, Phys. Rev. B77, 214529 (2008))where no link has been considered between and .
- (65) A. Kanigel et al., Nature Phys. 2, 447 (2006).
- (66) H. H. Wen et al. Phys. Rev. B 72, 134507 (2005).
- (67) T. Matsuzaki, N. Momono, M. Oda, and M. Ido, J. Phys. Soc. Jpn. 73, 2232 (2004).
- (68) M. Sutherland, et al. Phys. Rev. B 67, 174520, (2003).
- (69) D. G. Hawthorn et al., Phys. Rev. B 75, 104518 (2007).
- (70) C. Panagopoulos et al., Phys. Rev. Lett. 81, 2336 (1998).
- (71) S. Ideta et al., arXiv:1104.0313v1, (2011).
- (72) Y. J. Uemura et al., Phys. Rev. Lett. 62, 2317(1989).
- (73) C. C. Homes et al., Phys. Rev. B 72, 134517, (2005); C. C. Homes et al., Nature 430, 539 (2004).
- (74) I. Giaver, Phys. Rev. Lett. 5, 147 (1960).
- (75) M. R. Norman et al. Nature 392, 157 (1998).
- (76) F. Venturini et al., Phys. Rev. Lett. 89, 107003 (2002).
- (77) T. Nakano et al., J.Phys.Soc.Jpn. 67, 2622 (1998).
- (78) M. R. Norman, D. Pines, and C. Kallin, Adv. Phys. 54, 712 (2005).
- (79) A. Zawadowski and M. Cardona, Phys. Rev. B 42, 10732 (1990).
- (80) R. Nemetschek et al., Phys. Rev. Lett. 78, 4837 (1997).
- (81) W. Guyard et al., Phys. Rev. Lett. 101, 097003, (2008).
- (82) M. Le Tacon, A. Sacuto and D. Colson, Phys. Rev. B, 71, 100504(R) (2005).
- (83) M. Kang, G. Blumberg, M. V. Klein, and N. N. Kolesnikov, Phys. Rev. Lett., 77, 4434 (1996).
- (84) Y. Gallais, A. Sacuto, and D. Colson, Physica C, 408-410, 785 (2004).
- (85) J. S. Wen, Z. J. Xu, G. Y. Xu, M. Huckera, J.M. Tranquada and G. D. Gu, J. of Crystal Growth. 310, 1401 (2008).
- (86) A. Bertinotti et al., Physica C, 268, 257-265 (1996).