Relaxation of Optically Excited Carriers in Graphene
Abstract
We explore the relaxation of photo-excited graphene by solving a transient Boltzmann transport equation with electron-phonon (e-ph) and electron-electron (e-e) scattering. Simulations show that when the excited carriers are relaxed by e-ph scattering only, a population inversion can be achieved at energies determined by the photon energy. However, e-e scattering quickly thermalizes the carrier energy distributions washing out the negative optical conductivity peaks. The relaxation rates and carrier multiplication effects are presented as a function of photon energy and dielectric constant.
pacs:
78.67.Wj, 78.20.Bh, 72.20.Jv, 72.80.VpFollowing the success in fabricating field-effect transistors using a single carbon atom layer Novoselov et al. (2004), graphene has been actively studied as a possible basis for electronic and optoelectronic devices Avouris (2010). Graphene’s linear dispersion and zero energy gap result in unique transport and optical properties Chen et al. (2008); Nair et al. (2008); Mak et al. (2008), and new device concepts have been proposed to make use of those special features Katsnelson et al. (2006); Cheianov et al. (2007). Recently, a new type of terahertz laser based on graphene has been proposed Ryzhii et al. (2007, 2010). Analytical model calculations considering relaxation involving optical phonon emission have shown that with sufficiently strong optical pumping, population inversion and negative ac conductivity may be achieved in the terahertz frequency range Ryzhii et al. (2007). This results from the fast optical phonon relaxation followed by an acoustic phonon relaxation bottleneck for excited electrons and holes with energies , where is the Fermi level, and is the optical phonon energy. Some initial experimental results also have been reported suggesting stimulated terahertz emissions in graphene Karasawa et al. (2010). The threshold pumping power needed to obtain population inversion depends on the carrier recombination mechanism Ryzhii et al. (2007). Previous studies on quantum-well systems Goodnick and Lugli (1988) have shown that electron-electron (e-e) scattering is responsible for the fast relaxation of photo-excited carriers, and recent experiments on graphene Newson et al. (2009); Choi et al. (2009) also report ultrafast carrier kinetics. Therefore, it is essential to treat carrier dynamics rigorously to simulate the behavior of photo-excited carriers in graphene.
Here we solve a time-dependent Boltzmann transport equation (BTE) for two-dimensional (2D) graphene with optical pumping. We consider carrier scattering and recombination-generation (R-G) mechanisms including acoustic and optical phonon scattering Lazzeri et al. (2005); Ando (2006); [][andreferencestherein.]Perebeinos_2010, charged impurity scattering Hwang and Das Sarma (2008), photo-generation Nair et al. (2008), spontaneous optical transition Vasko and Ryzhii (2008), and e-e scattering that includes impact ionization and Auger recombination Rana (2007). Using the numerical solutions of the BTE, we study the influence of each scattering mechanism on the properties of optically pumped graphene, compare the results with those from previous approaches with phonon scattering only Ryzhii et al. (2007), and address the challenges involved in realizing population inversion. We solve the BTE as
| (1) |
where is the distribution function at the nth time step for a state with 2D wavevector in the conduction () or in the valence () band, q is the unit charge, is the reduced Planck constant, is the electric field along the x-direction, and are the collision integral and the R-G rates, and is the time interval, which is 0.05 10 fs in our simulation. We treat a bulk graphene under uniform illumination, so has no spatial dependence.
The collision integral treats carrier scattering as
where is the transition rate from to , and means the intra- and inter-band transition respectively. For the two acoustic phonon modes, and , the sum of the two contributions can be treated as isotropic using an averaged sound velocity as
where is the acoustic phonon deformation potential, is the 2D phonon wavevector with magnitude , is the mass density, A is the area of the sample, is the Fermi velocity, is the Bose-Einstein phonon occupation number, is the Dirac delta function, and (or ) signs represent the absorption and emission of phonons. For = 7.1 eV and = 17.3 Perebeinos and Avouris (2010), we obtain a low field mobility of for carrier density of as in Ref. Chen et al. (2008). Acoustic phonon scattering is treated to be inelastic for a rigorous treatment of energy relaxation and broadening of distribution functions. Electron-phonon (e-ph) coupling of long-wavelengh optical phonon modes, and , is expressed as Lazzeri et al. (2005); Ando (2006)
| (2) |
where 11 eV is the optical phonon deformation potential with a coupling constant of = 5.3 eV Perebeinos and Avouris (2010), and = 197 meV. For zone edge phonon modes, only the transverse mode contributes to the carrier scattering, and the transition rate is given by Eq. (2) multiplied by Lazzeri et al. (2005), with eV, meV, and is the angle of .
While the charged impurity scattering Hwang and Das Sarma (2008) degrades the graphene mobility significantly due to momentum relaxation, we find that it has little effect on the optical properties (the main focus of this work) because it does not relax energy.
Coulomb scattering among electrons contributes to the R-G process through impact ionization and Auger recombination Rana (2007), and it can also thermalize distribution functions without changing the total carrier density. For Auger recombination and impact ionization, there are four processes involved, CCCV, VVCV, CVCC, and CVVV, where C and V represent the conduction and valence bands, and the second/third and first/fourth letters represent the initial and final states of the two electrons involved. For example, the transition rate from to in the conduction band due to CVCC is expressed as
where , and and are the direct and exchange matrix elements. To treat the K-K’ valley degeneracy, we double the and terms. Coulomb interactions are calculated using the random phase approximation (RPA) Hwang and Das Sarma (2008). The resulting collision integral in Eq. (1) becomes four-dimensional, and it can be reduced to 2D using the momentum and energy conservation conditions Rana (2007). Processes conserving the number of electron-hole pairs, i.e., CCCC, VVVV, CCVV, and CVCV, are treated in a similar way.
in Eq. (1) includes photo-generation and spontaneous emission. The photo-generation rate is
| (3) |
where is the fine structure constant, is the incident photon energy, is the pumping power, and . From Eq. (3), we can show that the graphene with and has the absorbance of 2.3 Nair et al. (2008). The spontaneous emission is treated using the approach in Ref. Vasko and Ryzhii (2008), but its contribution is much smaller than those from other processes.
Using the models above, we numerically solve the BTE on a 2D k-grid. We first simulate optically pumped graphene without considering e-e scattering, where e-ph scattering is the main mechanism for energy relaxation as in the previous approaches Ryzhii et al. (2007, 2010). Then we introduce e-e scattering and see how the results change. We also explore the effects of , , and on the properties of optically pumped graphene. All simulation results are for 300 K, zero , and no charged impurity. Photo-current with finite due to the transport of photo-excited carriers will be discussed elsewhere.
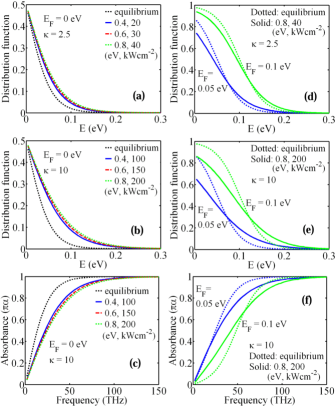
Figure 1 shows simulation results under steady-state low power optical pumping considering e-ph scattering only. In all following results, means averaged over with and . In Fig. 1(a) for = 0 eV, under optical pumping dramatically deviates from equilibrium with peaks modulated by . For eV, for example, photo-excited electrons first generated at E = 0.3 eV pile up at E 0.1 eV and 0.15 eV due to the emission of and phonons. For = 0 eV, photo-excited holes pile up symmetrically in the valence band. Due to interband optical phonon scattering, the piled-up electrons and holes recombine with holes and electrons in the opposite bands, so the carriers with eV are depleted in Fig. 1(a). Figure 1(b) shows the optical absorbance due to interband transition, , vs. frequency , where h is the Planck constant. The absorbance becomes negative, i.e., population inversion is achieved, at specific frequency ranges depending on . Simulation results for eV and 0.1 eV are shown in Figs. 1(c)-(d). For finite ’s, and are not symmetric, and the frequency and the height of the population inversion peaks depend on . In general, as increases, a smaller energy region becomes available for the minority carriers to experience an acoustic phonon bottleneck, so a larger pumping power is required to invert the population.

Figure 2 shows simulation results for optically pumped graphene under steady-state with e-e scattering considered. In Fig. 2(a) for = 0 eV and dielectric constant = 2.5, with optical pumping does not deviate much from equilibrium, and there is little -dependence unlike in the case of Fig. 1(a). We find that under photo-excitation the distribution function remains equilibrium with an elevated electronic temperature determined from the Fermi-Dirac distribution. In Fig. 2(a), = 381 K, 402 K, and 419 K for = 0.4 eV, 0.6 eV, and 0.8 eV respectively. In Fig. 2(b), although we increase by five times and use a high = 10 to reduce the Coulomb interaction, the distribution functions are more broadened with higher ’s (497 K, 529 K, and 553 K) and still far from population inversion, and the absorbance never goes below zero in Fig. 2(c). Here we should note that in RPA Hwang and Das Sarma (2008), the Coulomb interaction does not scale as as expected from the unscreened model. For = 0 eV, for example, the RPA coincides with the unscreened model with where is the vacuum permittivity, so changing from 2.5 to 10 results in the Coulomb interaction being reduced by about five times, not by 16 times. Simulation results for = 0.05 eV and 0.1 eV are shown in Figs. 2(d)-(f). In Fig. 2(d), population inversion is never achieved for = 2.5 and the same ’s as those in Fig. 1(c), and the distribution functions are thermalized with = 408 K and 379 K for = 0.05 eV and 0.1 eV respectively. With = 10 and larger pumping powers in Fig. 2(e)-(f), distribution functions are more broadened with elevated ’s (536 K and 494 K) instead of showing multiple peaks as in Fig. 1(c).
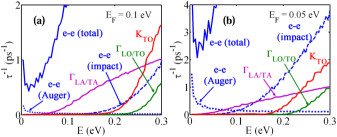
Therefore, e-e scattering significantly broadens the distribution functions washing out peaks due to cascade emission of optical phonons Goodnick and Lugli (1988). To observe this quantitatively, we calculate the carrier lifetime , which is the characteristic time it takes for a carrier in the state with to scatter out to other states. Figure 3 shows results for vs. E for conduction band under equilibrium with = 0.1 eV and 0.05 eV and = 10, where is the average of for . The contribution from e-e scattering scales linearly with E, and it is much larger than those from e-ph scattering and increases with decreasing due to reduced screening.
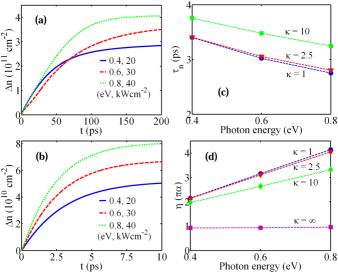
So far we have mainly discussed steady-state results, but transient responses Hertel and Moos (2000) are also important in understanding carrier dynamics in graphene. In Figs. 4(a)-(b), we compare the photocarrier density vs. t for = 0 eV with and without e-e scattering ( = 2.5), where n is the total electron density, is the equilibrium electron density, and the optical pumping starts at time t = 0 ps. With e-e scattering, steady-state is quickly achieved, and , which in turn determines the photo-current response Avouris (2010), is much smaller than with e-ph scattering only. We can fit the vs. t curves using = and extract the relaxation time and the absorption efficiency , where . For e-ph scattering only in Fig. 4(a), is very large (45 60 ps) and increases with while it is much shorter for e-e scattering ( 3 ps) in Fig. 4(b). As shown in Fig. 4(c), increases with increasing and somewhat decreases with increasing . Figure 4(d) shows the vs. results. For (i.e. e-ph scattering only), is close to and independent of . For finite ’s, however, is greater than , which indicates carrier multiplication. The increases with decreasing due to the increased Coulomb interaction, and it increases with increasing because high energy photocarriers have higher ability to initiate impact ionization. A recent theoretical study has reported that with pulse excitations, impact ionization leads to dramatically increased photocarrier densities Winzer et al. (2010). However, for continuous excitation (the main focus of this work), e-e scattering leads to a lower steady-state because Auger recombination becomes stronger and recombination due to optical phonon emission is boosted by the broadened distribution functions, which all result in a reduced . We find that follows the similar time evolution as , and the steady-state under optical pumping depends on , , and as shown in Fig. 2. We also find that the decay time constant, after the optical pumping is switched off, is slightly different than the rise time constant due to the difference in the scattering rate determined by the distribution function in the photo-excited state.
In summary, we numerically solved a time-dependent BTE for bulk graphene considering photo-generation and relevant carrier scattering and R-G mechanisms to explore properties of optically pumped graphene and possibilities to achieve population inversion. Simulation results showed that when carrier energies are relaxed by e-ph scattering only, it is possible to achieve population inversion at frequencies controlled by incident photon energy and graphene Fermi level. A more realistic model considering Coulomb scattering, however, showed that distribution functions are significantly broadened, and it becomes hard to achieve population inversion even with much higher pumping power. The results stress the importance of e-e scattering in carrier dynamics in graphene and suggest that the Coulomb interaction among carriers must be significantly suppressed, such as by bandgap opening in bilayer graphene, to realize graphene-based terahertz lasers. However, e-e scattering leads to significant carrier multiplication.
We thank Prof. Mark S. Lundstrom at Purdue University for helpful discussions. Computational support was provided by the Network for Computational Nanotechnology, supported by the National Science Foundation.
References
- Novoselov et al. (2004) K. S. Novoselov et al., Science 306, 666 (2004).
- Avouris (2010) P. Avouris, Nano Lett. 10, 4285 (2010).
- Chen et al. (2008) J.-H. Chen et al., Nature Nanotech. 3, 206 (2008).
- Nair et al. (2008) R. R. Nair et al., Science 320, 1308 (2008).
- Mak et al. (2008) K. F. Mak et al., Phys. Rev. Lett. 101, 196405 (2008).
- Katsnelson et al. (2006) M. I. Katsnelson, K. S. Novoselov, and A. K. Geim, Nature Phys. 2, 620 (2006).
- Cheianov et al. (2007) V. V. Cheianov, V. Fal’ko, and B. L. Altshuler, Science 315, 1252 (2007).
- Ryzhii et al. (2007) V. Ryzhii, M. Ryzhii, and T. Otsuji, J. Appl. Phys. 101, 083114 (2007).
- Ryzhii et al. (2010) V. Ryzhii et al., J. Appl. Phys. 107, 054505 (2010).
- Karasawa et al. (2010) H. Karasawa et al., J. Infrared Milli. Terahz. Waves , 1 (2010).
- Goodnick and Lugli (1988) S. M. Goodnick and P. Lugli, Phys. Rev. B 37, 2578 (1988).
- Newson et al. (2009) R. W. Newson et al., Opt. Express 17, 2326 (2009).
- Choi et al. (2009) H. Choi et al., Applied Physics Letters 94, 172102 (2009).
- Lazzeri et al. (2005) M. Lazzeri et al., Phys. Rev. Lett. 95, 236802 (2005).
- Ando (2006) T. Ando, J. Phys. Soc. Jpn. 75, 124701 (2006).
- Perebeinos and Avouris (2010) V. Perebeinos and P. Avouris, Phys. Rev. B 81, 195442 (2010).
- Hwang and Das Sarma (2008) E. H. Hwang and S. Das Sarma, Phys. Rev. B 77, 195412 (2008).
- Vasko and Ryzhii (2008) F. T. Vasko and V. Ryzhii, Phys. Rev. B 77, 195433 (2008).
- Rana (2007) F. Rana, Phys. Rev. B 76, 155431 (2007).
- Hertel and Moos (2000) T. Hertel and G. Moos, Phys. Rev. Lett. 84, 5002 (2000).
- Winzer et al. (2010) T. Winzer, A. Knorr, and E. Malic, Nano Lett. 10, 4839 (2010).