Totani et al.Infrared SEDs of Galaxies in the AKARI All Sky Survey \Received2011/03/28\Accepted2011/06/18\Published2011/12/25
galaxies: formation—galaxies: ISM—galaxies: statistics—infrared: galaxies—ISM: dust, extinction
Infrared Spectral Energy Distribution of Galaxies in the AKARI All Sky Survey: Correlations with Galaxy Properties, and Their Physical Origin
Abstract
We have studied the properties of more than 1600 low-redshift galaxies by utilizing high-quality infrared flux measurements of the AKARI All-Sky Survey and physical quantities based on optical and 21-cm observations. Our goal is to understand the physics determining the infrared spectral energy distribution (SED). The ratio of the total infrared luminosity , to the star-formation rate (SFR) is tightly correlated by a power-law to specific SFR (SSFR), and is a good SFR indicator only for galaxies with the largest SSFR. We discovered a tight linear correlation for normal galaxies between the radiation field strength of dust heating, estimated by infrared SED fits (), and that of galactic-scale infrared emission (), where is the optical size of a galaxy. The dispersion of along this relation is 0.3 dex, corresponding to 13% dispersion in the dust temperature. This scaling and the ratio can be explained physically by a thin layer of heating sources embedded in a thicker, optically-thick dust screen. The data also indicate that the heated fraction of the total dust mass is anti-correlated to the dust column density, supporting this interpretation. In the large limit, the data of circumnuclear starbursts indicate the existence of an upper limit on , corresponding to the maximum SFR per gas mass of . We find that the number of galaxies sharply drops when they become optically thin against dust-heating radiation, suggesting that a feedback process to galaxy formation (likely by the photoelectric heating) is working when dust-heating radiation is not self-shielded on a galactic scale. Implications are discussed for the -size relation, the Kennicutt-Schmidt relation, and galaxy formation in the cosmological context.
1 Introduction
Dust grains in interstellar medium (ISM) absorb ultraviolet and optical photons emitted from stars, and the energy is re-emitted from dust grains in infrared and submillimeter wavelengths. The spectral energy distribution (SED) of this dust emission has a broad peak of the modified blackbody in far-infrared bands from large grains in thermal equilibrium with temperatures of 10–50 K. The SED in near- to mid-infrared bands is, on the other hand, characterized by emissions from small grains and polycyclic aromatic hydrocarbons (PAHs) that have a wide distribution of temperature because of stochastic single-photon heating (Desert et al. 1990; see Draine 2003 for a review). Physical dust models about compositions and size distribution have been developed to calculate SEDs of dust emission for a given heating radiation field strength, , and one can predict the global SED integrated over a galaxy by summing up the emission from dust with various values of . Such models have been applied to fit observed SEDs of nearby galaxies to derive physical quantities (e.g., Dale et al. 2001; Dale & Helou 2002; Draine et al. 2007; da Cunha et al. 2008, 2010; Muñoz-Mateos et al. 2009; Małek et al. 2010).
The intensity of the cosmic infrared background radiation indicates that about half of the energy originally radiated from stars is eventually re-emitted from dust grains (Hauser & Dwek 2001). Heavily obscured star formation activity is difficult to detect by observations in ultraviolet/optical observations, and infrared/submillimeter observations should crucially be important to get the full picture of the formation and evolution of galaxies. In the last decade, our observational knowledge about the hidden side of galaxy evolution has significantly improved thanks to the advanced infrared/submillimeter facilities such as JCMT/SCUBA, Spitzer, AKARI, and Herschel. Moreover, the Atacama Large Millimeter/submillimeter Array (ALMA) will revolutionize our understanding of galaxy evolution in the near future. In order to extract useful information from these data, we need good theoretical understanding and models of galactic dust emission to be compared.
However, it is not straightforward to predict global (i.e., galactic-scale) SEDs of dust emission for a theoretical model galaxy, in contrast to direct stellar emission that can be calculated by the method of stellar population synthesis. This is because the physics determining the global SED of dust emission and its relations to other physical properties have remained highly elusive (see Walcher et al. 2011 for a review). An approach often taken in the literature (e.g., Guiderdoni et al. 1998; Takeuchi et al. 2001; Chary & Elbaz 2001; Lagache, Dole, & Puget 2003; Valiante et al. 2009) is to relate the SED parameter (e.g., the dust temperature ) to the total infrared luminosity, (defined as the bolometric luminosity of dust emission), based on the observed correlation between the two (higher for larger ; Soifer et al. 1987a; Soifer & Neugebauer 1991; Chapin et al. 2009). However, there is a large scatter along the mean - relation (see, e.g., Hwang et al. 2010 for recent data), and it is physically unreasonable to relate an extensive quantity that scales with the system size to an intensive quantity that does not (Totani & Takeuchi 2002). Extension of this relation including another parameter has also been discussed, e.g., galaxy size (Devereux 1987; Phillips & Disney 1988; Lehnert & Heckman 1996; Chanial et al. 2007; Rujopakarn et al. 2011a,b), but a consistent physical picture has not yet been established.
To make a completely theoretical prediction, one must solve transfer of dust heating radiation taking into account complicated geometry in a galaxy. Infrared SED models by such ab initio approaches have also been developed (Silva et al. 1998; Takagi et al. 2003a, b; Dopita et al. 2005), and applied to predict infrared SEDs in galaxy evolution models (Granato et al. 2000; Baugh et al. 2005; Fontanot et al. 2007). However, it is difficult to calculate detailed geometry within galaxies in models on the cosmological scale, and one must add many uncertain and adjustable model parameters, making it difficult to extract useful information from comparison with observed data.
Therefore it is still important to investigate the relation between infrared SEDs and various physical properties to find any correlation that would be useful to better understand the galactic-scale radiation from dust grains. The recently released catalogs of the AKARI All Sky Survey (Ishihara et al. 2010; Yamamura et al. 2010) for sources detected by the AKARI satellite (Murakami et al. 2007) provide us with a new opportunity to investigate nearby galaxies for this purpose. The Infrared Camera (IRC, Onaka et al. 2007) and the Far-Infrared Surveyer (FIS, Kawada et al. 2007) on board the satellite have detected more than and sources in 9–18 and 65–160 m bands, respectively. For recent studies on galaxies using samples based on these catalogs, see Takeuchi et al. (2010), Buat et al. (2011), Goto et al. (2011a, b), and Yuan et al. (2011).
Especially, the four FIS bands at 65–160 m should be very useful to accurately measure the modified blackbody peak of the dust emission SEDs, as they cover the wavelength range around the peak by a larger number of photometric bands with better flux sensitivity and angular resolution than those of the previous infrared all-sky survey by the Infrared Astronomical Satellite (IRAS, Soifer et al. 1987b). In this paper we perform SED fittings of physical dust models to the AKARI data of more than 1600 low-redshift galaxies, and compare the SED parameters with other physical properties of galaxies obtained by optical and 21-cm observations. The goal of this paper is to find the key physical quantities and laws to determine the global SEDs of dust emission (especially around the thermal peak), and give physical interpretations to them.
In §2 we describe the construction of the galaxy samples used in this work. The physical dust models and SED fittings to the AKARI data are described in §3. We then present theoretical background and considerations in §4, which will be used to interpret the results obtained in this work. The main results are presented in §5, followed by discussions in §6 and summary in §7. We adopt the standard cosmological parameters of , , and , though the choice of the cosmological parameters hardly affects our results based on galaxies at low redshifts.
2 The Samples
2.1 The AKARI All-Sky Survey
We use the AKARI/IRC All-Sky Survey Point Source Catalog (PSC, ver. 1.0) and the AKARI/FIS All-Sky Survey Bright Source Catalog (BSC, ver. 1.0), which were released in March 2010 including and sources, respectively. The IRC provides fluxes in two photometric bands, S9W and L18W, whose central wavelengths () are 9 and 18 m, respectively. The FIS provides fluxes in the four photometric bands of N60, WIDE-S, WIDE-L, and N160, whose central wavelengths are 65, 90, 140, and 160 m, respectively. The sensitivity limits corresponding to 50% detection completeness are shown in Table 1, and the relative spectral response functions (RSRFs) for the six bands are shown in Fig. 1. See the release notes of these catalogs available on the AKARI web site for more details.
Since the SED fitting is the central issue of this work, treatment of flux errors is important. In this work we consider only statistical flux errors associated with each flux measurements, and systematic errors that are common for all sources (e.g., flux calibration errors) are not taken into account. Systematic errors would result in systematic bias in SED fit parameters (e.g., a systematic shift of dust temperature), but it does not seriously affect the study of correlation or trend between the fit parameters and other galaxy properties. Statistical errors can be divided into two parts: one is the error that does not depend on source fluxes (denoted as ), and the other is the error that is proportional to flux (). The total flux error is assigned for a flux measurement in a band as:
| (1) |
For faint sources is dominant while is dominant for bright sources. The 1 values of and for each band are estimated from the signal-to-noise distributions presented in the release notes of the AKARI catalogs, and they are summarized in Table 1.
| instrument | IRC | FIS | |||||
|---|---|---|---|---|---|---|---|
| band name | S9W | L18W | N60 | WIDE-S | WIDE-L | N160 | |
| central wavelength [m] | 9 | 18 | 65 | 90 | 140 | 160 | |
| flux sensitivity∗ [Jy] | 0.09 | 0.17 | 2.6 | 0.39 | 2.9 | 5.9 | |
| [Jy] | 0.02 | 0.04 | 0.48 | 0.11 | 0.28 | 1.26 | |
| [%] | 5.6 | 6.7 | 10 | 10 | 10 | 10 | |
| PSF [arcsec FWHM] | 5.6 | 5.6 | 37 | 39 | 58 | 61 | |
∗The flux where the source detection completeness is 50%.

2.2 Cross-Matches with Optical and 21cm Data
We construct the following three samples by cross-matching the AKARI catalogs with the existing catalogs of nearby galaxies selected in other wavelengths. The first sample is the cross-match with the galaxies detected by the Sloan Degital Sky Survey (SDSS), and the second with the H\emissiontypeI Parkes All-Sky Survey (HIPASS) selected by 21-cm flux. We regard these as the two main samples in this paper, and we can check the dependence on the sample selection by these two. In addition, we construct the third sample to extend the dynamic range of surface density of star formation rate (SFR), which is the cross-match with the Kennicutt (1998, hereafter K98) sample of nearby circumnuclear starburst (SB) galaxies. The summary of constructing these samples, showing galaxy numbers at various stages of selections, is presented in Table 2.
| AKARI-SDSS | AKARI-HIPASS | AKARI-SB | |
| original catalog | 1145617 | 4315 | 36 |
| match with AKARI/FIS | 6500 | 1527 | 34 |
| FIS flux quality flag | 1138 | 840 | 33 |
| distance cut∗ | 996 | 711 | 32 |
| magnitude & size cut† | 878 | – | 31 |
| – | – | 24 | |
| final sample | 878 | 711 | 24 |
| stellar mass | 550 | 0 | 0 |
| star formation rate | 567 | 0 | 0 |
| metallicity | 246 | 0 | 0 |
| 534 | 0 | 0 | |
| H\emissiontypeI gas mass | 257 | 711 | 0 |
| H2 gas mass | 0 | 0 | 24 |
Notes. — The upper six rows show the numbers of galaxies after applying certain selection criteria in the process of constructing the samples. The lower six rows show the numbers of galaxies for which a certain physical quantity is available.
∗The condition of for AKARI-SDSS and AKARI-HIPASS, while or availability of redshift-independent distance is required for AKARI-SB.
†The condition of mag and is adopted for AKARI-SDSS, while a galaxy without diameter size in the K98 sample is excluded from AKARI-SB.
Physical quantities derived from SDSS optical spectra.
2.2.1 The AKARI-SDSS Sample
We first extracted a sample of SDSS galaxies having measured redshifts from the DR7 NYU Value-Added Galaxy Catalog (NYU-VAGC, Blanton et al. 2005). The information of apparent Petrosian magnitudes in the five bands, (Galactic) extinction- and -corrected absolute magnitudes, and -band Petrosian 90% angular radii that include 90% of Petrosian flux () will be used in the analyses of this work. We take from several size estimations available for SDSS galaxies, since this size is not sensitive to central concentration (Nair et al. 2010). The angular sizes are converted into physical radii as , where is the standard angular diameter distance to redshift .
These galaxies were cross-matched separately with the AKARI/IRC and AKARI/FIS catalogs, with the matching radius of 5 and 20 arcsec, respectively. The mean positional errors of sources in these catalogs are 0.8 and 6 arcsec, and essentially all objects should fall within the matching radii. [See also Table 1 for the instrumental point spread functions (PSF) in each band.] To avoid contamination of random associations, we removed any duplications, i.e., AKARI galaxies having more than two SDSS counterparts, and vice versa. We then obtained 390 and 6500 matches of SDSS galaxies with the IRC and FIS catalogs, respectively. The expected random associations are 25.1 and 143.7 for SDSS-IRC and SDSS-FIS, if the sources are uniformly distributed on the sky. These numbers are sufficiently small for studying the overall and statistical trends of galactic properties. Because the number of cross-matches with the IRC catalog is small, we construct the AKARI-SDSS sample based on the correlation between the SDSS and FIS catalogs, without requiring detection by IRC.
To keep good quality of the data, we further selected galaxies satisfying the following conditions: , mag, , and the AKARI/FIS flux quality flag111See the release note of the AKARI/FIS catalog for the definition of FQUAL. It is recommended not to use the flux data when FQUAL for a reliable scientific analysis. FQUAL in at least two FIS bands. The redshift condition is to remove too close objects whose redshift-based distance is rather uncertain by the peculiar velocity effect. The magnitude and size conditions are to keep good quality of size estimates and to make the seeing effect negligible. The condition for FQUAL is for reliable SED fittings. Then 878 galaxies qualified as the final AKARI-SDSS sample. The numbers of galaxies with FQUAL or 3 in each FIS band are shown in Table 3. This table shows that the 90- and 140-m bands are more sensitive than the other two bands and most galaxies are detected in these bands with FQUAL .
To these galaxies we added physical quantities derived from SDSS spectra by the MPA/JHU group when they are available, by cross-matching the spectroscopic ID [plate number, Mean Julian Date (MJD), and fiber number]. Stellar mass (, Kauffmann et al. 2003; Salim et al. 2007), SFR (, Brinchmann et al. 2004), and gas-phase metallicity (Tremonti et al. 2004) of the DR7 version are available for 550, 567, and 246 galaxies, respectively, in the total sample of the 878 galaxies. The metallicity is given in 12 + log10(O/H) in the original data, but in this work we use metallicity converted222 There are systematic uncertainties in estimates of , , and their solar values (Grevesse et al. 2010; Moustakas et al. 2010). We will mostly discuss correlations between metallicity and other physical parameters, and absolute uncertainty does not significantly affect our conclusions. from using and . We also added the band optical depth of stellar light attenuation by dust in galaxies, estimated by Tojeiro et al. (2009) using the VESPA algorithm (the one-parameter dust model in the RunID=1 catalog), to 534 galaxies.
We also added information of neutral hydrogen (H\emissiontypeI) mass from 21-cm observations in the literature. SDSS galaxies were cross-matched with the optical counterpart positions of 21-cm-detected galaxies in the data sets of Springob et al. (2005), the ALFALFA survey (Giovanelli et al. 2007; Kent et al. 2008; Stierwalt et al. 2009), the Equatorial Survey (Garcia-Appadoo et al. 2009; West et al. 2010), and the GALEX Arecibo SDSS Survey (Catinella et al. 2010). We found 257 H\emissiontypeI flux data available for the AKARI-SDSS sample, and calculated the H\emissiontypeI mass from the standard formula333The factor of arises as follows. The H\emissiontypeI mass can be written as , where is the observed frequency. In H\emissiontypeI observations, the velocity is defined as where GHz, and hence when the intrinsic velocity dispersion in a galaxy is much smaller than . :
| (2) |
where is the velocity-integrated flux density and is the standard luminosity distance. For comparison, we also constructed the SDSS-H\emissiontypeI sample, for all SDSS galaxies with available H\emissiontypeI data without requiring the detection by AKARI. Other selection criteria were kept same as the AKARI-SDSS sample. The SDSS-H\emissiontypeI sample consists of 2413 galaxies.
| FIS bands [m] | |||||
|---|---|---|---|---|---|
| sample | condition | 65 | 90 | 140 | 160 |
| AKARI-SDSS | FQUAL | 878 | 878 | 878 | 878 |
| FQUAL | 178 | 876 | 851 | 136 | |
| AKARI-HIPASS | FQUAL | 710 | 711 | 711 | 710 |
| FQUAL | 173 | 704 | 700 | 239 | |
| AKARI-SB | FQUAL | 24 | 24 | 24 | 24 |
| FQUAL | 21 | 22 | 24 | 23 | |
2.2.2 The AKARI-HIPASS Sample
Since the gas amount of galaxies is crucial for the dust amount, we also cross-correlated the AKARI galaxies with the HIPASS catalog (HICAT, Meyer et al. 2004), which is a catalog of galaxies selected by the H\emissiontypeI 21-cm line flux covering the entire southern sky. We selected HIPASS galaxies having optical counterparts from the HOPCAT catalog (Doyle et al. 2005), for which the information of 21-cm line flux, 21-cm redshift, optical magnitudes of , , and , and the major axis size of -band images are extracted from the catalog. The distances were calculated from 21-cm redshifts, and then was calculated from eq. (2). Absolute optical magnitudes were also calculated, correcting the Galactic extinction but ignoring -correction.
Then the HIPASS galaxies were cross-matched with the AKARI catalogs by the same procedures as those for the AKARI-SDSS sample. We found 161 and 1527 matches with the IRC and FIS catalogs, respectively. Following the AKARI-SDSS sample, we do not require detection by IRC for the AKARI-HIPASS sample. To keep good qualities, we further require the same criteria about redshift () and FIS quality flags (FQUAL at least in two FIS bands) as the AKARI-SDSS sample, resulting in the final AKARI-HIPASS sample of 711 galaxies.
Because the optical magnitude and size of HOPCAT are from photographic plates, their quality and reliability should carefully be examined. To directly compare the AKARI-SDSS and AKARI-HIPASS samples, we converted the HOPCAT magnitude () and size () into those in the SDSS catalog ( magnitude and ), and will use these in the following analyses. For this conversion, we first searched for galaxies that are common in SDSS and HOPCAT by optical positions, and found 103 galaxies that satisfy the same criteria as the AKARI-SDSS galaxies about redshift, magnitude, and size. In these galaxies 47 are detected by AKARI/FIS. From comparison between SDSS and HOPCAT bands, we apply the following conversion: , and the dispersion around this relation is 0.46 mag. Figure 2 shows the comparison between the SDSS size and the HOPCAT size , and the ratio systematically varies with . We therefore convert the HOPCAT size into by the following equation:
| (3) |
which is shown in Fig. 2 by the solid line.

2.2.3 The AKARI-SB Sample

The AKARI/FIS catalog was cross-matched with the 36 galaxies of the K98 circumnuclear starburst sample by the same procedures as the two samples described above, and we found that 34 galaxies are detected by FIS. To keep the quality of the data, we again adopt the same condition about the FIS flux quality flags. For these galaxies we collected the redshift-independent distance measurements from the NASA Extragalactic Data base (NED), and adopted the mean value when more than one measurements are available for a galaxy. For galaxies that do not have a redshift-independent distance measurement, we calculated the distances from redshifts, but NGC 5194 was removed from the sample because . We will use the information of the angular diameter size , SFR surface density , and H2 gas mass surface density given in K98. Here, NGC 3256 was removed because is unavailable.
In K98, SFR and H2 mass were estimated from and CO line luminosity, respectively. As argued in K98, is a good SFR indicator for these starburst galaxies because is dominated by young stars and dust opacity is large. The SFR- conversion factor of K98 assumes the Salpeter (1955) initial mass function (IMF), and we divided K98 SFRs by 1.5 to match the SFRs in the AKARI-SDSS sample assuming the Kroupa (2001) IMF (Brinchmann et al. 2004). In this case the SFR (denoted as ) is related to as:
| (4) |
It should be noted that in this work this relation is used only for the AKARI-SB sample; we do not use as a SFR indicator for the AKARI-SDSS or AKARI-HIPASS samples, because a significant fraction of comes from dust heating by relatively aged stars (see §5.1). SFRs from SDSS spectra will be used for the AKARI-SDSS sample.
The surface densities ( and ) given in K98 are converted into the total quantities ( and ), e.g., , where is the physical radius of circumnuclear starburst regions. Note that the “total” quantities in the AKARI-SB sample are the total within the circumnuclear starburst regions rather than the entire galaxies. Since the AKARI photometries are for the whole region of galaxies, we must examine whether the AKARI fluxes are mostly coming from the circumnuclear regions. For this purpose, we compared the total infrared luminosity from a circumnuclear region, , of the K98 sample (calculated from and ) with for the entire galaxy newly obtained by our SED fit to the AKARI data (see §3), in Fig. 3. It can be seen that many galaxies have , indicating that the total infrared luminosities of galaxies are dominated by those from circumnuclear starburst regions. We adopted the condition of for our sample, to remove galaxies whose infrared luminosity is mostly emitted from outer regions. Then finally we obtained the AKARI-SB sample consisting of 24 galaxies.
2.3 The Basic Properties of the Sample Galaxies
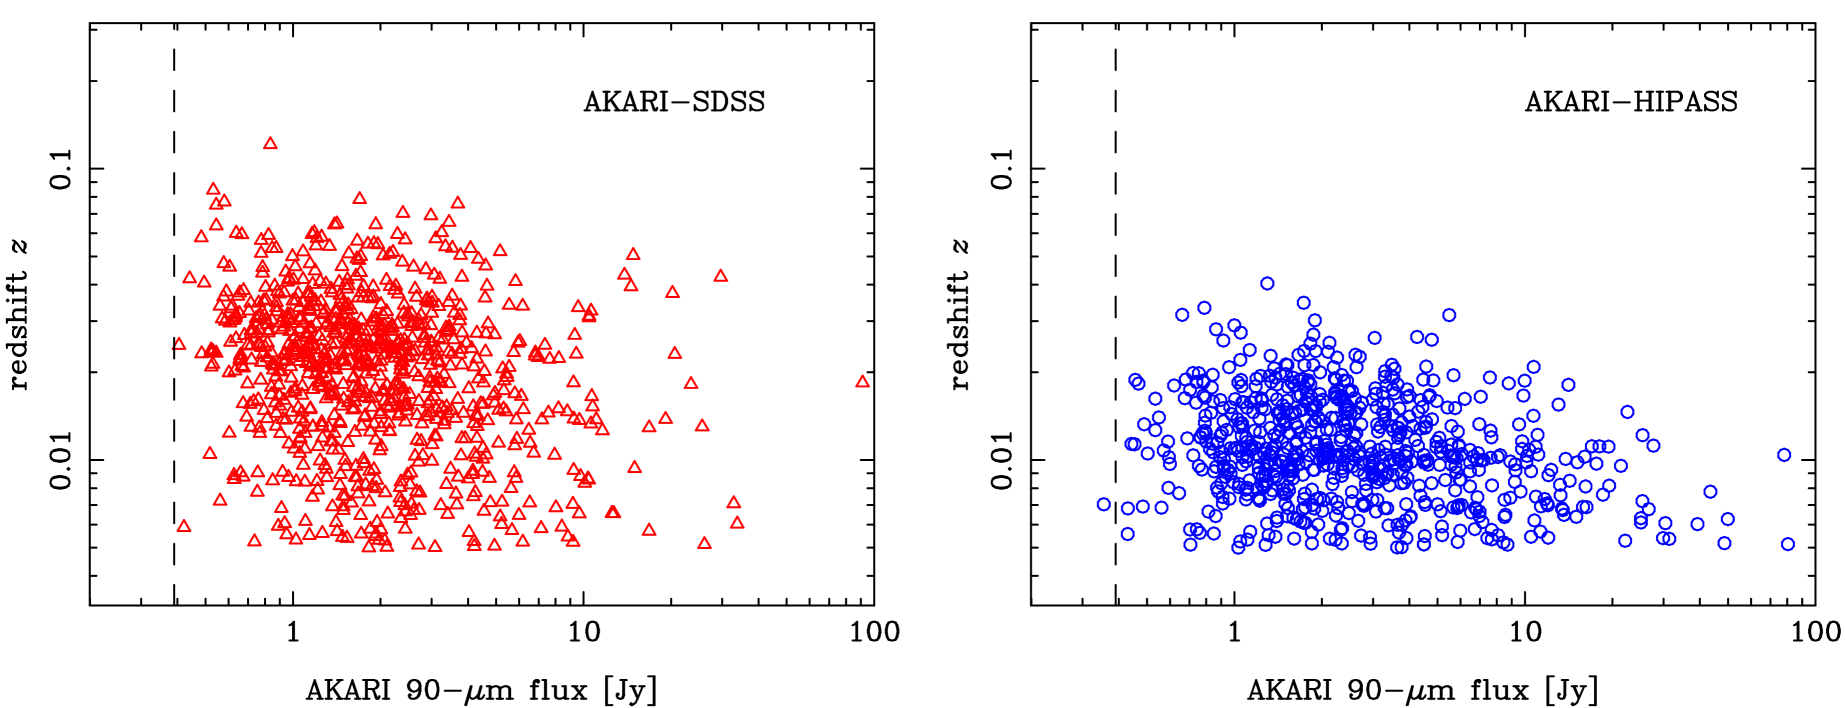
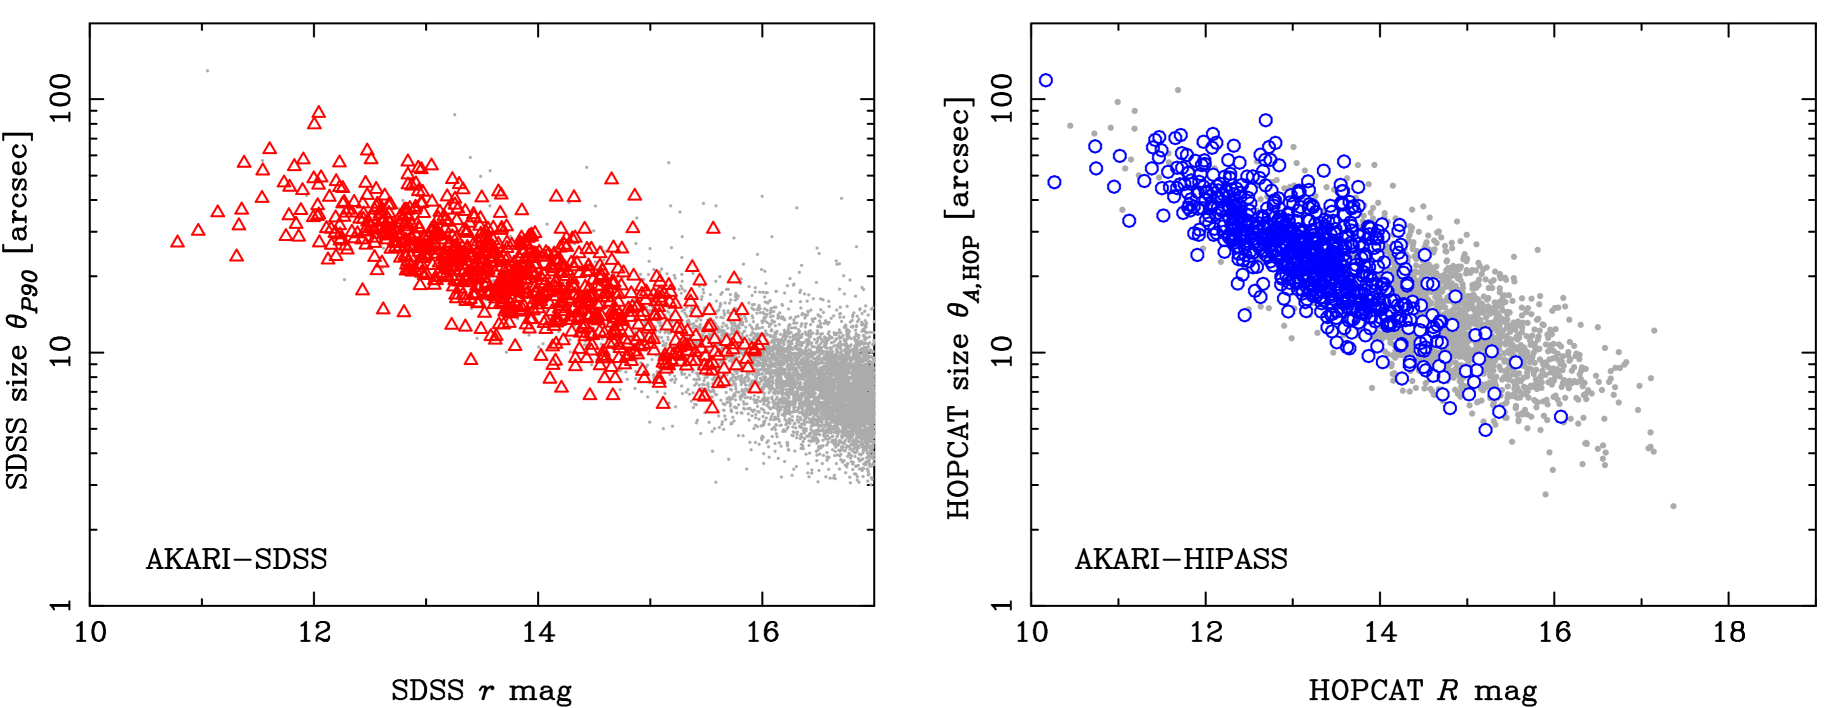
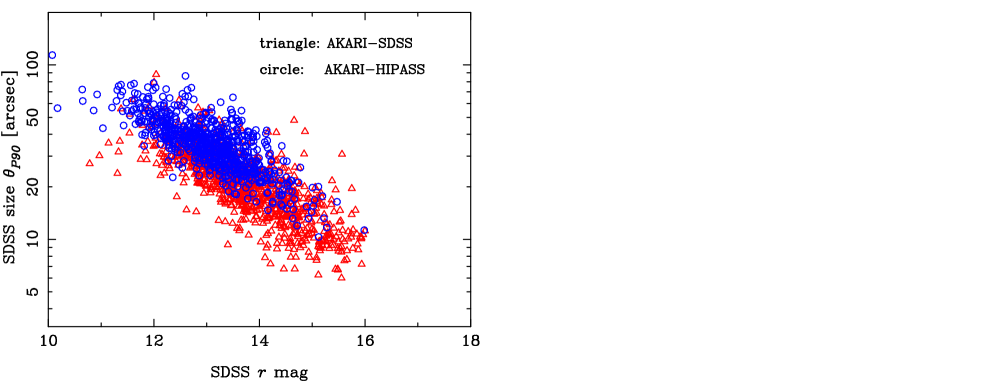
Figure 4 shows redshift versus the AKARI 90-m flux for the final AKARI-SDSS and AKARI-HIPASS samples. The sensitivity of the 90-m band is the best among the four FIS bands. Sources are distributed down to the flux sensitivity limit, but the mean flux is considerably brighter than the flux distribution of all FIS-BSC sources reported in the release note, because we have set the condition of FQUAL at least in two FIS bands. The mean redshift of the AKARI-SDSS sample () is slightly higher than that of the AKARI-HIPASS sample ().
Figure 5 shows angular size versus apparent optical magnitude ( for SDSS and for HIPASS). Compared with the typical SDSS magnitudes, the AKARI-SDSS galaxies are much brighter, indicating that the AKARI sensitivity limit is brighter than SDSS for typical galaxy SEDs. In Fig. 6, we show the size-magnitude plot of the AKARI-HIPASS galaxies when the magnitude and are converted into and , in comparison with the AKARI-SDSS galaxies. The distributions of the two samples are similar, indicating that the conversion of magnitude and size is working well.
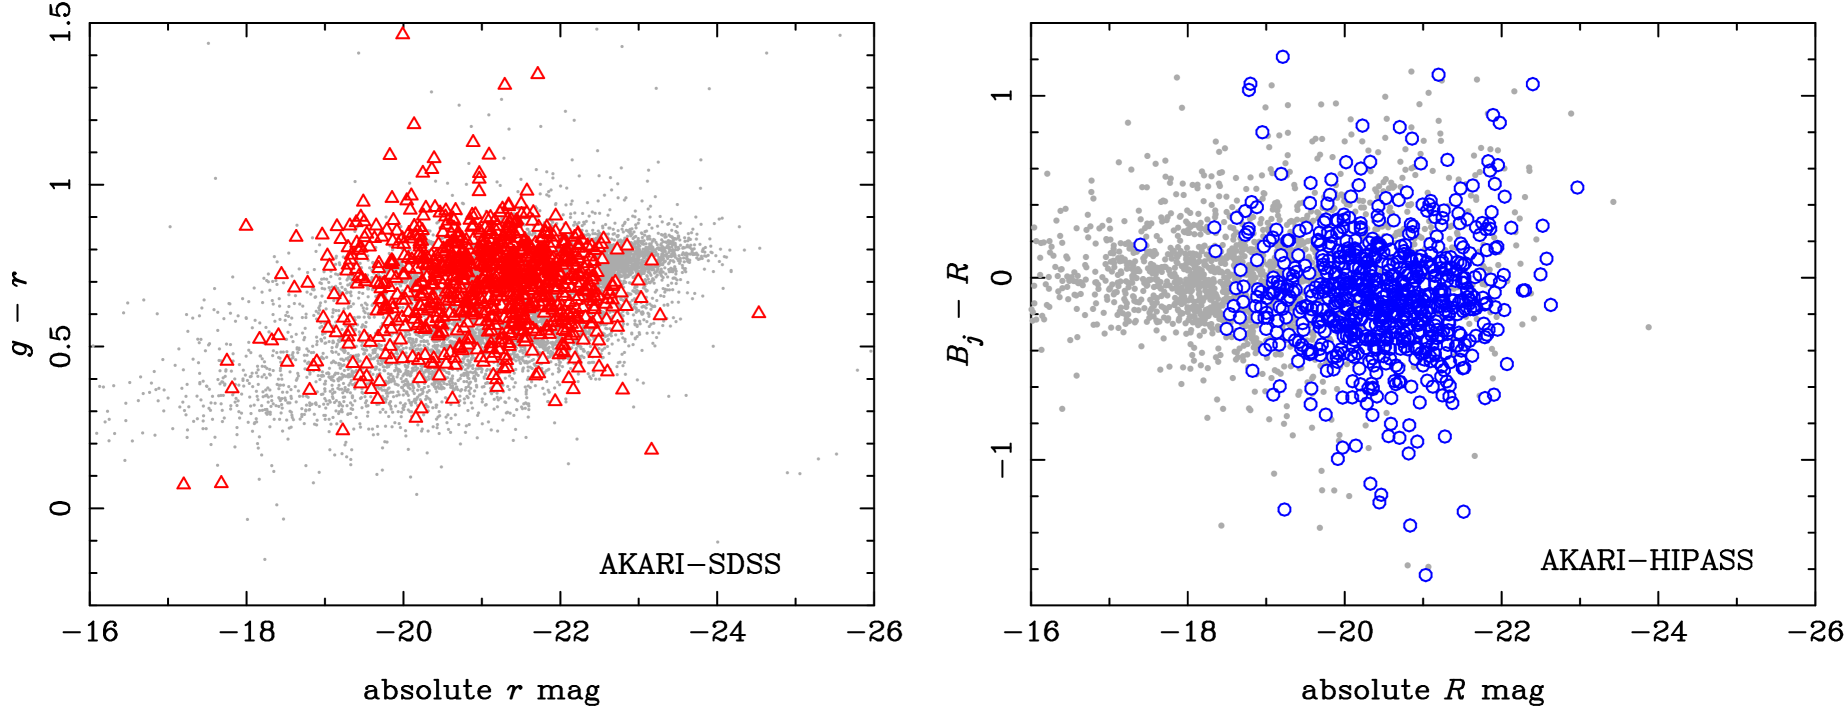
Figure 7 shows the optical color versus absolute magnitude relation (see also Takeuchi et al. 2010). Our samples cover a wide range of galaxy colors, though the AKARI-SDSS galaxies have a slightly redder mean color than the mean SDSS distribution, indicating that we are sampling dusty galaxies. Red and brightest SDSS galaxies are not detected by AKARI, because they are early-type red-sequence galaxies with no or low star formation activity.
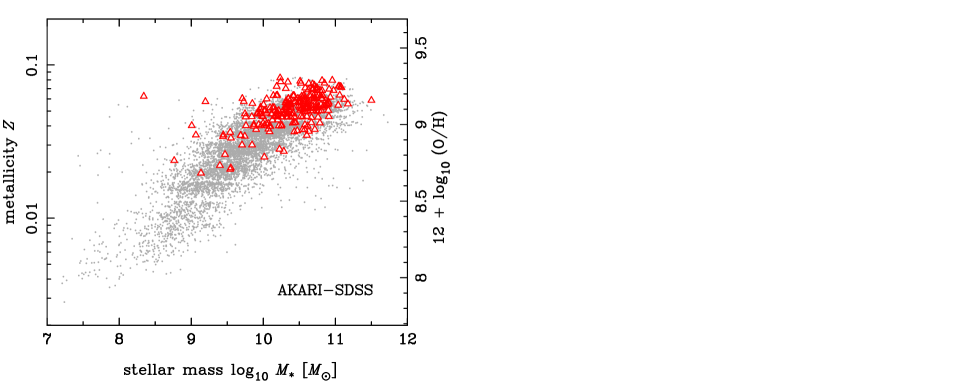
Figure 8 shows the stellar mass () versus metallicity relation of the AKARI-SDSS sample, which indicates that we are sampling relatively massive and high metallicity galaxies compared with general SDSS galaxies. This is reasonable for our samples limited by the AKARI sensitivity, because massive star-forming galaxies are generally dusty and high metallicity is required for a large amount of dust.
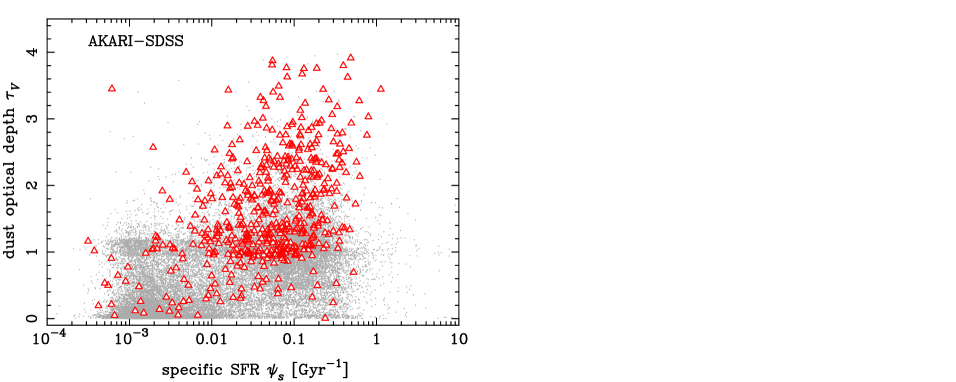
Figure 9 shows band attenuation versus specific star formation rate (SSFR) for the AKARI-SDSS sample (see also Takeuchi et al. 2010). The SDSS galaxies without AKARI detection are bimodally distributed in SSFR reflecting the well known populations of the red sequence and the blue cloud (e.g., Strateva et al. 2001; Bell et al. 2004). The AKARI-detected galaxies are distributed in the high SSFR and high region, in agreement with the general expectation that recent star formation and a large dust optical depth are necessary for a galaxy to be bright in far-infrared wavelength. However, our sample covers a wide range of SSFR and , indicating that it includes galaxies having a wide range of star formation history and dust opacity.
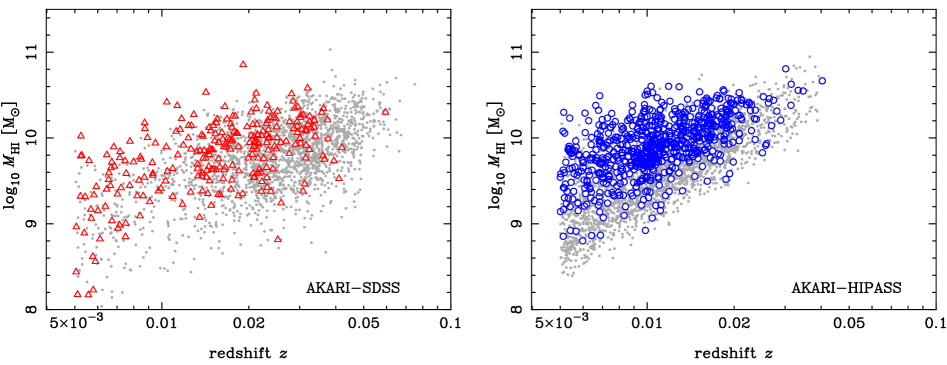
Finally Figure 10 shows versus redshift for the AKARI-SDSS and AKARI-HIPASS samples. The HIPASS catalog is limited by H\emissiontypeI flux, and this can clearly be seen in the - relation in the right panel. The effect of H\emissiontypeI flux sensitivity limit is also seen for the AKARI-SDSS sample, though it is less clear because of the heterogeneous flux limits of the H\emissiontypeI data in the literature. Galaxies detected by AKARI have higher H\emissiontypeI mass on average at a fixed redshift than those without AKARI-detection, and hence the AKARI sensitivity limit is also important for these samples.
3 Fitting Physical Dust Models to Infrared SEDs
3.1 The Physical Dust Models
We mainly use the physical dust model of Draine & Li (2007, hereafter DL07) to derive physical quantities about dust emission (see also Weingartner & Draine 2001; Li & Draine 2001). To reduce the number of model parameters, we choose the model of DL07 for the Milky Way (MW) that has the PAH mass fraction of , because this PAH fraction is close to the median of nearby galaxies studied by Draine et al. (2007). The normalization of the DL07 model is determined by the hydrogen mass , assuming the dust-to-hydrogen mass ratio of , but likely depends on properties of galaxies, especially metallicity. Therefore in this work we quote the dust mass as the normalization parameter in the SED fitting, rather than the hydrogen mass. The dust mass inferred from infrared SED fittings is denoted by , to make a distinction from the total dust mass in a galaxy potentially including cold dust that is not heated by radiation and hence not contributing to infrared emission.
The basic parameter of infrared emission in the physical dust model is the heating radiation field strength, , which is the dimensionless energy density of dust-heating radiation normalized by the local value of the interstellar radiation field (ISRF) around the solar neighbourhood. In reality, the field strength can be different at different locations in a galaxy, and model infrared emission is often calculated considering the dust mass distribution as a function of (Dale et al. 2001; Dale & Helou 2002; DL07). However, the functional form of is highly uncertain, making it difficult to interpret the results of infrared SED fittings in a model-independent way.
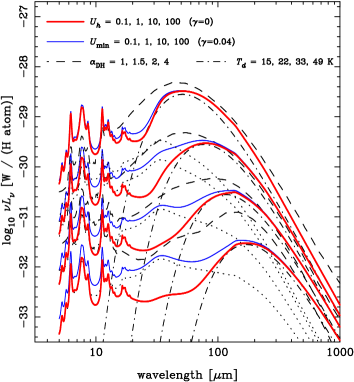
Here we take a different approach by assuming that infrared emission from a galaxy can be described by a single characteristic heating radiation strength, . Although it may be difficult to fit observed infrared SEDs in a wide wavelength range from near- to far-infrared by a single value of , in this work we concentrate on the fitting in a relatively narrow range of wavelength covered by AKARI/FIS (65–160 m), corresponding to the broad SED peak of modified blackbody. Therefore, in this work should be regarded as the characteristic value for large grains contributing to the thermal emission. An advantage of this approach is that physical discussion based on the radiation field strength becomes easier. The SEDs of the single- DL07 model for several values of are plotted in Fig. 11.
It would be convenient to compare the SEDs of the physical dust model with the modified blackbody spectra often used in the literature. It is known that SEDs around the thermal peak can be approximated by a modified blackbody444In the astronomical literature, this is also often referred to as “greybody”, but we avoid this word because strictly it is defined as emission with a constant emissivity less than one against wavelength. with the emissivity index of 1–2, i.e., flux density per unit frequency , where is the blackbody spectrum of temperature and is the emissivity of dust particles (e.g. Dunne et al. 2000; Kovács et al. 2006). The total infrared luminosity of the modified blackbody scales as , and the peak scales as . Since for a fixed dust mass, we expect . The relation between and of the DL07 model implies , and for this value the modified blackbody with = 15, 22, 33, and 49 K has the same as the single- DL07 model of 0.1, 1, 10, and 100, respectively. These spectra are also plotted in Fig. 11.
3.2 Fitting to the AKARI/FIS Data
Because the number of galaxies detected by IRC is small and we concentrate on for the broad thermal peak in SEDs, we use only the four AKARI/FIS bands in the SED fits. For a galaxy whose energy flux per unit frequency is , the -th FIS band flux quoted in the FIS-BSC catalog (in units of Jy) is calculated as
| (5) |
where is the frequency in the observer’s frame, is the band width
| (6) |
is the central frequency of the band given in Table 1, and is RSRF against energy flux for each AKARI band shown in Fig. 1. The band width is defined so that when is constant. The observed energy flux is related to luminosity of the DL07 model per unit rest-frame frequency at a redshift as
| (7) |
where the rest-frame frequency is .
Then the best-fit values of and are calculated by the standard minimization, i.e.,
| (8) |
where the summation is over the four FIS bands. When the flux measurement is not reported for a FIS band in the FIS-BSC catalog, this band was not used in the fitting. The number of the FIS bands used for a fitting to a galaxy is denoted by , and because of our requirement of FQUAL at least in two of the four FIS bands, . There are 3, 44, and 831 galaxies having –4 for the AKARI-SDSS sample and 4, 33, and 674 for the AKARI-HIPASS sample, respectively. The range of covered in the fittings is , where the lower bound is limited by the available model library, and the upper bound is large enough because we found no galaxies having . There are 20 and 24 galaxies whose best-fit is 0.1 (the lower bound of the model) for the AKARI-SDSS and AKARI-HIPASS samples, respectively, and the following statistical analyses are not significantly affected by these small number of galaxies. The total infrared luminosity is then calculated as the bolometric luminosity of the dust emission from the best-fit SED model.
The error for was calculated for each galaxy by the range corresponding to from the minimum, taking the best-fit normalization (i.e., ) for each value of . The errors of and are correlated with , and we estimated them as follows. For a fixed value of , the error for the normalization factor can be estimated as (see, e.g., Press et al. 2007)
| (9) |
In addition, to take into account the error correlated with , we calculated the change of best-fit and values when is changed from the best-fit value by . Then the quadratic sum of these two types of errors was calculated as the final error for and . We found that the mean errors of and are both for the AKARI-SDSS and AKARI-HIPASS samples, and that for is smaller than these by a factor of about four. The error of is small because it is directly connected to the observed fluxes, while and have similar fractional uncertainties about the SED shape by the relation .
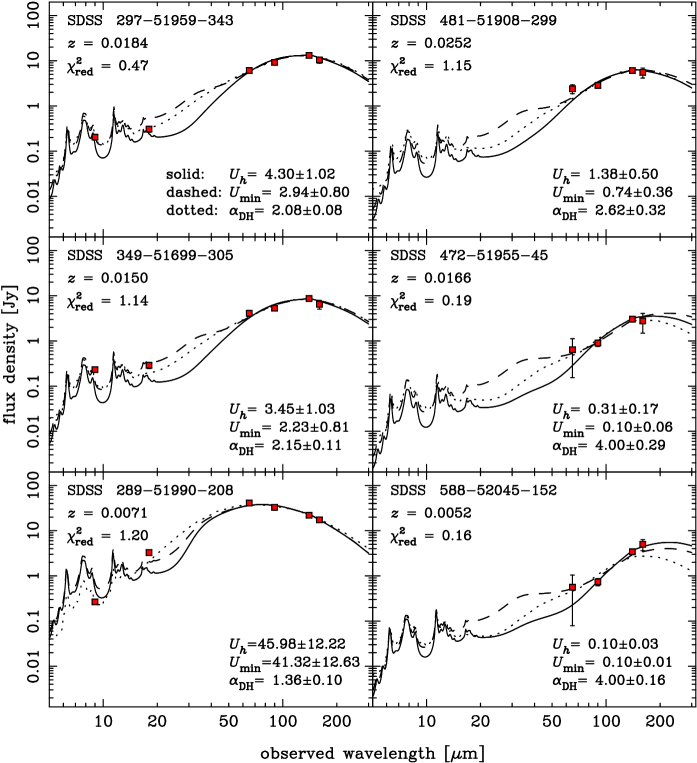
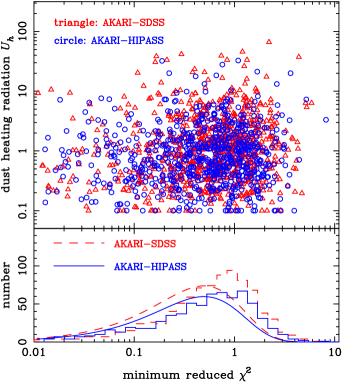
Six examples of the fittings to the AKARI-SDSS galaxies are shown in Fig. 12. The distributions of and the minimum reduced chi-square, for galaxies are shown in Fig. 13, where the degree of freedom is for the two-parameter fittings. Theoretical expectations of the distribution (weighted sum of those for and 4) are also shown. The observed distribution is larger than the ideal theoretical prediction by a factor of 1.5, but we consider that this is not unreasonable, if we take into account the possible systematic errors in the AKARI flux calibration and/or the possible difference of the single- DL07 model from the reality.
3.3 Models versus Observations in the IRC Bands
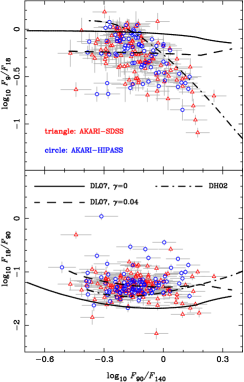
In this paper we will concentrate on the SED parameter determined by fits to the AKARI/FIS bands, but it would also be interesting to compare the observed AKARI/IRC fluxes with those predicted by the physical dust models. This is done in Fig. 14, where we show the flux ratios of and against , where denotes the AKARI photometric flux of the -m band. Here we have used galaxies with the AKARI/FIS flux quality flag FQUAL both in the 90- and 140-m bands from the AKARI-SDSS and AKARI-HIPASS samples. The ratio of can be regarded as an indicator of the dust temperature or . The solid curves are the path along predicted by the single- DL07 model, and the prediction for is lower than the mean of the observed distribution by a factor of about two. This is reasonable because mid-infrared emission is likely dominated by dust grains in regions of stronger heating radiation field, and we must incorporate the diversity of to fit SEDs in a wide wavelength range. Here we adopt two such SED models.
One is the physical dust model by Dale & Helou (2002, hereafter DH02), which introduces a power-law distribution of radiation strength as
| (10) |
and the path along predicted by this model is shown in Fig. 14. The values of , and 1 roughly correspond to , and 100 of the single- DL07 model, respectively, in our SED fits to the four FIS bands. This model shows a better agreement with the data than the single- DL07 model, demonstrating the necessity of including a small amount of large dust component. On the other hand, the data show dispersions by about one order of magnitude in both the flux ratios of and , indicating the limitation of one-parameter-family SED models. The SEDs of the DH02 model are also shown in Figs. 11 and 12.
The other model is DL07 using a form of proposed by DL07, which introduces a power-law distribution of in the range of for a fraction of the total dust mass, in addition to the single- component with , i.e.,
| (11) | |||||
The power-law component is called as the PDR component as it represents the hot dust in photodissociation regions (PDRs) close to young massive stars. We adopt and for the PDR component following Draine et al. (2007), and now we have another model parameter in addition to . (The model has yet another degree of freedom about the PAH fraction by the model parameter , but we keep to reduce the parameter space to explore.) The PDR component models are available only for , and we use the template for the PDR component when . We calculated the path along in the plane of versus and for various values of , and found that gives the median of the observed distribution, as shown in Fig. 14. This value is close to the typical value found by Drain et al. (2007) for nearby galaxies, though there is a significant scatter of . The SED model curves of the model are also shown in Figs. 11 and 12.
Although the model is better than the single- model (i.e., ) to reproduce the observed IRC fluxes, we will use the latter in the analyses below because of the following reasons. First of all, we want to estimate the characteristic radiation field strength responsible for the emission around the thermal peak from large dust grains, and introducing the PDR component in a model-dependent way may induce some bias in the estimates of . The model produces a feature around 30 m because of the rather arbitrary parameter of , when is small. The best-fit values of the model tend to be smaller than of the model (see Fig. 12), and we found that a considerable number of galaxies have the lowest value of provided in the model library. The number of such galaxies can be minimized by using the model. Finally, it should also be noted that the deficit of the predicted IRC-band flux by the model is at most a factor of two compared with the mean observed flux.
4 Theoretical Considerations
Before we compare the infrared SED parameters with other physical quantities of galaxies, we describe the general theoretical expectations. The basic assumptions here are that dust and heating radiation sources are uniformly distributed on a disk (but possibly with different scale heights). This picture is obviously simple, and allowed only when the infrared SED is determined mostly by the general ISRF on the global scale in a galaxy, rather than those associated with small scale structures like individual star forming regions. However, rather surprisingly, we will find that this simple picture gives reasonable explanations for most of the data presented in the paper, and more geometrically complex models are not warranted.
4.1 Basic Equations of Emission from Dust
The infrared SED depends on the heating radiation field strength felt by dust particles, which is defined by the energy density or energy flux per unit frequency, and these two are simply related as , where is the speed of light. The radiation field can be anisotropic, but anisotropy does not affect the infrared emission from heated dust, and these quantities are defined as those integrated over steradians. In this work we do not consider the variation of the SED of the heating radiation field, and use the same parameter introduced in §3, which is a dimensionless field strength normalized by the local strength of the Milky Way ISRF around the solar neighbourhood, i.e., and .
When dust particles of total mass are exposed to a heating radiation field strength and emitting in a stationary state (a good approximation in the AKARI/FIS bands), the bolometric luminosity emitted from these particles is given by the energy balance with the total energy absorbed by dust grains, as
| (12) | |||||
| (13) |
where is the dust mass opacity coefficient (absorption cross section per unit mass of dust grains, see, e.g., Hildebrand 1983; Dunne et al. 2003). If we define the frequency-integrated effective dust mass opacity weighted by , as
| (14) |
we obtain
| (15) |
where is the bolometric intensity of the local ISRF, for which we adopt the value of Mathis et al. (1983): in 0–13.6 eV (see also Draine et al. 2007). We can calculate for the physical dust model of DL07 from eq. (15), which is found to be . In astronomically convenient units, this can also be written as
| (16) |
Now, adopting the disk geometry, we define the global infrared radiation field strength of a galaxy by
| (17) |
where is the characteristic disk radius of a galaxy, and the dust mass column density of a galactic disk is defined as . In this work we use the 90% Petrosian radius as for the AKARI-SDSS and AKARI-HIPASS samples, which includes most of the total luminosity from a galaxy. For the AKARI-SB galaxies, we use the size of circumnuclear starburst regions given in K98. The factor of 1/2 is introduced to approximately account for the disk geometry where the radiation is emitted into the two sides of the disk. The quantity has the same physical dimension as the heating radiation field , and we expect some relation between the two if the infrared emission is mainly determined by the global properties of a galaxy. To directly compare with the dimensionless strength , we normalize as
| (18) |
The effective optical depth of dust, corresponding to the light travel distance , is defined as , where is the spatial mass density of dust in ISM. The optical depth is related to dust mass column density and band extinction as:
| (19) |
where and we have used the relation between and hydrogen column density, , for the DL07 physical dust model. We also introduce the total optical depth of the disk, which is defined as
| (20) |
where is the total dust mass in a galaxy, , and we have defined the critical dust mass column density for which . The factor 1/2 has been introduced because, on average, radiation from heating sources passes through about half of the total column density of the dust disk. It should be noted that here we make a distinction between (heated dust mass estimated from infrared emission) and the total dust amount in a galaxy. Generally (or ) can be smaller than (or ), if only a fraction of dust particles are radiated by strong radiation field. The total disk optical depth is defined by rather than . Then we have
| (21) |
This is an important equation that will be used to interpret the observed data in this work.
4.2 Scalings among , , , and
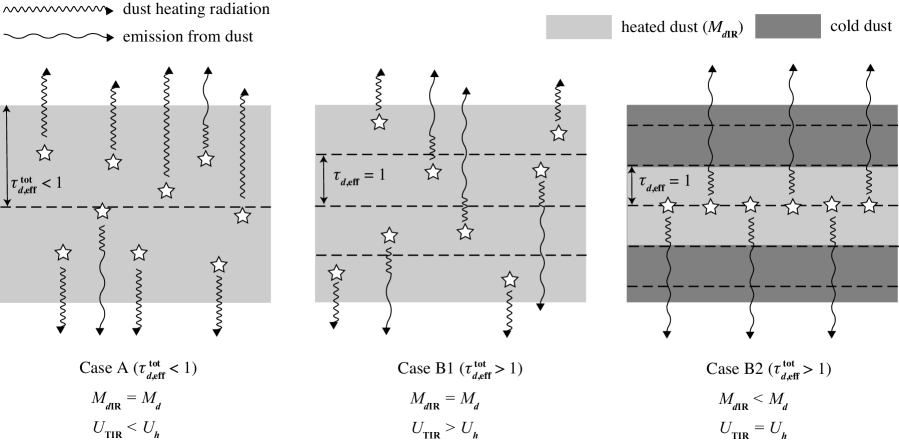
Eq. (21) is a generic equation, but we can consider some limiting cases with simple scaling laws, corresponding to a particular geometrical distribution of dust and heating sources. The schematic picture to explain these cases is given in Fig. 15.
First we consider the case of small optical depth, (hereafter the case A). In this case the heating radiation field strength should be , where is the bolometric luminosity of heating radiation from all sources in a galaxy. This field strength is relevant for all dust particles in a galaxy, and hence , while only a small fraction of the heating radiation energy is absorbed and converted into the infrared emission, i.e., .
In the opposite limit of large optical depth (), most of heating radiation will be converted into infrared emission, and hence and (hereafter the case B). We can further consider two very different limiting cases about the relative distributions of dust and heating sources. The first case is when dust particles have a similar disk scale height as the heating sources. Then all the dust particles in the disk contribute in the same way to the infrared emission, i.e., . Then eq. (21) tells us , i.e., , meaning that the heating radiation strength felt by dust particles () is smaller than by a factor of . This is because the heating photons are substantially absorbed after traveling through a distance corresponding to , and only a fraction () of total heating radiation produced in the disk reaches a dust particle. We call this as the case B1.
Another optically thick case is when the disk scale height of heating sources is smaller than that of dust particles. As a simple example, we assume that the scale height of heating sources is negligibly small, so that the dust disk behaves like an optically thick screen. Then the radiation field strength at regions close to the heating sources should be , i.e., . Then eq. (21) requires
| (22) |
meaning that only a fraction () of dust particles are heated by the radiation, because the radiation field is significantly damped after traveling through a distance corresponding to . Infrared emission is mostly from the dust in the thin layer corresponding to around the heating sources. Then it is predicted that the column density of heated dust is constant at , regardless of the total dust column density . We call this as the case B2.
Note that and can be realized simultaneously only when .
5 Results and Interpretation
Here we present the main results of this work, i.e., the correlation between infrared SEDs and various physical properties of galaxies. The results will be interpreted by the theoretical background described in the previous section.
5.1 Infrared Luminosity versus Optical Luminosity and SFR
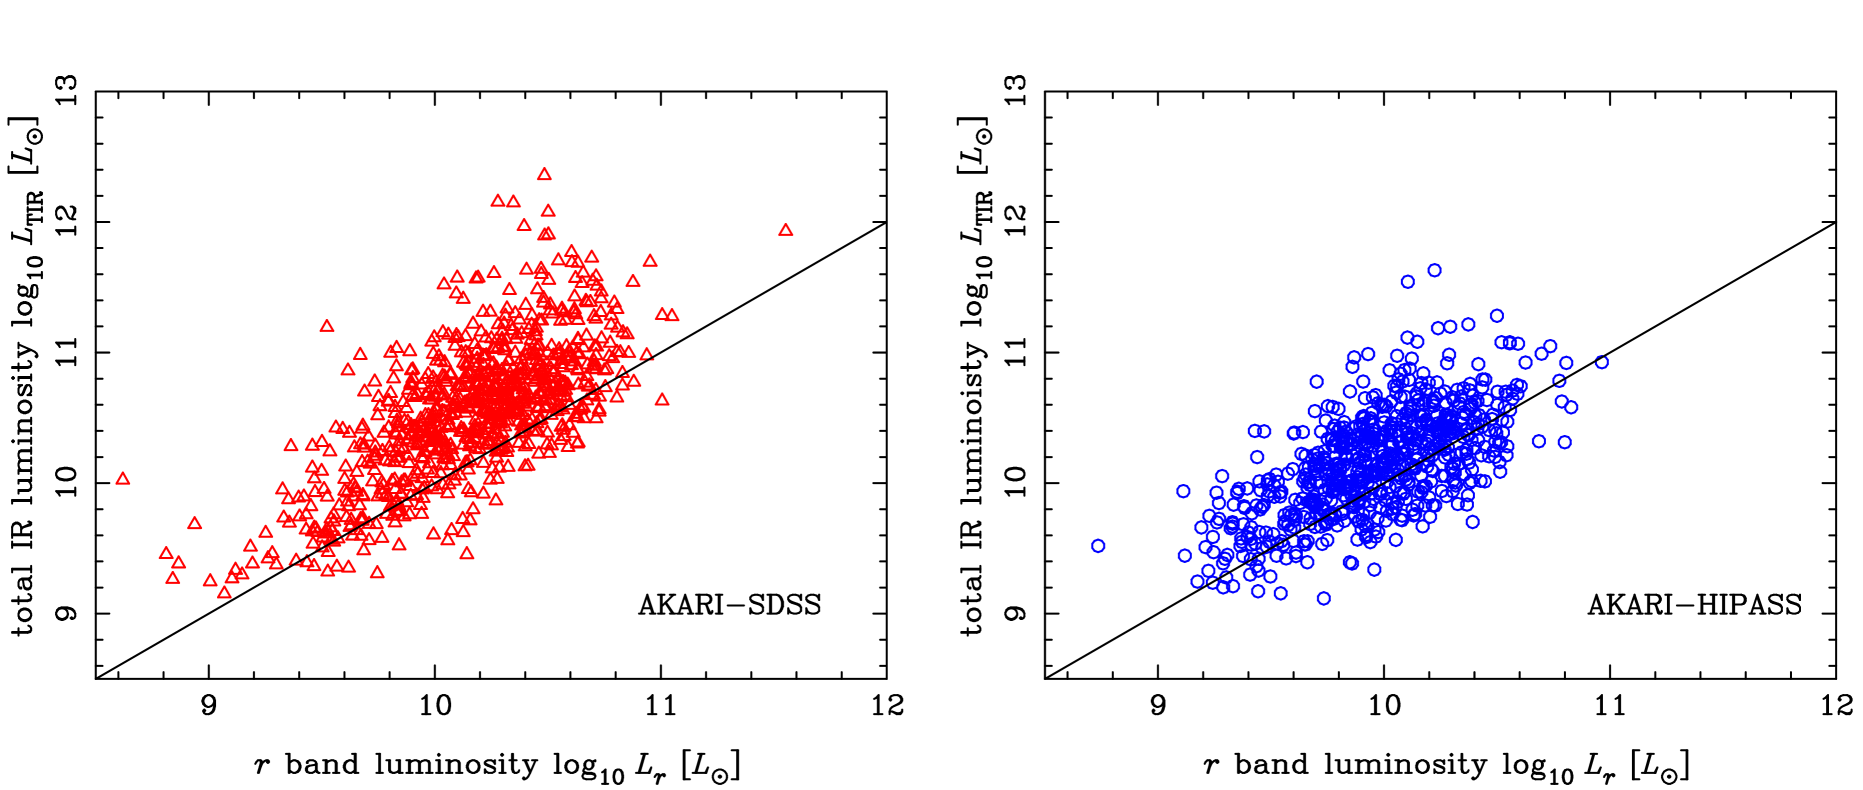
First we compare the infrared luminosity with the optical luminosity, to examine the dust opacity . Figure 16 shows the correlation between and the optical -band luminosity ( at rest-frame 6231 Å). We find for most galaxies, indicating that energy output by dust emission is similar to, or larger than that by the direct stellar emission. It may indicate that most galaxies have , but we can derive this conclusion only if the ratio is determined by the global properties of galaxies, because has been defined as the mean dust column density on a galactic scale. Instead, the ratio may be determined by the properties of local star forming regions in a galaxy. We will find that the former interpretation, , is indeed appropriate for the galaxies studied here.
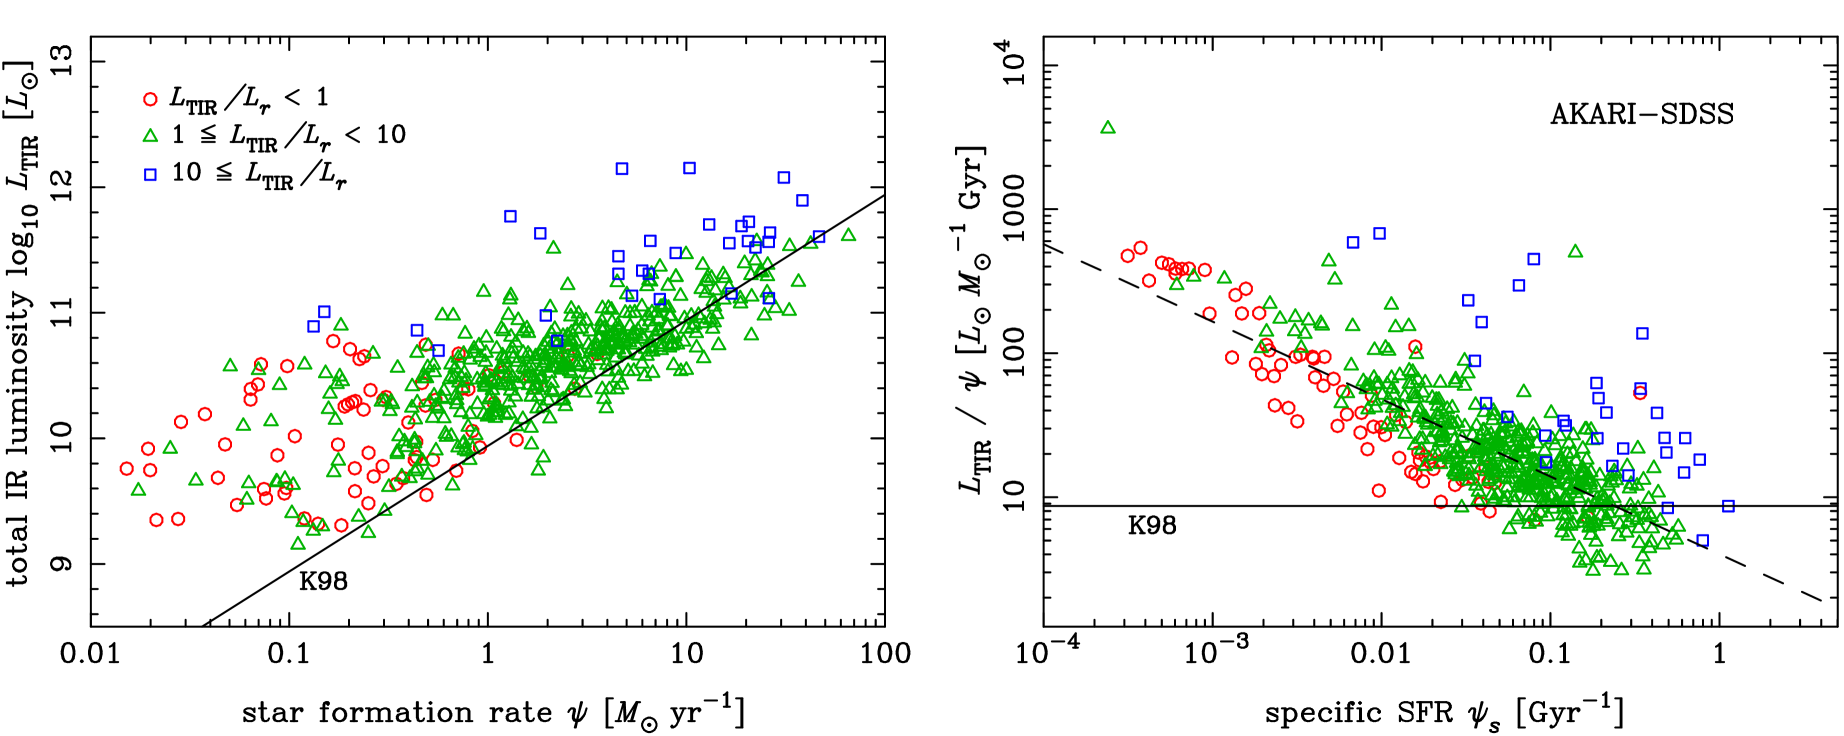
Next we examine the correlation between and SFR (, estimated from SDSS spectra) of the AKARI-SDSS sample, shown in the left panel of Figure 17, to examine the origin of dust heating radiation. The total infrared luminosity is often used as a SFR indicator by eq. (4), and its validity and limitation have been discussed in the literature (e.g., Takeuchi et al. 2005, Salim et al. 2009; Boquien et al. 2010; Goto et al. 2011b). It cannot be a good SFR indicator when star formation activity is low and dust heating radiation is significantly contributed from relatively aged stars. This trend is clearly seen in this figure; increases with decreasing SFR. The solid line is the ratio of eq. (4), which is the value expected when the dust heating radiation is dominated by young stellar populations with ages of 10–100 Myr (Kennicutt 1998, converted to the Kroupa IMF here). This ratio is observed only for high SFR galaxies. Different symbols are used in this figure for different ranges of , and the trend of larger for larger SFR can be seen, in agreement with the well-known fact that actively star-forming galaxies are generally dusty.
Since SSFR () is a good measure of relative abundances of young and old stellar populations, we expect that is tightly correlated with SSFR. This is indeed seen in the right panel of Figure 17, especially for galaxies having . On the other hand, dusty galaxies having deviate from the correlation showing particularly high , and this is most likely explained by the hidden activity of star formation that cannot be captured by optical emission because of large extinction. The tight correlation of galaxies with can be fit as
| (23) |
This result indicates that SSFR can be used as an indicator of contribution from young stellar population to dust-heating radiation. The infrared luminosity can be used as a simple SFR indicator only for actively star-forming galaxies of , while for other galaxies relatively aged stars significantly contribute to the dust-heating radiation. The tight versus correlation may be useful for parameter estimations for observed galaxies, because if two of the three parameters (, SFR, and ) are known, the remaining parameter can be deduced by solving the - relation. For example, if one knows and from observations, SFR can be solved from this relation, which should be a better estimation than simply using eq. (4).
5.2 Infrared SED versus Infrared Luminosity and SSFR
Figure 18 shows the correlation between and , for the AKARI-SDSS and AKARI-HIPASS samples. As mentioned in §1, the correlation between the two (larger for larger ) is widely known, and the trend is also confirmed for both the two samples studied here. However, there is a considerable scatter and it is difficult to predict with a good accuracy only by the information of . Furthermore, we find a significant offset of the mean relation between the two sample. Since the AKARI-SDSS galaxies are more distant, their mean is larger than that of the AKARI-HIPASS galaxies, but the distribution of is not significantly different. This indicates that the - or - relation is sensitive to the sample selections.
Figure 19 shows the correlation between and of the DH02 model fits. It is interesting to compare the distribution of our samples with that of the IRAS 1.2 Jy sample (Fisher et al. 1995). Converting the distribution of flux ratio of this sample given in Chapman et al. (2003) into using the relation in Table 2 of Dale et al. (2001)555 Here we ignored the -correction, which is a good approximation for the low-redshift sample., the mean is and there are few galaxies having in this IRAS-based sample. This is in contrast to the AKARI-SDSS and AKARI-HIPASS samples that include many galaxies at . This is likely because the IRAS sample was selected at the IRAS 60-m band, while many of the galaxies in our sample are detected in the AKARI 90- and 140-m bands with the FIS flux quality flag FQUAL 3 (see Table 3). Therefore our samples include galaxies having colder dust temperatures than the IRAS-based sample. Note that the errors of (calculated in the same way as ) are large when , because the dependence on of the DH02 templates becomes weaker.
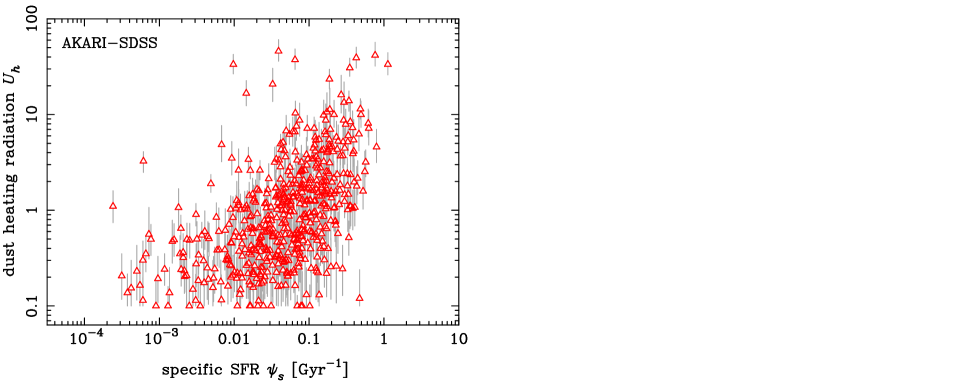
Figure 20 shows the correlation between SSFR and for the AKARI-SDSS sample, using SDSS SFR and stellar mass. This correlation is physically more reasonable than -, because both SSFR and are intensive physical quantities (i.e., not depending on the system size or the amount of material). In fact, we see a better correlation in Fig. 20 than the - correlation: larger for galaxies having larger SSFR. However the slope of the correlation becomes steeper at , and it is still difficult to predict reliably simply from SSFR. It should also be noted that SSFR is not a directly observable quantity, and physical relation between SSFR and is not clear. SSFR is related to star formation history in a galaxy and hence it would affect the SED of dust-heating radiation field. However, a key quantity controlling the radiation field strength is the geometrical size, which is not directly related with SSFR. Correlations between and more directly observable quantities based on better physical connections are worth to seek for.
5.3 Infrared SED versus Global Infrared Radiation Field Strength
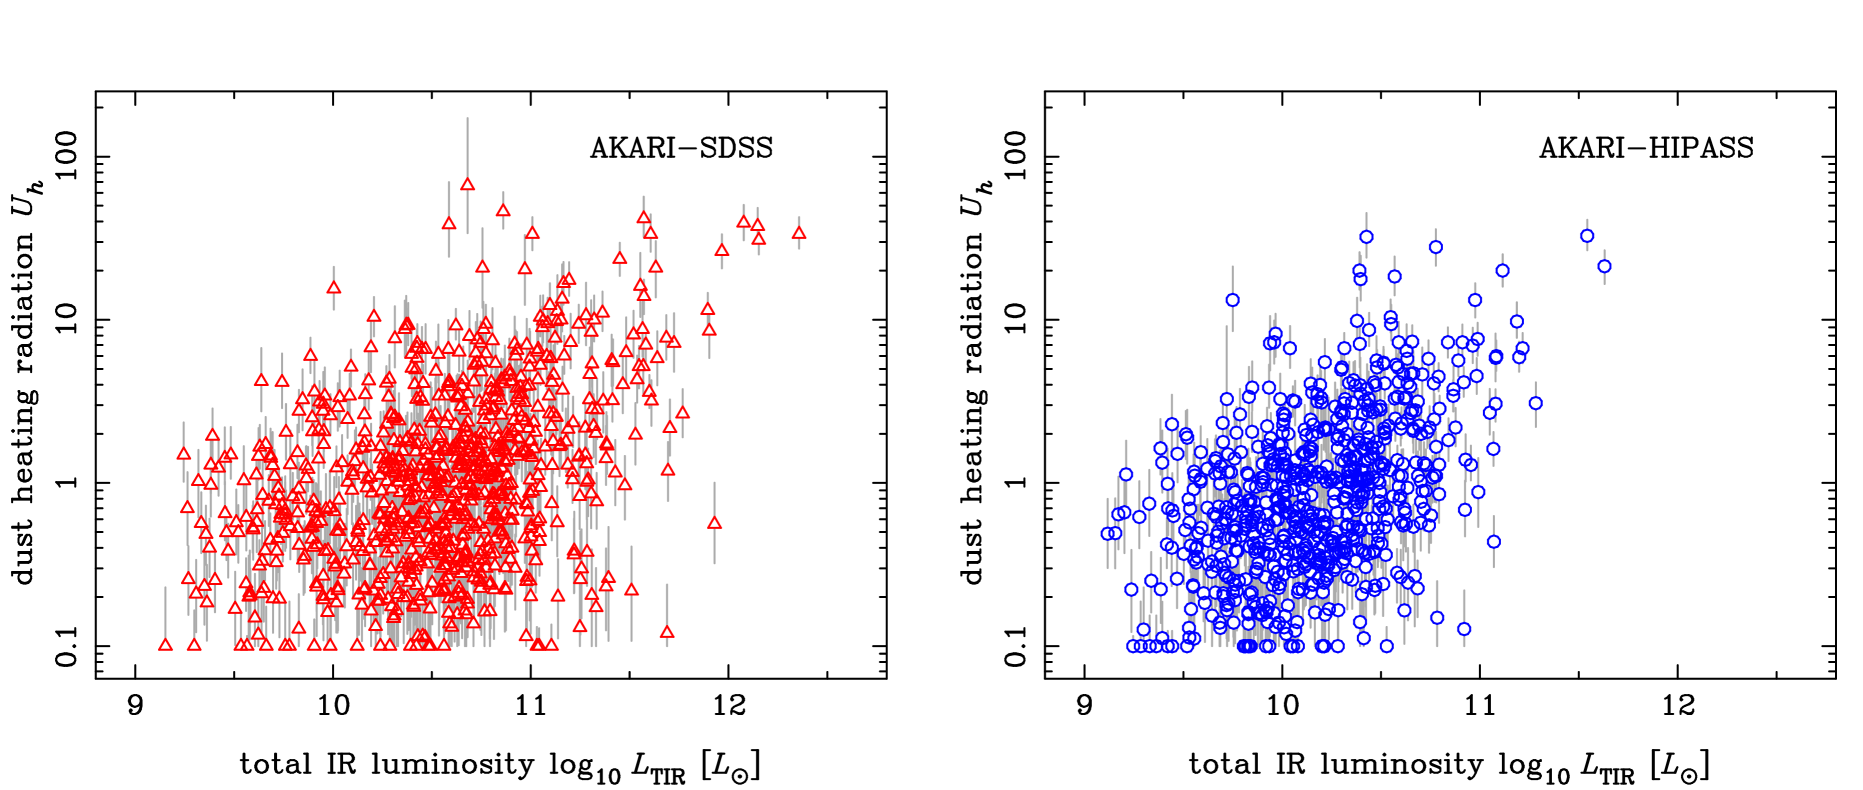
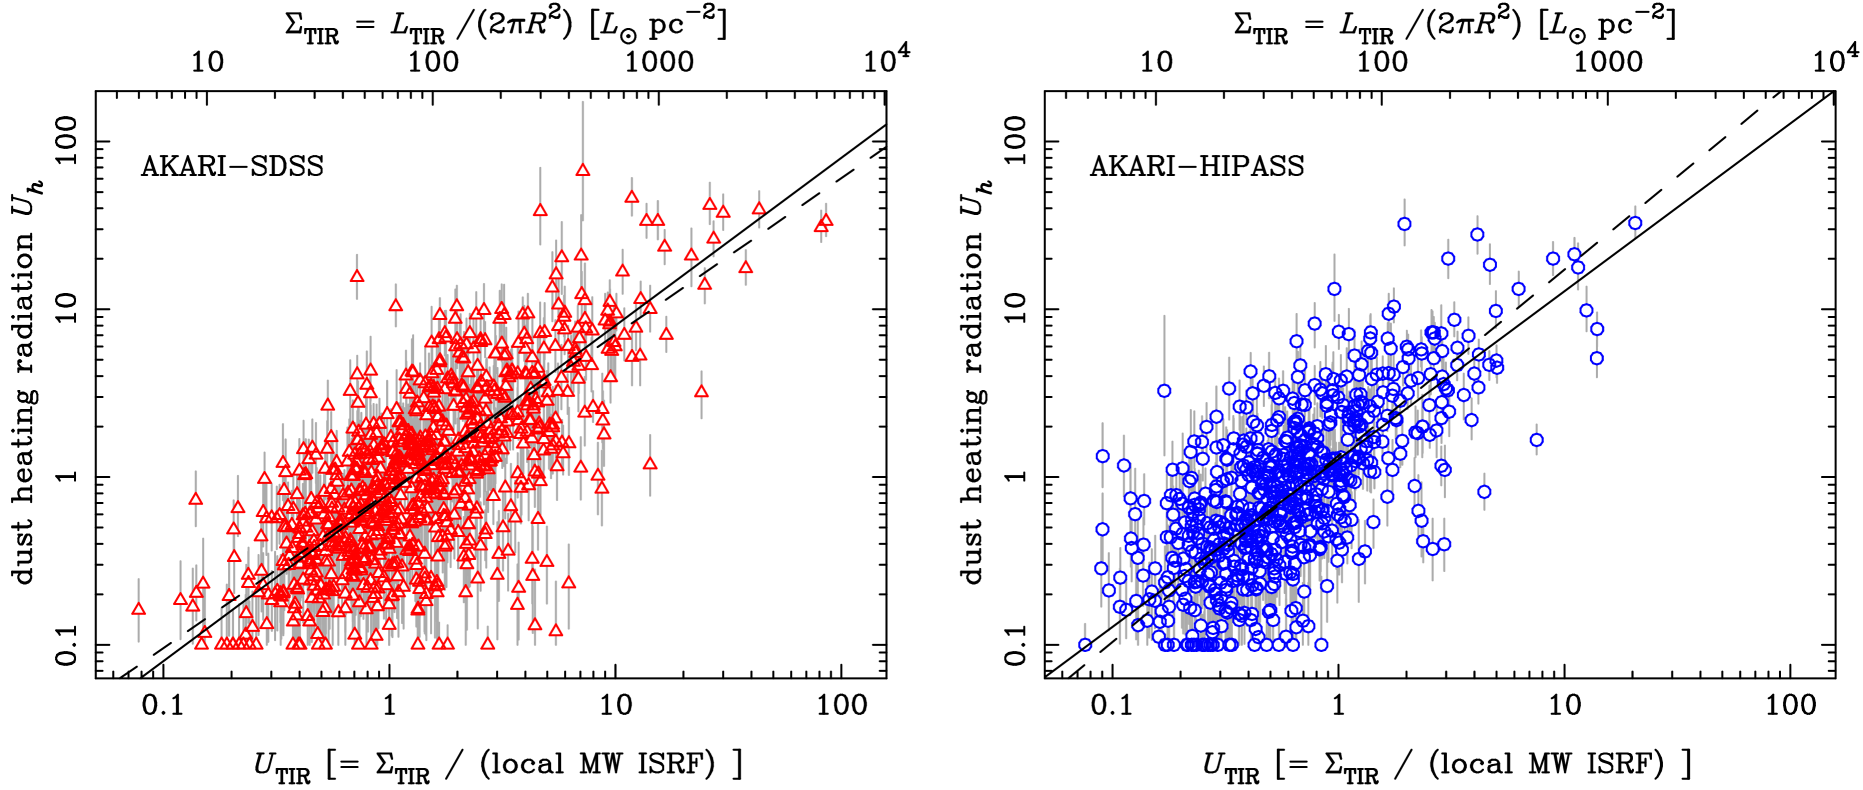
Figure 21 shows the correlation between and , i.e., the galactic-scale infrared radiation field strength normalized by the solar neighbourhood value of ISRF. It can be seen that these two parameters are correlated much better than the - or - relations. The relation is well described by the linear relation of , with the ratio . This result is in nice agreement with the prediction in the case B2 discussed in §4.2, and it strongly indicates that (1) integrated infrared SED of a galaxy is mostly determined by the general ISRF on the global scale of a galaxy, and (2) dust-heating sources are deeply embedded in an optically-thick dust disk, i.e., the scale height of heating sources being smaller than one optical depth of the dust disk.
There are several independent observational evidences supporting this picture. Walterbos & Greenawalt (1996) and Sun & Hirashita (2010) argued for the dominant role of the general ISRF in the determination of infrared SEDs. The geometry of the case B2 is consistent with the smaller scale height of molecular gas than that of H\emissiontypeI in the Galaxy (Malhotra 1994, 1995; Binney & Merrifield 1998), considering that young stars are generally born in dense molecular gas. Here we implicitly assumed that dust-to-gas ratio is fairly constant throughout the Galaxy, which is reasonable as inferred from the well-known good correlation between total (i.e., H\emissiontypeI plus H2) hydrogen column density and color excess of extinction (Bohlin et al. 1978; Heithausen & Mebold 1989; Rachford et al. 2009). Finally we note that the original form of the Schmidt law ( where is spatial gas density) was proposed to explain the smaller vertical scale height of young stars than that of interstellar gas (Schmidt 1959; Fuchs et al. 2009).
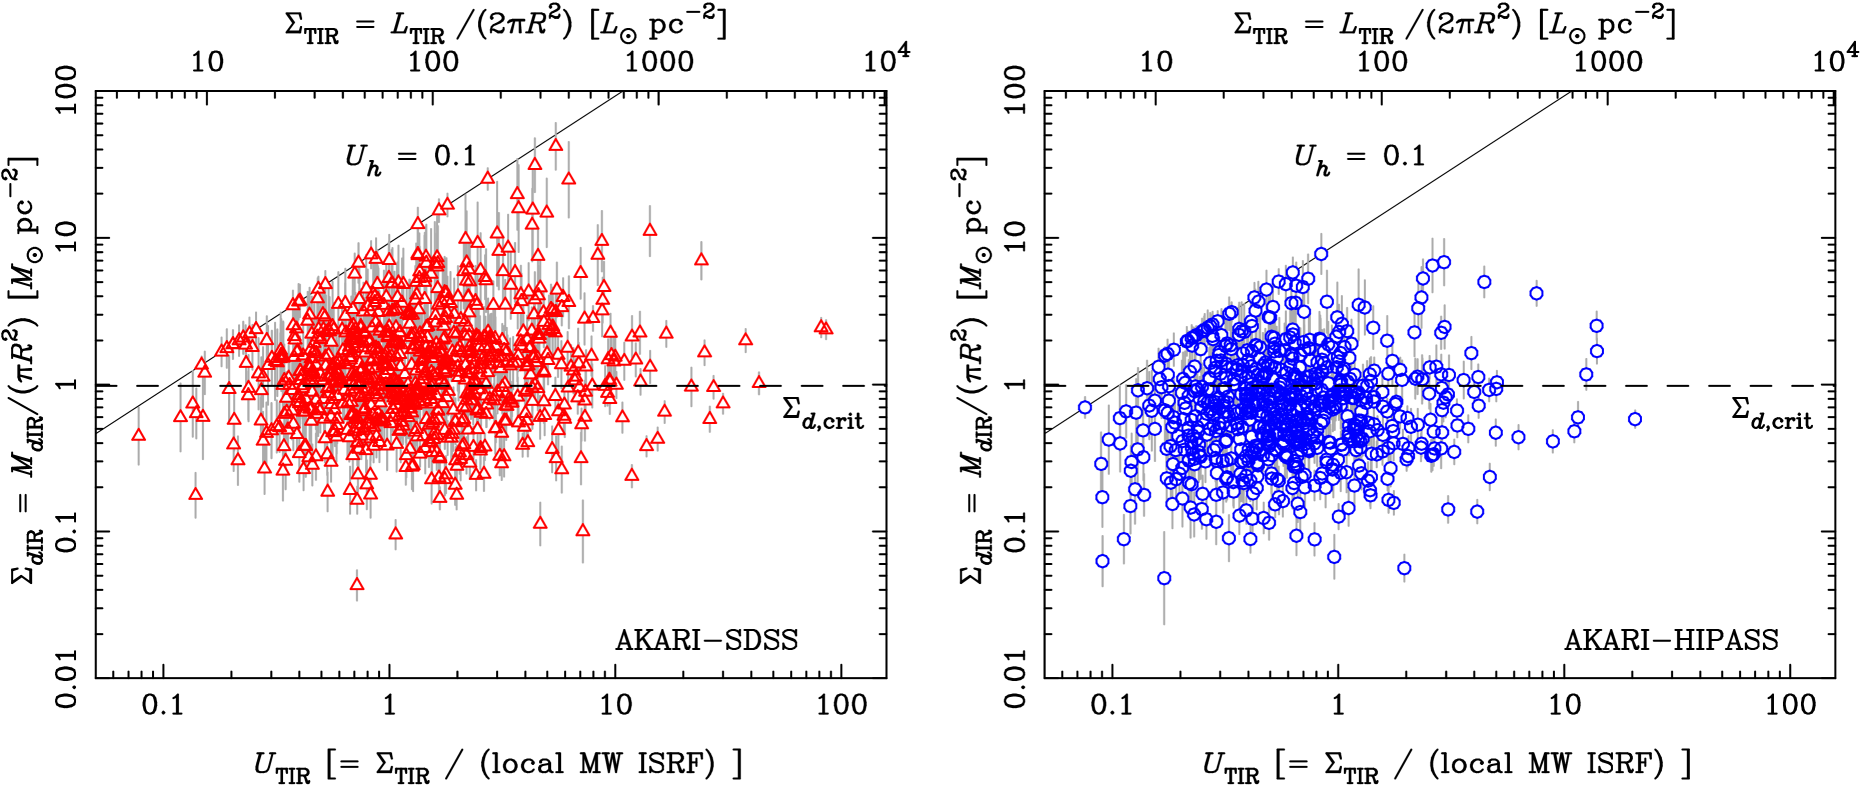
In the case B2, we expect that the dust column density inferred from infrared SED fits, , is constant around . This is checked by Fig. 22, where correlation between and is shown. As expected, the values of do not show any trend against , with the mean value close to . Many of galaxies having large deviations from have large observational errors. Note that no galaxies are found in the region of simply because the fit is limited by the minimum value of the physical dust model.
We fit the - relation by a linear () relation and the results are presented in Table 4 for the AKARI-SDSS and AKARI-HIPASS samples. Here we considered only the errors of , because the errors of are much smaller, as mentioned in §3.2. The proportionality constant is different by just a factor of 1.5 for the two samples, indicating that our result is not seriously affected by the selection bias. We also tried a power-law () relation and a three-dimensional plane fit in the space of , , and . The results are shown in Table 4, and these fits also indicate that the simple relation of is a good description of the observed correlation.
We estimated the physical dispersion of from the mean relation as follows. We define as the observed deviation of of each galaxy from the best-fit relations. Then the observed median of was converted into the observed standard deviation by using the Gaussian relation (median of is ). The use of the median is to avoid the effect of a small number of outliers having large . The quantity includes the observational errors of in the SED fittings, and the intrinsic (i.e., physical) standard deviation was calculated as
| (24) |
where is the mean of 1 errors of in the SED fits. The results for , and are shown in Table 4, and is indicated for all cases. This corresponds to 13 % dispersion in terms of the modified blackbody temperature, using and .
| AKARI-SDSS | AKARI-HIPASS | |
| Linear Fit∗ | ||
| 0.354 | 0.344 | |
| 0.303 | 0.305 | |
| Power-law Fit† | ||
| 0.352 | 0.350 | |
| 0.300 | 0.311 | |
| 3D Plane Fit‡ | ||
| 0.332 | 0.346 | |
| 0.277 | 0.307 | |
| 0.184 | 0.160 |
∗
†
‡
5.4 Dust Mass versus Metal Mass
If the interpretation of the case B2 distribution is correct for the observed - correlation, this can further be tested by checking the trend about against , since the case B2 predicts the scaling of . For this purpose we need to measure the total dust amount in a galaxy independently of the infrared emission. Though it is difficult to directly measure , the total metal mass of a galaxy in the gas phase, , is an indicator of because grains are made from metals. For a part of the AKARI-SDSS sample, the gas-phase metallicity and measurements are available, and we can estimate the H\emissiontypeI-gas-phase metal mass as
| (25) |
where is the H\emissiontypeI fraction of the total hydrogen gas mass, . [The numerical factor corrects the hydrogen mass fraction of the total baryon, (Grevesse et al. 2010).] Some of the AKARI-SDSS galaxies and all of the AKARI-HIPASS galaxies have measurements but no metallicity measurements. To calculate for these galaxies, we adopt a mean value of as inferred from the mass-metallicity plot of the AKARI-SDSS galaxies (Fig. 8). This metallicity is higher than the solar abundance, but not unreasonable for dusty galaxies selected by AKARI, taking also into account the systematic uncertainties in the metallicity measurements (see footnote 2).
Then the total dust mass is related to as
| (26) |
using the dust fraction of the total metal mass in interstellar gas. Observations of interstellar medium in our Galaxy suggest 0.0073, corresponding to (Draine et al. 2007). Although is unknown for our samples, we expect for galaxies with of order unity.
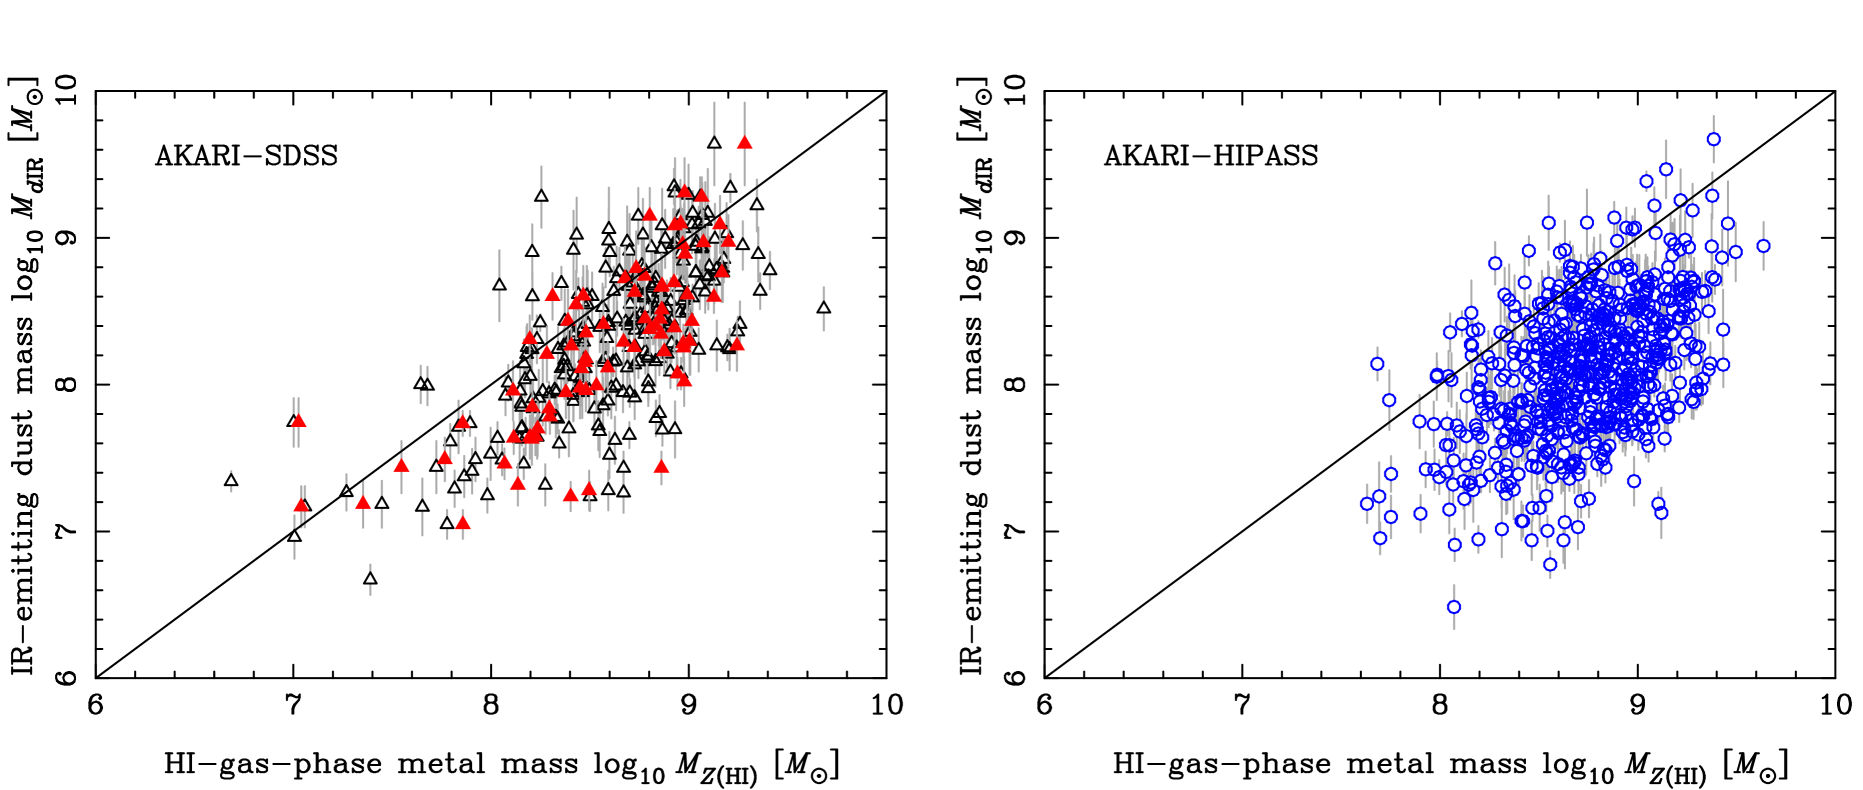
Figure 23 plots against for the two samples. It can be seen that many galaxies are located at the region of , and a clear boundary can be seen at , as expected. There are a small number of AKARI-SDSS galaxies showing high , but most of them are galaxies without metallicity estimates and plotted using . Most galaxies with metallicity measurements have .
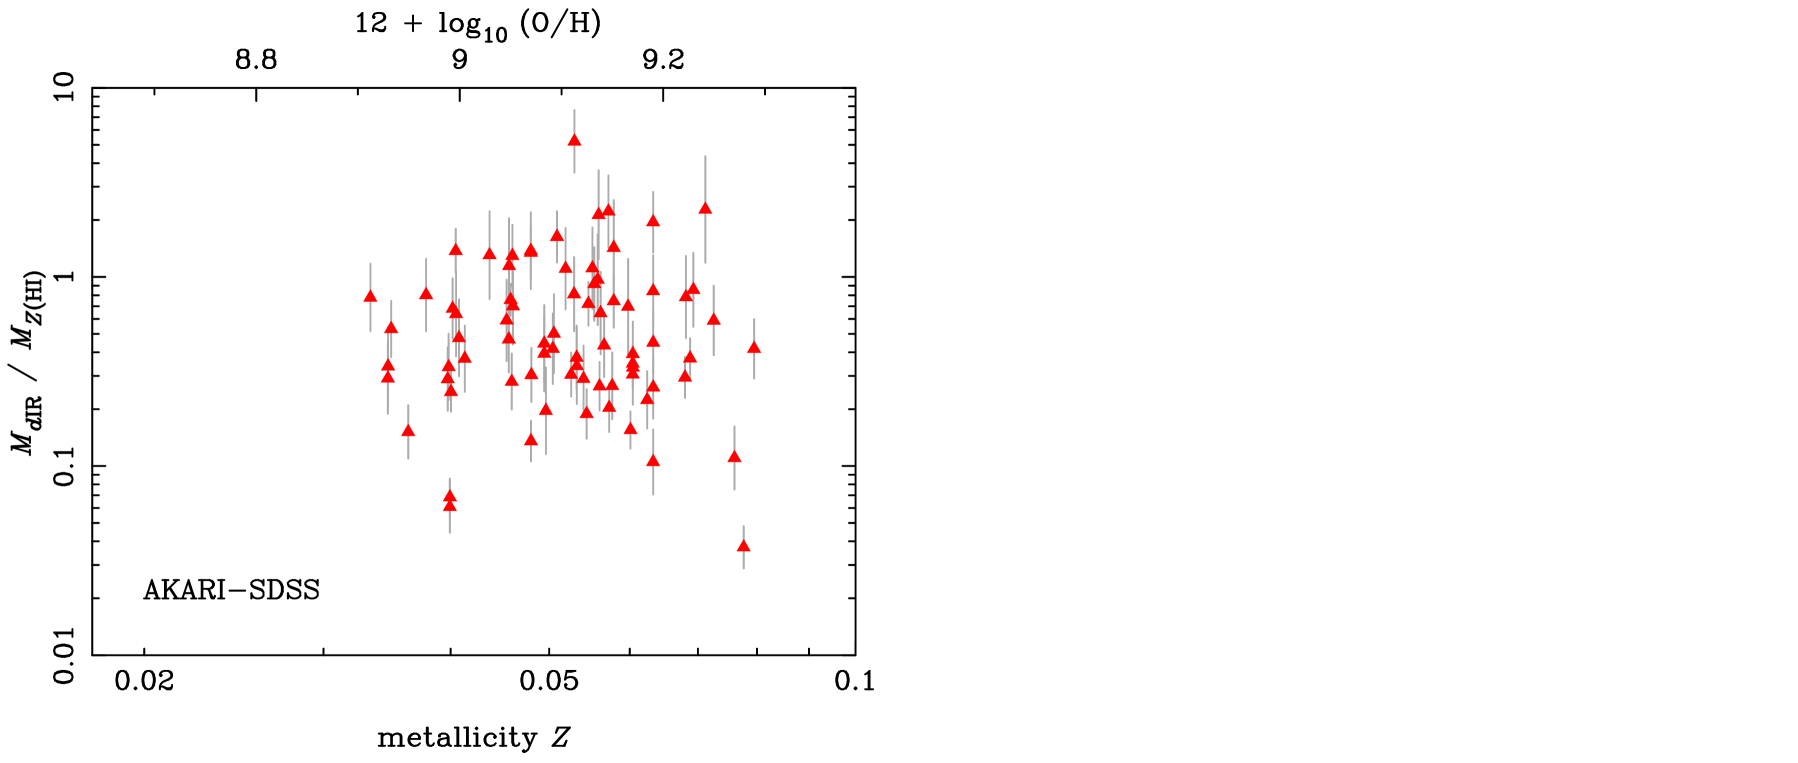
There are galaxies showing , and the origin of this small value is interesting. A possibility is that the dust production efficiency from metals is low, i.e., . There are observational indications that low-metallicity dwarf galaxies have lower dust-to-metal ratios than giant galaxies (Galliano et al. 2003, 2005; Hunt et al. 2005; but see also James et al. 2002). Draine et al. (2007) also found that dust-to-metal ratio is lower for low-metallicity galaxies having , but they argued that infrared emission from such galaxies is from a small region compared with the whole galaxy, and the dust-to-metal ratio becomes consistent with the MW value if it is calculated using gas mass and metallicity in the regions of infrared emission. In any case, galaxies in our sample have as we showed in Fig. 8, and hence the low metallicity effect is unlikely to be the origin of the small values in our sample. Indeed, we plot versus metallicity for the AKARI-SDSS galaxies with available metallicity measurements in Fig. 24, and there is no systematic trend.
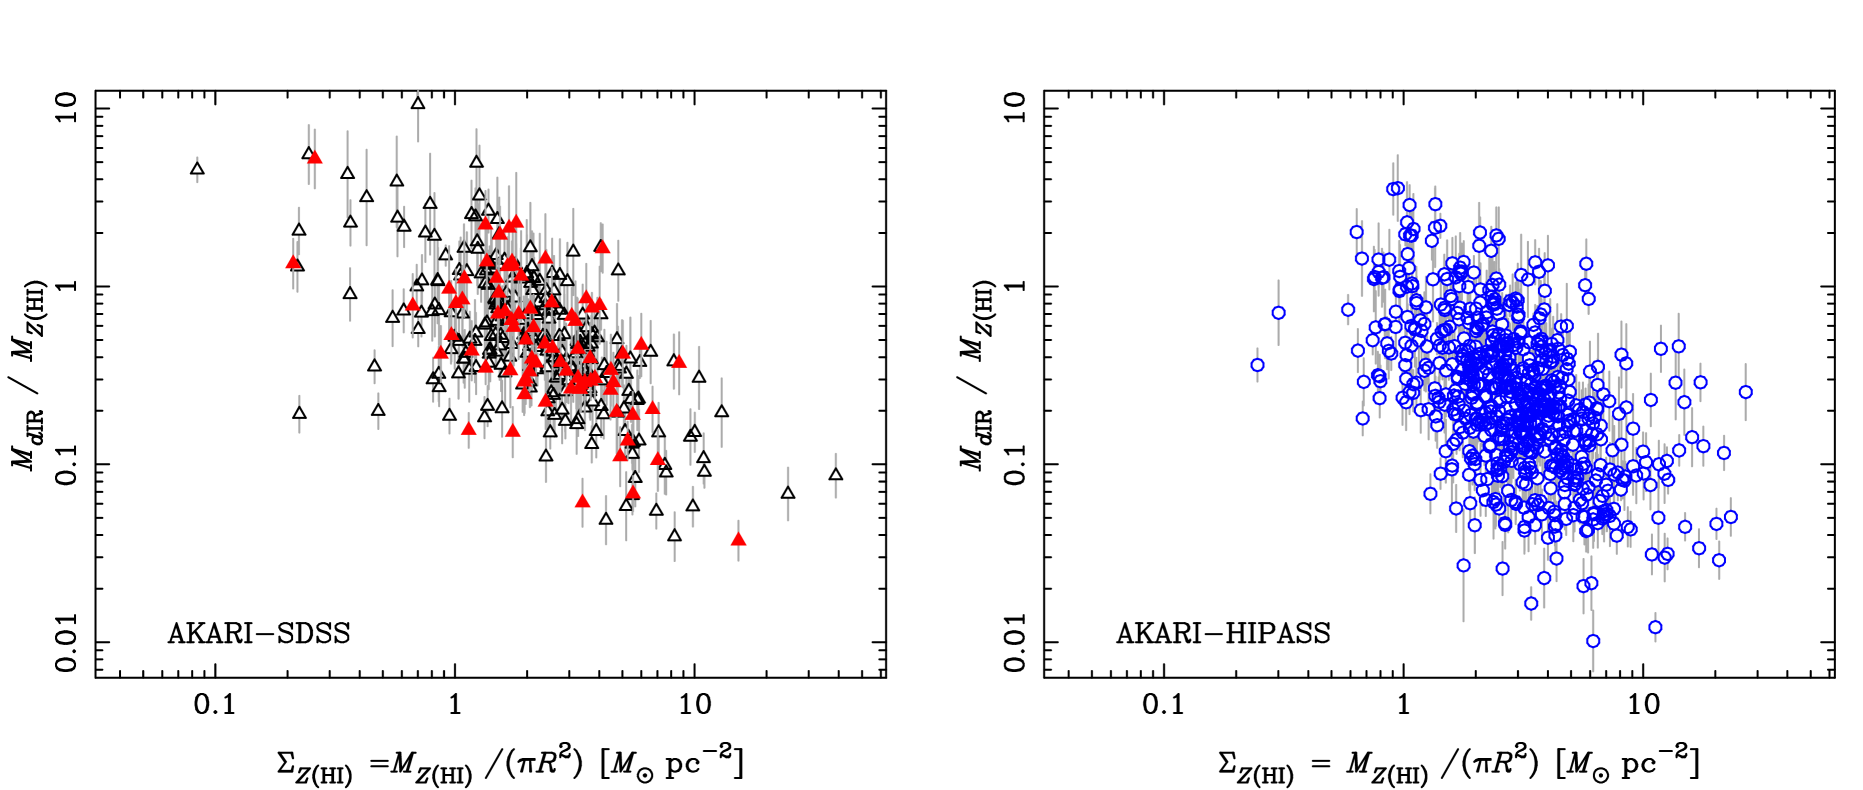
Instead we argue that the dispersion in originates from the difference between and . The good correlation between and indicates the case B2 distribution where only a part of dust is radiated by heating sources. In this case we expect , and hence if is constant for all galaxies, where . Figure 25 shows this correlation, and the data of both samples clearly show the expected correlation. This provides a further support to the interpretation of - relation by the distribution case B2. Given the constant nature of found in Fig. 22, the correlation may seem rather trivial, but this figure demonstrates that stays constant even if significantly changes. According to this interpretation, we expect when , i.e., . The data is consistent with this expectation for a reasonable value of ().
Finally let us examine the assumption of being a constant. The assumption of constant is theoretically reasonable if the dust production process works similarly in all galaxies. It is also known that the dust-to-gas ratio estimated by extinction in optical bands for nearby galaxies and quasar absorption line systems (QALSs) is correlated well with metallicity, indicating that is roughly constant (Issa et al. 1990; Boissier et al. 2004; Vladilo et al. 2006). It should be noted that the extinction in QALSs is sensitive to all dust grains in a system on the line of sight, in contrast to that traces only dust heated by radiation. The variation of in different galaxies may also lead to the scaling of . However, if this effect is significant, we expect that the sequence will appear in the region of because , which is opposite to the observed trend.
5.5 Extension to Circumnuclear Starbursts
We have seen that the infrared emission from the AKARI-SDSS and AKARI-HIPASS galaxies are described well by the case B2 of dust distribution. However, the dynamic range of is limited to , and here we examine the AKARI-SB sample to extend this range.
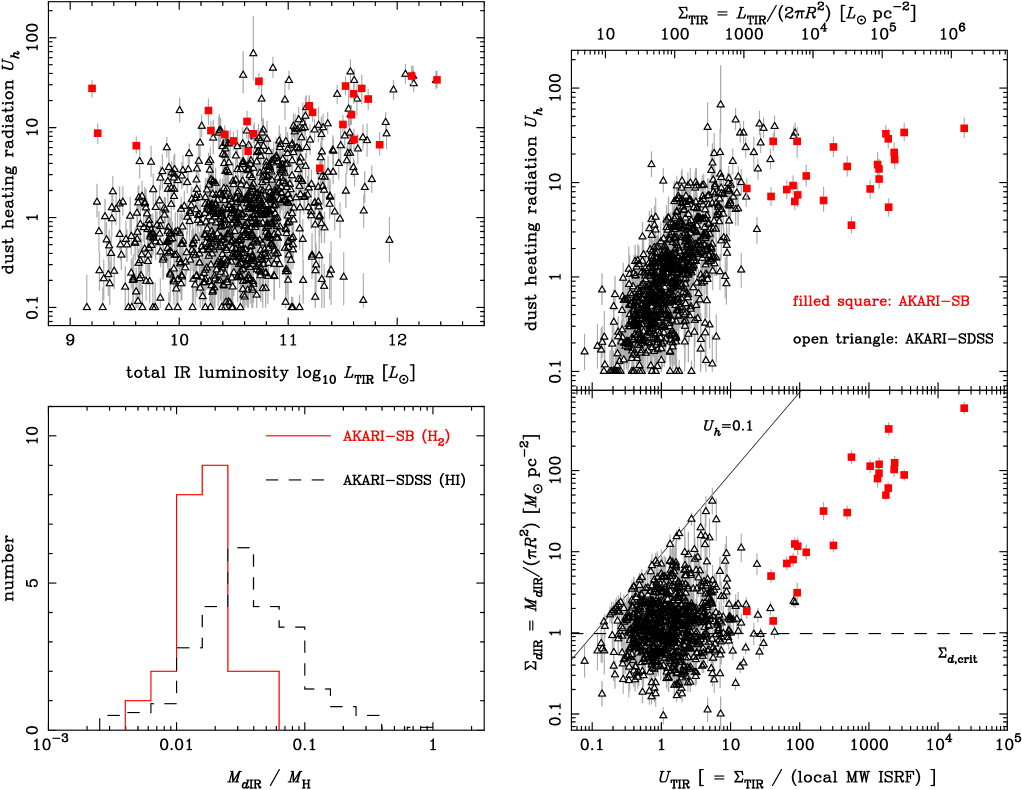
Figure 26 shows the -, -, and - relations of the AKARI-SB galaxies in comparison with the AKARI-SDSS sample. The AKARI-SB galaxies are distributed at similar locations to the AKARI-SDSS galaxies in the - plane, but they have much larger . An interesting trend is found for against ; it is roughly constant and there seems an upper bound of , which is in sharp contrast to the AKARI-SDSS galaxies showing a tight correlation of . But these two data sets are not inconsistent with each other. The dispersion of the ratio for the AKARI-SDSS galaxies becomes larger at , and the distribution of the AKARI-SDSS galaxies is smoothly connected to that of the AKARI-SB sample. Corresponding to the constant nature of against , is roughly proportional to , as expected from eq. (18).
A remarkable result is obtained by comparison between and H2 mass estimated from CO observations, , for the AKARI-SB sample. These two independently measured quantities are correlated much better, as shown in the histogram of in Fig. 26, than the - correlation of the AKARI-SDSS galaxies. The majority of galaxies are clustering around within a factor of 2, and the ratio of 0.015 is close to the expectation of typical dust-to-hydrogen ratio . It is known that molecular hydrogen is the dominant form of hydrogen when the gas column density is very high like circumnuclear starbursts (Kennicutt 1998; Bigiel et al. 2008). Therefore, this result implies that the infrared-emitting dust mass is close to the total dust mass, i.e., .
We consider that this result can be interpreted as follows. As argued by Kennicutt (1998), can be regarded as a good SFR indicator for the K98 SB sample. Using the relations of and , is equivalent to the star formation efficiency (SFE), , which is defined as SFR per unit hydrogen gas mass. Using eq. (4) and (16), we find
| (27) |
and the upper limit of is translated into the upper limit of . Then, the systematic change of the - relation can be explained if there is a fundamental upper limit on SFE by the physics of star formation (see §6.2 for more discussion on the origin of this upper limit).
If this upper limit exists, the distribution case B2 is not allowed when . For the case B2, star formation must occur within a thin layer of the disk whose dust column density is (or , adopting a typical dust-to-hydrogen ratio). Then there is a maximum of the surface SFR density [] for the case B2 determined by and , corresponding to . When is higher than this, the gas column density of the star forming layer must proportionally increase beyond because of the limit of , and hence while becomes constant at . This situation corresponds to the case B1 rather than B2, and the transition from B2 occurs around .
This result should have some implications for the well-known Kennicutt-Schmidt law on the plane of -. We will discuss about this issue in more detail in §6.2.
6 Discussion
6.1 Paucity of Optically Thin Galaxies and Radiative Feedback?
We have found that galaxies studied here are well described by the distribution case B1 or B2, meaning that they are optically thick to dust-heating radiation on a galactic scale (). This is consistent with the distribution of the infrared-to-optical luminosity ratio (Fig. 16); the distribution extends down to with a sudden drop of the galaxy number at , indicating a paucity of optically thin galaxies (). This is also indicated by the sequence of in Fig. 25. If there are a significant number of optically thin galaxies, such galaxies should appear in the region of with a constant value of , corresponding to and . However, such galaxies are not found, and the sequence seems to stop at ().
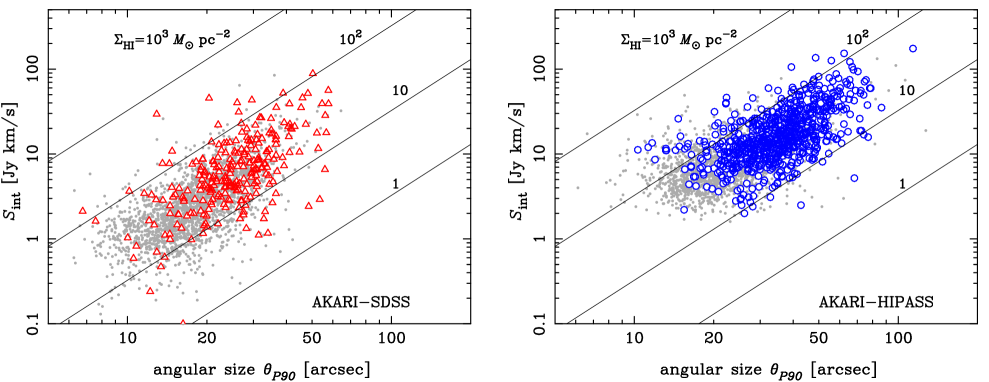
If the optical thickness to dust-heating radiation does not have any effect on galaxy formation efficiency, a fine-tuning would be required for the sharp drop of galaxy distribution around . A possible explanation is a selection effect; optically thin galaxies would have small infrared-to-optical luminosity ratio and hence could be missed in the samples selected by infrared emission. To check this possibility, we plot in Fig. 27 velocity-integrated 21-cm flux density () versus angular size () for the SDSS-H\emissiontypeI and HIPASS samples, in comparison with the AKARI-SDSS and AKARI-HIPASS galaxies. The lines corresponding to several values of H\emissiontypeI column density are also depicted. It can be seen that there is no significant difference between the distributions of for the AKARI-detected and -nondetected galaxies, and the paucity of galaxies in the region of can be seen, roughly corresponding to for typical values of , , and . Hence the infrared selection bias cannot explain the paucity of optically thin galaxies. It should be noted that the beam size of HIPASS is 15.5 arcmin, which is much larger than the galaxy sizes, and hence there should be no selection bias about surface brightness in the H\emissiontypeI data.
Therefore we consider that there is a physical effect reducing the efficiency of galaxy formation when . Because the opacity is to dust-heating radiation, it is most likely the radiative feedback by the dust photoelectric heating of ISM. A part (typically 1–10%) of radiation energy absorbed by dust grains is converted to photoelectrons and subsequently heat ISM, and this effect is large enough to be the dominant heating process in many phases of ISM in galaxies (see, e.g., Bakes & Tielens 1994; Wolfire et al. 1995; Rubin et al. 2009). Then, in galaxies, it is expected that the lack of self-shielding of dust-heating radiation leads to the suppression of star formation activity and reduction of neutral gas in ISM on a galactic scale. Bigiel et al. (2010) found that star formation efficiency becomes extremely low with decreasing in outer disk of nearby galaxies, which is consistent with the picture discussed here.
On the other hand, in the large limit of , Fig. 27 shows the paucity of galaxies at the region of . This is likely because most of gas tends to be molecular when gas column density is high, resulting in a saturation of , as observed for nearby galaxies (Bigiel et al. 2008). The efficient self-shielding of dust-heating radiation may be responsible for converting H\emissiontypeI into H2. The lack of both large and small galaxies by these effects may explain the known good correlation between H\emissiontypeI mass and size, (Haynes & Giovanelli 1984; Rosenberg & Schneider 2003; Garcia-Appadoo et al. 2009; van der Kruit & Freeman 2011). The dispersion in seems especially small when H\emissiontypeI size is used for (Rosenberg & Schneider 2003), further indicating that is playing an essential role.
6.2 Implications for the Kennicutt-Schmidt Relation
The quantities about infrared emission discussed in this work are mostly in surface densities of galaxies, e.g., or . These quantities are closely related to the surface density of SFR, , and surface hydrogen gas density, . Since the correlation between and is frequently discussed in the literature as the Kennicutt-Schmidt relation (Schmidt 1959; Kennicutt 1998), it is interesting to discuss about it in light of the results obtained in this work.
In Figure 28 we show the - plot for the AKARI-SDSS and SDSS-H\emissiontypeI samples, using H\emissiontypeI gas mass for . For the K98 SB sample, we plot the original data for the 36 galaxies in K98 ( from H2 mass by CO observations), corrected only for SFR into the Kroupa IMF. The SFRs of the SDSS galaxies are from optical spectra, while those of the K98 SB sample are from . There is no good correlation between and for galaxies in the SDSS-based samples at , which is consistent with the results of K98 for normal spirals and of Bigiel et al. (2008) for sub-kpc regions of nearby galaxies. This range of roughly corresponds to , and as argued in §6.1, the radiative feedback process seems to be working to suppress the star formation activity. Then the relation between SFR and H\emissiontypeI gas amount would become complicated by unstable competition between star formation and its feedback. This may give an explanation for the large dispersion in the - relation.
On the other hand, we have found in §5.5 that is constant at for the AKARI-SB sample, corresponding to a constant SFE of , i.e., . This SFE is equivalent to the star formation time scale of Gyr. It is interesting to note that this characteristic SFE is in nice agreement with those found in the correlation between and SFR for a wide variety of galaxies as well as molecular clouds in the Galaxy (Gao & Solomon 2004; Wu et al. 2005; Bigiel et al. 2008; Evans et al. 2009), when the gas mass is measured from tracers of dense molecular gas. These results indicate that is a universal characteristic value originating from the physics of star formation in ISM, rather than time scales on a galactic scale. It is widely known that the efficiency of star formation from molecular clouds is typically a few percent in mass fraction, and typical dynamical time scales of molecular clouds are Myr, resulting in a star formation time scale of 0.1 Gyr. This maximum SFE seems to be achieved on a galactic scale when () because the self-shielding effect of dust-heating radiation is working for efficient gas cooling. Most of interstellar gas would be molecular in such galaxies.
Now we may interpret the overall trend of the galaxy distribution on the - plane by the strong dependence of SFE on the dust opacity, as follows. There are very few galaxies having , because the feedback suppresses an efficient star formation. Galaxies appear in the region of with a large dispersion in the Kennicutt-Schmidt law, because SFE rapidly increases around . Then SFE continues to increase and asymptotically reaches the maximum value of at . We expect many galaxies around because star formation time scale is relatively longer than that in more dusty galaxies.

6.3 Implications for Theoretical Modelings of Galaxy Formation
There are a few implications of the results obtained by this work for theoretical modeling of galaxy formation and evolution. First of all, the tight correlation between and for normal galaxies provides a convenient way to calculate infrared SEDs in cosmological galaxy formation models, in which the total dust-unabsorbed luminosity of stellar emission and size of a galaxy can be calculated in a relatively straightforward manner. When galaxies are optically thick in terms of as indicated by our study, the total stellar luminosity gives a direct estimate of . Then or can easily be calculated from the - relation, which is more reliable than - relation because of the tighter correlation and more solid physical background. There is no particular reason to expect that this relation does not hold for high redshift galaxies, if the dust properties are not significantly different and the spatial distribution of stars and dust grains is the case B2. It must be examined whether the existing ab initio galaxy formation models of infrared emission satisfy this relation, especially at .
Another important implication is the strong dependence of star forming activity on dust opacity or gas column density suggested in §6.1 and §6.2. Various feedback processes have intensively been discussed in the context of cosmological galaxy formation (e.g., Benson et al. 2003; Baugh 2006; Silk 2011), but these feedback processes are not physically connected to the galaxy-scale dust opacity, . Photoionization of hydrogens may have a similar dependence on gas column density, but it has a much larger opacity than by a factor of for . Supernova/AGN feedbacks are unlikely related to the galaxy-scale dust opacity.
We have argued in §6.1 that the dust photoelectric heating of ISM is the likely process responsible for the feedback working in galaxies. Using eq. (4), 1 of star formation produces erg by photoelectric heating, when most of heating radiation energy is absorbed into dust grains. This heating energy is comparable with and may even be larger than erg produced by the supernova feedback (assuming erg per one supernova, 8 threshold for supernova explosions, and the Kroupa IMF). In contrast to supernova feedback, which is a local energy input only to dynamically connected regions, photoelectric heating could suppress star formation on the global scale in a galaxy when .
Such a feedback effect as a function of dust opacity (or gas column density) may systematically change the galaxy formation and evolution. Cosmological objects with dark matter mass virializing at redshift have virial density proportional to , and the available baryon mass and galaxy size roughly scale with dark matter mass and virial radius, respectively. Therefore we expect that gas column density scales as , indicating that this effect will accelerate star formation at higher redshifts, also weakly favoring star formation in massive objects at a fixed redshift.
This may have interesting implications for some major problems in the hierarchical galaxy formation scenario (e.g., Baugh 2006; Silk 2011). One is the difficulty to reproduce the early appearance of massive and quiescent galaxies at high redshifts (Cimatti et al. 2004; Glazebrook et al. 2004), and another is that the theory predicts too large stellar mass in massive dark halos () at compared with the observed galaxy luminosity function (the so-called “overcooling” problem). If SFE is a strong function of , it would increase the star formation activity at high-redshift compact dark halos. Massive objects have larger gas column density at a fixed redshift, which may be relevant to reproduce the well-known trend of downsizing in galaxy formation. On the other hand, dark halos collapsing at low redshifts are massive but have low densities, and star formation would be suppressed to alleviate the overcooling problem.
6.4 Comparison with Previous Studies
One of the most important results of this paper is the tight correlation between the dust-heating radiation strength and the galaxy-scale infrared radiation strength . The parameter is equivalent to the infrared surface brightness, and the correlation of this quantity to infrared SED has been studied by Lehnert & Heckman (1996, hereafter LH96) and Chanial et al. (2007, hereafter C07).
LH96 estimated the size of 32 nearby starburst galaxies by H images, and found a correlation between and infrared color temperature estimated by 60/100 m flux ratios. They argued that a surrounding dust screen radiated by a radiation field strength of is an adequate zeroth-order description of their data, which is equivalent to our interpretation of the case B2 for normal star-forming galaxies. However, we also found that becomes roughly constant for circumnuclear starbursts in the high SFR density region. The LH96 galaxies are in the range of , roughly corresponding to assuming that the H radius is not different from the -band radius used here. This is the region of transition from to a constant , and indeed, the distribution of the LH96 galaxies is flatter than expected from the simple surrounding screen in the versus plane (see their Fig. 5). Our result is thus not inconsistent with that of LH96, but revealed the correlation more quantitatively by larger statistics, using not only starbursts but also normal galaxies.
C07 studied on samples (400 galaxies in total) including non-starburst galaxies. They estimated galaxy sizes by radio continuum (RC) images, and found a correlation of with , where is the dust temperature estimated by assuming the modified blackbody spectrum. The range of is – (–). In contrast to LH96, they concluded that the surrounding dust screen is ruled out because the observed slope of the correlation is significantly different from the expectation (). Instead, they proposed another interpretation based on the Kennicutt-Schmidt law. Assuming a constant dust-to-gas ratio (), , and the original form of the Kennicutt-Schmidt law (, Kennicutt 1998), the basic equation of can be reduced to , which is close to the observed value with the emissivity index of –2.
Our result of for normal galaxies () is equivalent to , while the constant for the circumnuclear starbursts () corresponds to . The value obtained by C07 may be a result of the fit including the transition region of between the two regimes. Their interpretation based on the Kennicutt-Schmidt law is not supported from our study, because we have seen that SFR is not proportional to , and is roughly constant against change of , for normal star-forming galaxies. There is a large scatter in the Kennicutt-Schmidt law, and it is unlikely that the tight correlation between and emerges from this law.
Besides the larger statistics, the strength of our study is that we estimated the dust-heating radiation field strength by fitting realistic physical dust models to the four AKARI/FIS photometric bands at 65–160 m covering the broad thermal SED peak. It is good to use instead of to examine the correlation against , because they have the same physical dimensions and hence not only the scaling between the two but also the ratio is physically meaningful. It should also be noted that is meaningful only for large grains in thermal equilibrium. Another important source of difference is that, as mentioned in §5.2, the AKARI-based samples include galaxies with smaller than the IRAS-based samples used in the previous studies, which enabled us to clearly find the linear correlation between and in the normal galaxy regime.
7 Summary and Conclusions
We have constructed two new low-redshift galaxy samples based on the AKARI/FIS All Sky Bright Source Catalog: the AKARI-SDSS sample (878 galaxies) cross-correlated with the SDSS galaxies and available H\emissiontypeI data, and the AKARI-HIPASS sample (711 galaxies) cross-correlated with the HIPASS H\emissiontypeI galaxy catalog. To complement these for wider dynamic range of surface SFR density, the AKARI-SB sample (24 galaxies) has also been constructed from nearby circumnuclear starbursts. These samples include only galaxies having high quality AKARI/FIS fluxes at least in two bands to ensure the reliability of SED fittings.
We then studied these samples to understand the physics determining galactic-scale infrared SEDs, especially the broad thermal peak by large grains. The strength of dust-heating radiation field (, roughly corresponding to the dust temperature as ), heated dust mass (), and total infrared luminosity () were derived from the fittings of physical dust models to the observed infrared SEDs, and their correlations with various physical quantities [optical size and luminosity, SFR (), stellar mass (), metallicity, and H\emissiontypeI or H2 gas masses] were investigated.
We found a tight power-law correlation between the ratio and the specific SFR (SSFR, ), as , which is valid except for very dusty galaxies having a large infrared-to-optical luminosity ratio (§5.1). Therefore SSFR is a good measure of the contribution from young stars to . This relation may be useful to estimate the third parameter when two of SFR, , and are known. The widely used value of as a SFR indicator is valid only for galaxies having largest SSFR of , and relatively aged stellar population must be taken into account in the dust-heating energy budget for most of the AKARI-SDSS galaxies.
The most important result of this work is the discovery of the tight linear correlation between and galactic-scale mean infrared radiation field for the AKARI-SDSS and AKARI-HIPASS samples, taking the -band optical size as (§5.3). The ratio of is close to unity in the same physical units, and the physical dispersion along this relation in is about 0.3 dex (% in the dust temperature). This - relation is nicely explained by a thin disk of dust-heating sources embedded in a thicker, optically-thick () dust disk (the case B2 in Fig. 15), where is the effective dust opacity averaged over wavelength with the weight of the SED of the interstellar radiation field (ISRF). This also means that infrared SEDs of galaxies are determined mainly by ISRF on a galactic scale, rather than those on smaller scales like individual star forming regions or molecular clouds.
The - relation is particularly useful in theoretical modeling of infrared emission, giving a simple method to determine dust SED from and that can be predicted relatively easily in cosmological galaxy formation models. It may also be useful in observational studies; e.g., when flux of dust emission is available only in one band for a galaxy but its size is known, one can make a guess about the SED shape and by searching for that satisfies the relation of .
Since only dust in the layer of one optical depth is heated, the dust column density estimated by infrared emission should be constant at corresponding to , which was also confirmed by our data. This interpretation predicts that the heated fraction of the total dust mass () scales with the total dust column density as , and the observed trends of and support this expectation, where denotes the metal in H\emissiontypeI gas phase (§5.4). An important implication is that, for many normal galaxies, the dust mass derived from infrared emission gives only a lower bound, with a significant amount of cold dust not contributing to infrared emission.
On the other hand, the data of the AKARI-SB sample indicate that there is an upper limit of (in units of the local ISRF around the solar neighbourhood), and becomes constant at this value for intensive starbursts having (§5.5). The H2 mass is tightly correlated with the heated dust mass , and the upper limit of corresponds to the maximum star formation efficiency (SFE, defined as SFR per hydrogen gas mass) of . This maximum SFE likely originates from the physics of star formation in ISM, and the spatial distribution of heating sources and dust changes from the case B2 to B1 (the same mixed distribution for stars and dust) in Fig. 15 around .
All the galaxies studied here seem optically thick to dust heating radiation. The distribution of extends down to , but there is a sharp drop of the number of optically thin galaxies at . We argued in §6.1 that this is unlikely to be a result of selection effects, but there seems a feedback effect to suppress the formation of optically thin galaxies. Because it is related to dust opacity, the feedback is likely by the photoelectric heating of ISM by dust grains. This process is known to be the major heating in many phases of ISM, and the self-shielding of dust-heating radiation on a galactic scale may be a necessary condition to avoid a global suppression of star formation. It is often stated that starburst galaxies are dusty, but if this hypothesis is true, one may rather state that they are starbursts because they are dusty.
We discussed implications of our results for galaxy formation in general. The strong dependence of galactic-scale gas cooling on may be responsible for the known correlation between H\emissiontypeI mass and size (), which is on the line corresponding to (§6.1). The Kennicutt-Schmidt law (SFR surface density versus hydrogen gas surface density ) may be understood by the maximum SFE as the baseline with the strong dependence of SFE on by the feedback (§6.2). The feedback by dust opacity may also have interesting implications for galaxy formation in the cosmological context, because it would accelerate star formation in massive objects at high redshifts. Such an effect may be helpful to solve some of the problems currently discussed in the field of cosmological galaxy formation (§6.3).
It is quite intriguing to examine whether the scaling relations found in this work, especially -, hold also for high redshift galaxies. Planned infrared/submillimeter facilities will give such opportunities in the near future. Especially, ALMA will be a quite powerful facility for this purpose by the unprecedented flux sensitivity and angular resolution at wavelengths covering the thermal SED peak at high redshifts.
The electronic catalog data of the samples constructed in this work are available on request to the authors.
We would like to thank Y. Inoue for useful discussions. This work is based on observations with AKARI, a JAXA project with the participation of ESA. This work was supported in part by the Grant-in-Aid for Scientific Research (19740099 for TT, 20740105 and 23340046 for TTT, 22740123 for MN, and 22111506 for all) from the Ministry of Education, Culture, Sports, Science and Technology (MEXT). TT and RM were supported by the Global COE Program “The Next Generation of Physics, Spun from Universality and Emergence” from MEXT. TTT was supported by the Global COE Program “Quest for Fundamental Principles in the Universe: from Particles to the Solar System and the Cosmos” from MEXT. TTT was also supported by the Program for Improvement of Research Environment for Young Researchers from the Special Coordination Funds for Promoting Science and Technology. MARK was supported by the Research Fellowship for Young Scientists from the Japan Society for the Promotion of Science (JSPS).
References
- [Bakes & Tielens(1994)] Bakes, E. L. O., & Tielens, A. G. G. M. 1994, ApJ, 427, 822
- [Baugh et al.(2005)] Baugh, C. M., Lacey, C. G., Frenk, C. S., Granato, G. L., Silva, L., Bressan, A., Benson, A. J., & Cole, S. 2005, MNRAS, 356, 1191
- [Baugh(2006)] Baugh, C. M. 2006, Reports on Progress in Physics, 69, 3101
- [Bell et al.(2004)] Bell, E. F., et al. 2004, ApJ, 608, 752
- [Benson et al.(2003)] Benson, A. J., Bower, R. G., Frenk, C. S., Lacey, C. G., Baugh, C. M., & Cole, S. 2003, ApJ, 599, 38
- [Bigiel et al.(2008)] Bigiel, F., Leroy, A., Walter, F., Brinks, E., de Blok, W. J. G., Madore, B., & Thornley, M. D. 2008, AJ, 136, 2846
- [Bigiel et al.(2010)] Bigiel, F., Leroy, A., Walter, F., Blitz, L., Brinks, E., de Blok, W. J. G., & Madore, B. 2010, AJ, 140, 1194
- [Binney and Merrifield (1998)] Binney, J. & Merrifield, M. 1998, Galactic Astronomy, Princeton Univ. Press (§9.2)
- [Blanton et al.(2005)] Blanton, M. R., et al. 2005, AJ, 129, 2562
- [Bohlin et al.(1978)] Bohlin, R. C., Savage, B. D., & Drake, J. F. 1978, ApJ, 224, 132
- [Boissier et al.(2004)] Boissier, S., Boselli, A., Buat, V., Donas, J., & Milliard, B. 2004, A&A, 424, 465
- [Boquien et al.(2010)] Boquien, M., et al. 2010, ApJ, 713, 626
- [Brinchmann et al.(2004)] Brinchmann, J., Charlot, S., White, S. D. M., Tremonti, C., Kauffmann, G., Heckman, T., & Brinkmann, J. 2004, MNRAS, 351, 1151
- [Buat et al.(2011)] Buat, V., Giovannoli, E., Takeuchi, T. T., Heinis, S., Yuan, F.-T., Burgarella, D., Noll, S., & Iglesias-Páramo, J. 2011, A&A, 529, A22
- [Catinella et al.(2010)] Catinella, B., et al. 2010, MNRAS, 403, 683
- [Chanial et al.(2007)] Chanial, P., Flores, H., Guiderdoni, B., Elbaz, D., Hammer, F., & Vigroux, L. 2007, A&A, 462, 81 (C07)
- [Chapin et al.(2009)] Chapin, E. L., Hughes, D. H., & Aretxaga, I. 2009, MNRAS, 393, 653
- [Chapman et al.(2003)] Chapman, S. C., Helou, G., Lewis, G. F., & Dale, D. A. 2003, ApJ, 588, 186
- [Chary & Elbaz(2001)] Chary, R., & Elbaz, D. 2001, ApJ, 556, 562
- [Cimatti et al.(2004)] Cimatti, A., et al. 2004, Nature, 430, 184
- [da Cunha et al.(2008)] da Cunha, E., Charlot, S., & Elbaz, D. 2008, MNRAS, 388, 1595
- [da Cunha et al.(2010)] da Cunha, E., Eminian, C., Charlot, S., & Blaizot, J. 2010, MNRAS, 403, 1894
- [Dale et al.(2001)] Dale, D. A., Helou, G., Contursi, A., Silbermann, N. A., & Kolhatkar, S. 2001, ApJ, 549, 215
- [Dale & Helou(2002)] Dale, D. A., & Helou, G. 2002, ApJ, 576, 159 (DH02)
- [Desert et al.(1990)] Desert, F.-X., Boulanger, F., & Puget, J. L. 1990, A&A, 237, 215
- [Devereux(1987)] Devereux, N. 1987, ApJ, 323, 91
- [Dopita et al.(2005)] Dopita, M. A., et al. 2005, ApJ, 619, 755
- [Doyle et al.(2005)] Doyle, M. T., et al. 2005, MNRAS, 361, 34
- [Draine(2003)] Draine, B. T. 2003, ARA&A, 41, 241
- [Draine & Li(2007)] Draine, B. T., & Li, A. 2007, ApJ, 657, 810 (DL07)
- [Draine et al.(2007)] Draine, B. T., et al. 2007, ApJ, 663, 866
- [Dunne et al.(2000)] Dunne, L., Eales, S., Edmunds, M., Ivison, R., Alexander, P., & Clements, D. L. 2000, MNRAS, 315, 115
- [Dunne et al.(2003)] Dunne, L., Eales, S. A., & Edmunds, M. G. 2003, MNRAS, 341, 589
- [Evans et al.(2009)] Evans, N. J., et al. 2009, ApJS, 181, 321
- [Fisher et al.(1995)] Fisher, K. B., Huchra, J. P., Strauss, M. A., Davis, M., Yahil, A., & Schlegel, D. 1995, ApJS, 100, 69
- [Fontanot et al.(2007)] Fontanot, F., Monaco, P., Silva, L., & Grazian, A. 2007, MNRAS, 382, 903
- [Fuchs et al.(2009)] Fuchs, B., Jahreiß, H., & Flynn, C. 2009, AJ, 137, 266
- [Galliano et al.(2003)] Galliano, F., Madden, S. C., Jones, A. P., Wilson, C. D., Bernard, J.-P., & Le Peintre, F. 2003, A&A, 407, 159
- [Galliano et al.(2005)] Galliano, F., Madden, S. C., Jones, A. P., Wilson, C. D., & Bernard, J.-P. 2005, A&A, 434, 867
- [Gao & Solomon(2004)] Gao, Y., & Solomon, P. M. 2004, ApJ, 606, 271
- [Garcia-Appadoo et al.(2009)] Garcia-Appadoo, D. A., West, A. A., Dalcanton, J. J., Cortese, L., & Disney, M. J. 2009, MNRAS, 394, 340
- [Giovanelli et al.(2007)] Giovanelli, R., et al. 2007, AJ, 133, 2569
- [Glazebrook et al.(2004)] Glazebrook, K., et al. 2004, Nature, 430, 181
- [Goto et al.(2011a)] Goto, T., et al. 2011a, MNRAS, 410, 573
- [Goto et al.(2011b)] Goto, T., et al. 2011b, MNRAS, 414, 1903
- [Granato et al.(2000)] Granato, G. L., Lacey, C. G., Silva, L., Bressan, A., Baugh, C. M., Cole, S., & Frenk, C. S. 2000, ApJ, 542, 710
- [Grevesse et al.(2010)] Grevesse, N., Asplund, M., Sauval, A. J., & Scott, P. 2010, Ap&SS, 328, 179
- [Guiderdoni et al.(1998)] Guiderdoni, B., Hivon, E., Bouchet, F. R., & Maffei, B. 1998, MNRAS, 295, 877
- [Hauser & Dwek(2001)] Hauser, M. G., & Dwek, E. 2001, ARA&A, 39, 249
- [Haynes & Giovanelli(1984)] Haynes, M. P., & Giovanelli, R. 1984, AJ, 89, 758
- [Heithausen & Mebold(1989)] Heithausen, A., & Mebold, U. 1989, A&A, 214, 347
- [Hildebrand(1983)] Hildebrand, R. H. 1983, QJRAS, 24, 267
- [Hunt et al.(2005)] Hunt, L., Bianchi, S., & Maiolino, R. 2005, A&A, 434, 849
- [Hwang et al.(2010)] Hwang, H. S., et al. 2010, MNRAS, 409, 75
- [Ishihara et al.(2010)] Ishihara, D., et al. 2010, A&A, 514, A1
- [Issa et al.(1990)] Issa, M. R., MacLaren, I., & Wolfendale, A. W. 1990, A&A, 236, 237
- [James et al.(2002)] James, A., Dunne, L., Eales, S., & Edmunds, M. G. 2002, MNRAS, 335, 753
- [Kauffmann et al.(2003)] Kauffmann, G., et al. 2003, MNRAS, 341, 33
- [Kawada et al.(2007)] Kawada, M., et al. 2007, PASJ, 59, 389
- [Kennicutt(1998)] Kennicutt, R. C., Jr. 1998, ApJ, 498, 541 (K98)
- [Kent et al.(2008)] Kent, B. R., et al. 2008, AJ, 136, 713
- [Kovács et al.(2006)] Kovács, A., Chapman, S. C., Dowell, C. D., Blain, A. W., Ivison, R. J., Smail, I., & Phillips, T. G. 2006, ApJ, 650, 592
- [Kroupa(2001)] Kroupa, P. 2001, MNRAS, 322, 231
- [Lagache et al.(2003)] Lagache, G., Dole, H., & Puget, J.-L. 2003, MNRAS, 338, 555
- [Lehnert & Heckman(1996)] Lehnert, M. D., & Heckman, T. M. 1996, ApJ, 472, 546 (LH96)
- [Li & Draine(2001)] Li, A., & Draine, B. T. 2001, ApJ, 554, 778
- [Małek et al.(2010)] Małek, K., Pollo, A., Takeuchi, T. T., Bienias, P., Shirahata, M., Matsuura, S., & Kawada, M. 2010, A&A, 514, A11
- [Malhotra(1994)] Malhotra, S. 1994, ApJ, 433, 687
- [Malhotra(1995)] Malhotra, S. 1995, ApJ, 448, 138
- [Mathis et al.(1983)] Mathis, J. S., Mezger, P. G., & Panagia, N. 1983, A&A, 128, 212
- [Meyer et al.(2004)] Meyer, M. J., et al. 2004, MNRAS, 350, 1195
- [Moustakas et al.(2010)] Moustakas, J., Kennicutt, R. C., Jr., Tremonti, C. A., Dale, D. A., Smith, J.-D. T., & Calzetti, D. 2010, ApJS, 190, 233
- [Muñoz-Mateos et al.(2009)] Muñoz-Mateos, J. C., et al. 2009, ApJ, 701, 1965
- [Murakami et al.(2007)] Murakami, H., et al. 2007, PASJ, 59, 369
- [Nair et al.(2010)] Nair, P. B., van den Bergh, S., & Abraham, R. G. 2010, ApJ, 715, 606
- [Onaka et al.(2007)] Onaka, T., et al. 2007, PASJ, 59, 401
- [Phillipps & Disney(1988)] Phillipps, S., & Disney, M. 1988, MNRAS, 231, 359
- [Press et al. (2007)] Press, W.H., Teukolsky, S.A., Vetterling, W.T., & Brian P. Flannery, B.P. 2007, Numerical Recipes 3rd Edition: The Art of Scientific Computing (Cambridge Univ. Press)
- [Rachford et al.(2009)] Rachford, B. L., et al. 2009, ApJS, 180, 125
- [Rosenberg & Schneider(2003)] Rosenberg, J. L., & Schneider, S. E. 2003, ApJ, 585, 256
- [Rubin et al.(2009)] Rubin, D., et al. 2009, A&A, 494, 647
- [Rujopakarn et al.(2011a)] Rujopakarn, W., Rieke, G. H., Eisenstein, D. J., & Juneau, S. 2011a, ApJ, 726, 93
- [Rujopakarn et al.(2011b)] Rujopakarn, W., Rieke, G. H., Weiner, B. J., et al. 2011b, arXiv:1107.2921
- [Salim et al.(2007)] Salim, S., et al. 2007, ApJS, 173, 267
- [Salim et al.(2009)] Salim, S., et al. 2009, ApJ, 700, 161
- [Salpeter(1955)] Salpeter, E. E. 1955, ApJ, 121, 161
- [Schmidt(1959)] Schmidt, M. 1959, ApJ, 129, 243
- [Silk(2011)] Silk, J. 2011, arXiv:1102.0283
- [Silva et al.(1998)] Silva, L., Granato, G. L., Bressan, A., & Danese, L. 1998, ApJ, 509, 103
- [Soifer et al.(1987)] Soifer, B. T., Sanders, D. B., Madore, B. F., Neugebauer, G., Danielson, G. E., Elias, J. H., Lonsdale, C. J., & Rice, W. L. 1987a, ApJ, 320, 238
- [Soifer et al.(1987)] Soifer, B. T., Neugebauer, G., & Houck, J. R. 1987b, ARA&A, 25, 187
- [Soifer & Neugebauer(1991)] Soifer, B. T., & Neugebauer, G. 1991, AJ, 101, 354
- [Springob et al.(2005)] Springob, C. M., Haynes, M. P., Giovanelli, R., & Kent, B. R. 2005, ApJS, 160, 149
- [Stierwalt et al.(2009)] Stierwalt, S., Haynes, M. P., Giovanelli, R., Kent, B. R., Martin, A. M., Saintonge, A., Karachentsev, I. D., & Karachentseva, V. E. 2009, AJ, 138, 338
- [Strateva et al.(2001)] Strateva, I., et al. 2001, AJ, 122, 1861
- [Sun & Hirashita(2011)] Sun, A.-L., & Hirashita, H. 2011, MNRAS, 411, 1707
- [Takagi et al.(2003a)] Takagi, T., Vansevicius, V., & Arimoto, N. 2003a, PASJ, 55, 385
- [Takagi et al.(2003b)] Takagi, T., Arimoto, N., & Hanami, H. 2003b, MNRAS, 340, 813
- [Takeuchi et al.(2001)] Takeuchi, T. T., Ishii, T. T., Hirashita, H., Yoshikawa, K., Matsuhara, H., Kawara, K., & Okuda, H. 2001, PASJ, 53, 37
- [Takeuchi et al.(2005)] Takeuchi, T. T., Buat, V., & Burgarella, D. 2005, A&A, 440, L17
- [Takeuchi et al.(2010)] Takeuchi, T. T., Buat, V., Heinis, S., Giovannoli, E., Yuan, F.-T., Iglesias-Páramo, J., Murata, K. L., & Burgarella, D. 2010, A&A, 514, A4
- [Tojeiro et al.(2009)] Tojeiro, R., Wilkins, S., Heavens, A. F., Panter, B., & Jimenez, R. 2009, ApJS, 185, 1
- [Totani & Takeuchi(2002)] Totani, T., & Takeuchi, T. T. 2002, ApJ, 570, 470
- [Tremonti et al.(2004)] Tremonti, C. A., et al. 2004, ApJ, 613, 898
- [Valiante et al.(2009)] Valiante, E., Lutz, D., Sturm, E., Genzel, R., & Chapin, E. L. 2009, ApJ, 701, 1814
- [van der Kruit & Freeman(2011)] van der Kruit, P. C., & Freeman, K. C. 2011, arXiv:1101.1771
- [Vladilo et al.(2006)] Vladilo, G., Centurión, M., Levshakov, S. A., Péroux, C., Khare, P., Kulkarni, V. P., & York, D. G. 2006, A&A, 454, 151
- [Walcher et al.(2011)] Walcher, J., Groves, B., Budavári, T., & Dale, D. 2011, Ap&SS, 331, 1
- [Walterbos & Greenawalt(1996)] Walterbos, R. A. M., & Greenawalt, B. 1996, ApJ, 460, 696
- [Weingartner & Draine(2001)] Weingartner, J. C., & Draine, B. T. 2001, ApJ, 548, 296
- [West et al.(2010)] West, A. A., Garcia-Appadoo, D. A., Dalcanton, J. J., Disney, M. J., Rockosi, C. M., Ivezić, Ž., Bentz, M. C., & Brinkmann, J. 2010, AJ, 139, 315
- [Wolfire et al.(1995)] Wolfire, M. G., Hollenbach, D., McKee, C. F., Tielens, A. G. G. M., & Bakes, E. L. O. 1995, ApJ, 443, 152
- [Wu et al.(2005)] Wu, J., Evans, N. J., II, Gao, Y., Solomon, P. M., Shirley, Y. L., & Vanden Bout, P. A. 2005, ApJ, 635, L173
- [Yamamura et al. (2010)] Yamamura, I., et al. 2010, AKARI-FIS Bright Source Catalogue Release Note Version 1.0
- [Yuan et al.(2011)] Yuan, F.-T., Takeuchi, T. T., Buat, V., Heinis, S., Giovannoli, E., Murata, K. L., Iglesias-Páramo, J., & Burgarella, D. 2011, to appear in PASJ