The LUNA Collaboration
The 14N(p,)15O reaction studied with a composite germanium detector
Abstract
The rate of the carbon-nitrogen-oxygen (CNO) cycle of hydrogen burning is controlled by the 14N(p,)15O reaction. The reaction proceeds by capture to the ground states and several excited states in 15O. In order to obtain a reliable extrapolation of the excitation curve to astrophysical energy, fits in the R-matrix framework are needed. In an energy range that sensitively tests such fits, new cross section data are reported here for the four major transitions in the 14N(p,)15O reaction. The experiment has been performed at the Laboratory for Underground Nuclear Astrophysics (LUNA) 400 kV accelerator placed deep underground in the Gran Sasso facility in Italy. Using a composite germanium detector, summing corrections have been considerably reduced with respect to previous studies. The cross sections for capture to the ground state and to the 5181, 6172, and 6792 keV excited states in 15O have been determined at 359, 380, and 399 keV beam energy. In addition, the branching ratios for the decay of the 278 keV resonance have been remeasured.
pacs:
25.40.Ep, 25.40.Lw, 26.20.Cd, 26.65.+tI Introduction
The stellar rate of the carbon-nitrogen-oxygen (CNO) cycle of hydrogen burning Bethe (1939); von Weizsäcker (1938) is controlled by the slowest process, the 14N(p,)15O reaction Iliadis (2007). In the Sun, hydrogen burning proceeds mainly by the competing proton-proton chain, and the CNO cycle contributes only 0.8% to the energy production Bahcall et al. (2005). However, solar CNO hydrogen burning gives rise to neutrino emission lines from the decay of 13N and 15O Bahcall et al. (2005). It has recently been suggested Haxton and Serenelli (2008) to use the expected CNO neutrino flux data from the Borexino detector Arpesella et al. (2008) and the planned SNO+ Chen (2005) detector to measure the abundance of carbon and nitrogen in the solar core. This would address the so-called solar metallicity problem Peña-Garay and Serenelli (2008); Serenelli et al. (2009), which is given by the fact that the new solar metallicities Asplund et al. (2009) lead to inconsistencies in the standard solar model. The correct interpretation of the expected CNO neutrino data requires, however, that the nuclear reaction rate of the CNO cycle, which is determined by the 14N(p,)15O cross section, be known with sufficient precision.
The 14N(p,)15O cross section can be parameterized using the astrophysical S-factor
| (1) |
with denoting the energy in the center of mass system in keV.
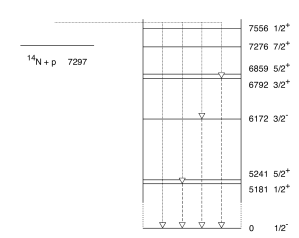
The excitation function has been studied previously (Lamb and Hester, 1957; Hebbard and Bailey, 1963; Schröder et al., 1987, e.g.), and these data determine the recommended value in the current nuclear reaction rate compilations for astrophysics Caughlan and Fowler (1988); Adelberger et al. (1998); Angulo et al. (1999). Subsequently, a number of new experimental and theoretical results on this reaction have been reported Bertone et al. (2001); Angulo and Descouvemont (2001); Mukhamedzhanov et al. (2003); Yamada et al. (2004); Formicola et al. (2004); Runkle et al. (2005); Imbriani et al. (2005); Schürmann et al. (2008); Marta et al. (2008, 2010), showing that the recommended value of the reaction rate Caughlan and Fowler (1988); Adelberger et al. (1998); Angulo et al. (1999) has to be revised downward by a factor of two. In particular, capture to the ground state in 15O (fig. 1) was shown to be strongly suppressed Bertone et al. (2001); Angulo and Descouvemont (2001); Mukhamedzhanov et al. (2003); Yamada et al. (2004); Formicola et al. (2004); Runkle et al. (2005); Imbriani et al. (2005). This reduction is now adopted in a very recent compilation Adelberger et al. (2010). However, some open questions remain.
In particular, two groups have in recent years presented cross section data and performed R-matrix fits based on their new data: LUNA Formicola et al. (2004); Imbriani et al. (2005) and TUNL Runkle et al. (2005). These two works show excellent agreement when it comes to the most important contribution to the total S-factor, namely capture to the state at 6792 keV: 1.200.05 keV barn Imbriani et al. (2005) and 1.150.05 keV barn Runkle et al. (2005), respectively. However, their results differ by much more than the quoted uncertainties when it comes to the second most important contribution, capture to the ground state: Whereas LUNA reported111 denotes the S-factor, extrapolated to zero energy, for capture to the state at keV in 15O. and refer to ground state capture and to the total S-factor, respectively. (0) = 0.250.06 keV barn Formicola et al. (2004), the TUNL value is double that, 0.490.08 keV barn Runkle et al. (2005). This discrepancy amounts to about 15% of the total extrapolated , dominating the uncertainty.
The only significant methodical difference between the two fits from LUNA Formicola et al. (2004); Imbriani et al. (2005) and TUNL Runkle et al. (2005) is the treatment of high-energy data. The LUNA fit is a global fit, based on the LUNA data presented in the same paper, and on the Schröder et al. data Schröder et al. (1987) which had been corrected for the summing-in effect. The TUNL fit, on the other hand, is a partial fit based solely on the TUNL data presented in the same paper, with the higher-energy R-matrix poles kept fixed based on a previous fit of the Schröder et al. data Schröder et al. (1987). The starting values and general procedure for both fits are otherwise the same Angulo and Descouvemont (2001).
The experimental data points by LUNA Formicola et al. (2004); Imbriani et al. (2005) and TUNL Runkle et al. (2005) are generally in agreement with each other, but they show some systematic uncertainty due to the fact that both groups had employed large germanium detectors in close geometry. This arrangement had been chosen in order to obtain a high enough detection efficiency for the weak ground state capture line. However, in this way both groups also incurred true coincidence summing-in corrections of more than 100% for the ground state data. Such a large correction entails considerable systematic uncertainty.
The aim of the present work is to address the conflicting extrapolations Formicola et al. (2004); Runkle et al. (2005) in two ways. The experimental problem of the previous high summing-in correction is solved by using a Clover detector. The problem of the selection of the database is solved by providing the ground state cross section relative to that for the well-known capture to the state at 6792 keV. The present relative data can then be added to one particular data set without introducing additional scaling uncertainty. Alternatively, they can be rescaled to absolute data using an overall fit of 6792 keV capture based on several independent works, strongly reducing the scaling uncertainty.
For the present experiment, the energy range of = 317-353 keV has been selected, far enough above the 259 keV resonance to limit resonant contributions, and at the same time a region where a sensitive minimum Angulo and Descouvemont (2001) of R-matrix fits is observed. In principle, such a measurement would also have been possible at 170 keV, in a second sensitive minimum. However, the yield is a factor 100 lower there, so that the present energy range was chosen for practical purposes.
The present relative cross section data have been published previously in abbreviated form Marta et al. (2008). The present work provides full details of that experiment and analysis. In addition, new branching ratios for the decay of the 259 keV resonance obtained in even farther geometry are presented here. The absolute off-resonance 14N(p,)15O cross section for capture to the ground state and the 5181, 6172, and 6792 keV excited states is derived at = 359, 380, and 399 keV. In order to improve the reliability, this latter analysis is performed in two independent ways, namely by the -line shape method Formicola et al. (2003) and by the classical peak integral approach.
II Experiment
The experiment was performed in the Laboratory for Underground Nuclear Astrophysics (LUNA) at the Gran Sasso National Laboratory (Italy) Costantini et al. (2009); Broggini et al. (2010). At the LUNA site, the -ray laboratory background for 3 MeV is strongly reduced due to the rock overburden equivalent to 3800 meters water Bemmerer et al. (2005); Szücs et al. (2010). Also for 3 MeV with proper shielding the -ray background has been found to be much lower than in comparable laboratories at the surface of the Earth Caciolli et al. (2009). The unique location of LUNA has enabled the study of several nuclear reactions of astrophysical importance Bonetti et al. (1999); Formicola et al. (2004); Imbriani et al. (2004); Lemut et al. (2006); Bemmerer et al. (2006, 2009); Limata et al. (2010).
II.1 Setup
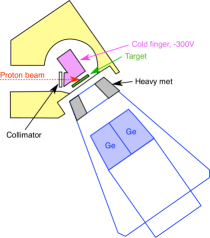
The LUNA2 400 kV accelerator Formicola et al. (2003) provided a H+ beam of = 359, 380, and 399 keV, with 0.25-0.45 mA intensity. The ion beam passed a collimator of 5 mm diameter, which absorbed a few percent of the full beam intensity, and a cold trap cooled by liquid nitrogen (fig. 2), before hitting the target. Secondary electrons emitted from the target surface were suppressed by applying - 300 V suppression voltage to the cold trap. The reproducibility of the current from run to run is estimated to be 2%.
II.2 Target
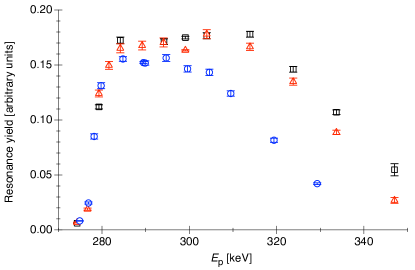
A titanium nitride target produced by reactive sputtering at Laboratori Nazionali di Legnaro was used for the experiments. The target had 60 keV energetic width at the = 278 keV resonance (fig. 3), when irradiated under 55∘ angle. In order to obtain its stoichiometry, the stopping power at the resonance energy, the beam current and the strength of the monitor resonance must be known. For the stopping of protons in titanium and nitrogen, the values from the software Ziegler (2008) have been used. For the strength of the resonance, = 13.10.6 meV was adopted, the recommended value from Ref. Adelberger et al. (2010). Based on this number, a stoichiometric ratio Ti:N of 1:0.93 has been determined. The target stoichiometry gives rise to 6% systematic uncertainty in the absolute cross section results, mainly from the reference value.
In order to properly correct for the change of the target under intense proton bombardment, during the experiment the target profile was monitored every day by scanning the = 278 keV resonance (fig. 3). The sharp low-energy edge of the profile is given by the convolution of the 0.1 keV energy spread of the beam Formicola et al. (2003) and the 1.06 keV natural width of the resonance Ajzenberg-Selove (1991). On the ensuing constant plateau, the step height is proportional to the inverse of the effective stopping power per 14N nucleus in the compound.
A reduction of up to 7% in the integral of the target profile was observed from day to day, with a typical proton dose of 24 C (1.5 1020 H+ ions) deposited on the target per day. It is estimated that the target composition is known with 5% precision for any given time during the experiment.
II.3 Detection of emitted -rays
The -rays emitted from the target were detected in a Eurisys Clover-BGO detection system Elekes et al. (2003) placed at an angle of 55∘ with respect to the beam axis. The front end of the Clover detectors was at 9.5 cm distance from the target. For the branching-ratio measurement (sec. III.4), the front end was placed at 19.5 cm distance from the target instead.
The output signal from each of the four Clover crystals was split into two branches called branch ’S’ and branch ’A’. For branch ’S’, each of the four signals was amplified and digitized separately, and the four spectra were gainmatched and summed in the offline analysis, giving the so-called singles mode.
For branch ’A’, the preamplifier output signals were gain-matched and added in a homemade analog summing unit. The added signal was then amplified and digitized, giving the so-called addback mode spectra. Typical resolutions for addback (singles) mode were 9 keV (3.3 keV) at 1.3 MeV and 12 keV (6 keV) at 6.8 MeV. For experiments off the 259 keV resonance, the addback mode data were recorded in anticoincidence with the BGO escape-suppression shield to reduce the Compton background.
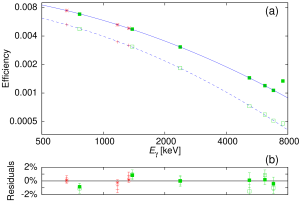
The -ray detection efficiency was measured using 137Cs and 60Co radioactive sources calibrated to 1.5% and 0.75% (1 confidence range), respectively. The efficiency curve (fig. 4, upper panel) was then extended to high energy based on spectra recorded at the 259 keV 1/2+ resonance, using the known 1:1 -ray cascades for the excited states at 6172 and 6792 keV Ajzenberg-Selove (1991). The -rays from the decay of this 1/2+ resonance are isotropic Ajzenberg-Selove (1991). The angular correlations of 8-10% between primary and secondary -ray are experimentally well known Povh and Hebbard (1959). They result in up to 0.4% correction on the efficiency curve, because they affect the summing-out correction. For the worst case, the 6792 keV -ray, the calculated summing-out correction is 3.6% in addback mode (1.1% in singles mode), with an assumed relative uncertainty of 20%. This result is consistent with a GEANT4 Agostinelli et al. (2003) simulation showing (4.51.8)% correction.
III Data analysis and results
The first part of the analysis concentrated on the ratio of the cross sections for radiative proton capture to the ground state and the fourth excited state at 6792 keV in 15O, determined with the detector at 9.5 cm distance from the target. These relative data have been reported previously in abbreviated form Marta et al. (2008) and are discussed in details in sec. III.1. Subsequently, also absolute cross section data for the four most important -transitions are derived from the spectra. This analysis is performed both by classical peak integrals for the addback mode data (sec. III.2), and by -line shape analysis for the singles mode data (sec. III.3). Finally, by moving the detector to 19.5 cm distance from the target, more precise branching ratios for the decay of the 259 keV resonance are presented (sec. III.4).
III.1 Ratio of the cross sections for capture to the ground state and the 6792 keV excited state in 15O
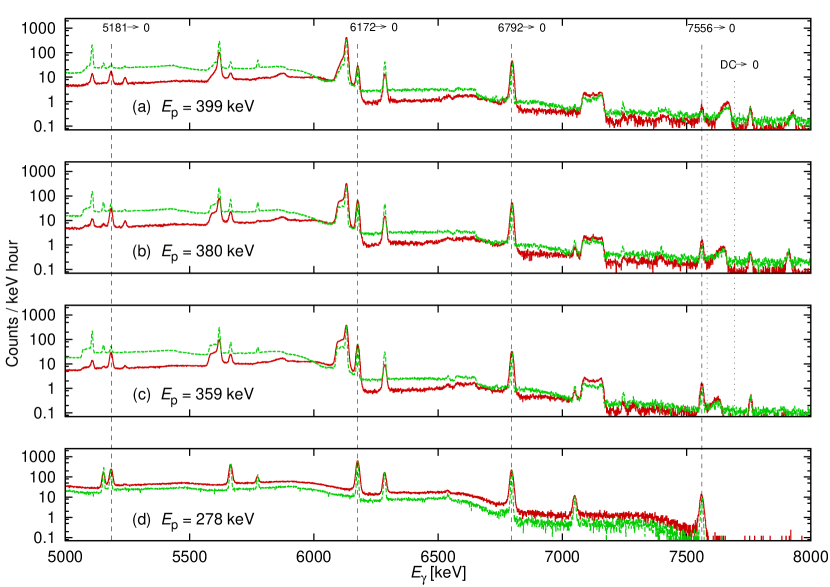
For the relative analysis, the number of counts in the ground state capture peak at 7600 keV is compared with the number of counts in the secondary -ray at 6792 keV (fig. 5). In such an analysis, only the relative uncertainty when extending the efficiency curve over this limited energy range contributes to the uncertainty of the ratio (0.8% effect).
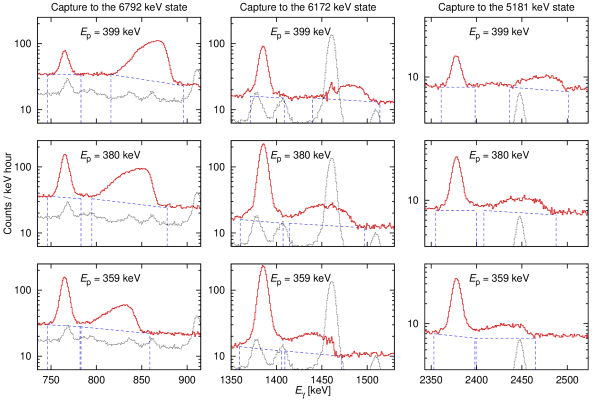
The 6792 keV counting rate contains some on-resonant contribution. This is due to the 60 keV (full width at half maximum) thick target. When the beam slows down to the strong resonance at = 278 keV, it still finds some TiN in the tail of the target. In order to correct for this effect, the primary -rays for capture to this level are analyzed, as well, and the 6792 keV counting rate is rescaled with the resonant/off-resonant ratio as obtained from the low-energy primaries (fig. 6). The reduction in 6792 keV counting rate by the escape-suppression shield contributes 1.2% to the final uncertainty, and the summing-out correction for this peak contributes 0.6%.
Based on these data, the ratio
| (2) |
has been calculated (table 1). The present data supersede the data published previously in abbreviated form Marta et al. (2008), due to an upgraded background determination (fig. 6, blue dashed lines), described in section III.2. The ratio depends only on the counting rates for the 7600 keV ground state capture -ray, for the = 6792 keV -ray (corrected for resonant capture as described above), and on the ratio of the -detection efficiencies at 7600 and 6792 keV. For the ground state capture -ray, a summing-in correction of up to 30% (4.3%) for addback (singles) mode was taken into account (table 1, last column).
| [keV] | mode | stat. | syst. | Summing-in | |
|---|---|---|---|---|---|
| [10-2] | uncertainty | correction | |||
| 315.31.3 | addback | 5.24 | 11% | 5.4% | 30% |
| singles | 5.22 | 15% | 2.7% | 4.3% | |
| 333.11.0 | addback | 5.33 | 4.8% | 3.9% | 21% |
| singles | 5.58 | 11% | 2.5% | 3.4% | |
| 353.31.0 | addback | 5.20 | 3.5% | 3.5% | 19% |
| singles | 5.43 | 8.0% | 2.3% | 3.2% | |
When computing , the current measurement and the target stoichiometry and profile cancel out, eliminating the major sources of uncertainty. Therefore, the relative analysis method allows to derive data with much better precision than for absolute data. The present relative data can then be rescaled with averaged data for the well-studied cross section for capture to the 6792 keV state, and uniquely precise data for capture to the ground state can be obtained.
The effective interaction energies have been determined for each -line with two methods: First, the centroid of the off-resonant primary -line has been used, taking into account the reaction -value and -level energies. Second, the average energy, weighted with the predicted counts from the known target profile and the expected energy dependence of the cross section from the R-matrix S-factor curve Imbriani et al. (2005). The two values were never more than 2.6 keV apart, and their average was adopted for each line. The results are slightly different for ground state capture and capture to the 6792 keV state, because the S-factor curve from previous R-matrix fits has a different slope for these two transitions. Therefore, the average of the two values is adopted as effective energy to be connected with the cross section ratio , with the assigned 1 error bar covering both effective energy values.
For the relative data, the total systematic uncertainty is 3.5 - 5.4% in addback mode (table 2). For singles mode, due to the lower summing corrections, it is 2.3 - 2.7%.
For all three data points, the addback and singles mode data are in good agreement. Due to the higher -efficiency of the addback mode data (which, in turn, is due to the well-known addback factor of Clover-type detectors Duchêne et al. (1999), which has been redetermined for the present detector and geometry Szücs et al. (2010)) and due to the background reduction achieved by the escape-suppression shield for the addback mode data, the addback data have much better statistics than the singles mode. Therefore, the addback data are adopted for the further analysis despite their slightly higher systematic uncertainty.
III.2 Absolute cross sections based on the peak integrals of the addback mode data
As a second step, the absolute cross section for capture to the excited states at 5181, 6172, and 6792 keV and to the ground state of 15O has been derived, accepting that the systematic uncertainty (table 2) includes now also the contributions from current measurement, target stoichiometry and profile, and absolute detection efficiency. Only the addback mode data were considered.
In order to obtain the net counting rate, a straight-line background based on two flat regions to the left and right of the region of interest (ROI) has been subtracted from the integral over the ROI. This procedure was applied for every secondary except for the decay of the 6172 keV excited state, where a different method was applied. It was repeated for each transition of the run at 399 keV, both for the primary (resonant and non-resonant) and secondary -rays.
However, in many cases it was not possible to apply this method of background determination: At = 359 and 380 keV, the off-resonant part of the primaries lie close to the resonant peak (fig. 6, second and third row). The secondary at 6172 keV was problematic, as well, due to the 19F(p,)16O background peak at 6130 keV (fig. 5). For these spectra, a different method was instead used to estimate the background: The ratio between the difference in average counts per channel observed to the left and right of the peak, and the net area of the peak itself, was calculated. The ratios observed on the resonance, where no additional resonant contribution exists and where beam-induced background is negligible, have then been used to calculate the background at the same -energy in the problematic spectra. For those problematic spectra, a minimum uncertainty of 5% has been assumed for the quantity subtracted from the raw integral of the ROI. Finally, it was ensured that the 1 uncertainty of the counts includes also results with different choices of background regions.
The net counting rate was then determined from the secondary -ray, rescaled for its non-resonant/resonant contributions determined by the primary -rays. Based on the counting rate, the target stoichiometry and profile (sec. II.2, fig. 3), the beam current measurement, and the -detection efficiency (fig. 4), the cross section was calculated for these transitions. The angular distribution was assumed to exhibit negligible contributions from all Legendre polynomials except for zero and second order. The second order Legendre polynomial cancels out at the present detection angle of 55∘.
For the determination of the astrophysical S-factor from a single data point, it is necessary to make some assumption on the relative shape of the S-factor curve. For the present analysis, the S-factor was assumed to vary over the target thickness as given by the previous LUNA R-matrix curve Imbriani et al. (2005). In order to check the uncertainty introduced by this assumption, the present analysis was repeated assuming a flat S-factor, and the full difference (1-9%, depending on the transition and beam energy) was adopted as systematic uncertainty. The effective interaction energy Rolfs and Rodney (1988) was calculated based on the known target profile and the assumed S-factor behaviour. The uncertainties are half of the difference obtained by using a flat S-factor instead of the LUNA’s curve Imbriani et al. (2005).
| Affecting data… | Description | Amount | |
| Relative | Absolute | Summing-in, ground state line | 3-5% |
| Relative | Absolute | Escape-suppression efficiency | 1.2% |
| Relative | Absolute | Slope of -efficiency curve | 0.8% |
| Relative | Absolute | Summing-out | 0.6% |
| Absolute | Target, original stoichiometry | 6% | |
| Absolute | Target, profile change | 5% | |
| Absolute | Assumption on S-factor slope | 1-9% | |
| Absolute | Beam current reproducibility | 2% | |
| Absolute | Normalization of -efficiency | 1.8% | |
| Relative | Total, addback mode | 3.5-5.4% | |
| Absolute | Total, addback mode | 9-12% | |
III.3 Absolute cross sections based on the -line shape analysis of the singles mode data
Subsequently, the absolute cross section for capture to the excited states at 5181, 6172, and 6792 keV and to the ground state of 15O has also been calculated based on the -line shape analysis approach. To this end, only the singles mode data, which are essentially free from summing corrections, have been used. This approach is thus complementary to the one described in the previous section, which calculated peak integrals and used only the addback mode data.
The -line shape analysis method has been described previously in details Formicola et al. (2003, 2004); Imbriani et al. (2005), so it will only be outlined here. The analysis of the line shape of the primary -ray is possible because the observed line shape of a primary transition is determined by the cross section behavior in the proton energy interval spanned by the incident beam during the slowing-down process in the target. Each center-of-mass beam energy (at which the reaction takes place) corresponds to a -ray energy
| (3) |
with the reaction -value, the energy of the excited state, and the appropriate Doppler and recoil corrections. The -line shape is also influenced by the energy loss of the protons in the target, because the stopping power of the protons in titanium nitride is a function of proton energy Ziegler (2008).
The number of counts Ni in channel i of the -spectrum, corresponding to the energy bin [,+], where is the dispersion in units of keV per channel, is given by the expression
| (4) |
for . Here is the center-of-mass proton energy corresponding to channel , is the incident proton energy in the center-of-mass, is the cross section under study, is the -ray detection efficiency, is the stopping power and bk is the branching of the transition under study. The conversion from Eγ,i to Ei includes the Doppler and recoil effects, as shown in eq. (3). The resulting count rate is folded with the known energy resolution of the -ray detector to obtain the experimental line-shape.
To facilitate the fit, the cross section entering into eq. (4) is then parameterized, in the limited energy window defined by the target thickness , as the sum of a resonant term described by the Breit-Wigner formula, and a non-resonant term, for which a constant astrophysical S-factor is assumed:
| (5) |
Here, is the de Broglie wavelength, the strength value of the 259 keV resonance (here, 12.9 meV was used Imbriani et al. (2005), very close to the recently recommended value of 13.1 meV Adelberger et al. (2010)), the energy of the resonance, the energy-dependent total width of the resonance, and is the Sommerfeld parameter. Since the branching ratios and the of the resonance are kept fixed, the free parameters in this procedure are the non-resonant S-factor , the background parameters and the energy of the beam. They are fitted to best reflect the shape of the primary -line by reducing the . After the fit has converged, the cross section under study here is given by the average of the values, weighted for their contribution to the total statistics.
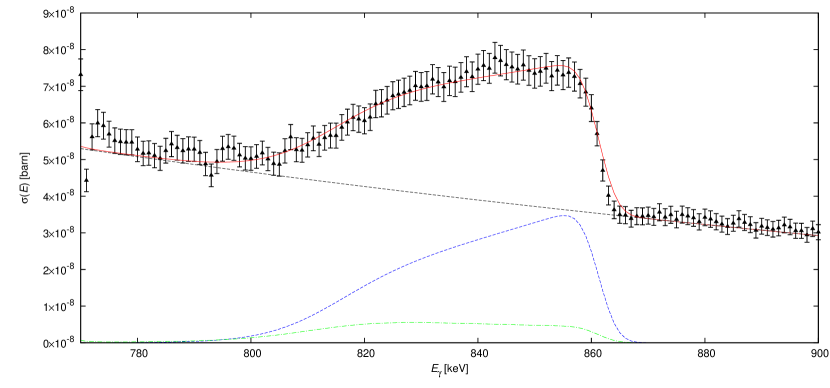
Figure 7 shows a typical case for the primary -ray spectrum, together with the fit described above. The drop in the -ray yield towards lower energies reflects mainly the drop of the cross section due to the lower Coulomb barrier penetrability at lower energy. The energy of the high energy edge of the peak provides an independent cross-check on the assumed beam energy from the accelerator energy calibration Formicola et al. (2003). Possible variations of the stoichiometry of the titanium nitride target during the beam bombardment have been monitored as described above (sec. II.2 and fig. 3).
The final astrophysical S-factor obtained from the line-shape analysis described in the present section was found to be in excellent agreement with the data from the peak-integral approach described in the previous section. It should be noted that while the present line-shape analysis is based on the singles mode spectra, the peak integral analysis is based on the addback mode data. The agreement between these two approaches confirms their reliability.
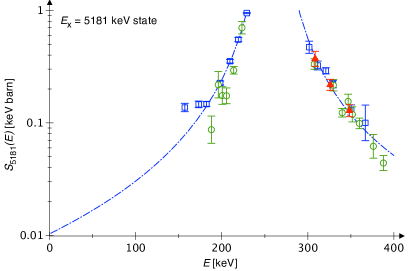
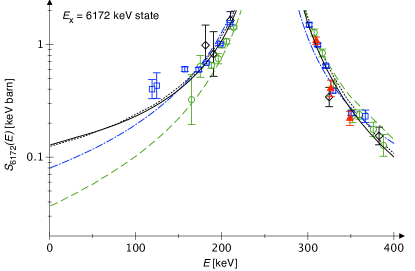
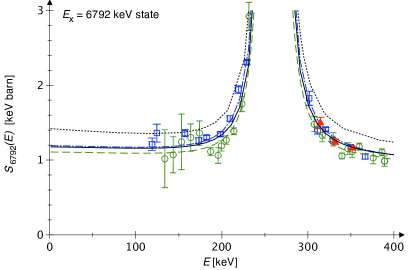
The final S-factor values from the present experiment are obtained by forming the simple average value of the two approaches (secs. III.2 and III.3). The data are summarized in table 3 and plotted in fig. 8.
| Capture to ground state | Capture to 5181 keV state | Capture to 6172 keV state | Capture to 6792 keV state | ||||||||||||
|---|---|---|---|---|---|---|---|---|---|---|---|---|---|---|---|
| 314.61.0 | 0.074 | 11% | 12% | 310.62.2 | 0.370 | 16% | 11% | 310.51.0 | 1.072 | 8% | 12% | 315.91.3 | 1.495 | 5.0% | 9% |
| 333.61.0 | 0.061 | 5% | 11% | 327.61.6 | 0.218 | 12% | 12% | 326.61.0 | 0.406 | 18% | 12% | 332.61.0 | 1.245 | 3.0% | 9% |
| 353.91.0 | 0.061 | 4% | 10% | 350.92.5 | 0.128 | 13% | 10% | 351.12.2 | 0.220 | 15% | 10% | 352.71.0 | 1.157 | 1.7% | 9% |
III.4 Branching ratios for the decay of the 259 keV resonance, obtained in far distance
In order to determine the branching ratios for the decay of the 259 keV resonance ( = 7556 keV in 15O), the Clover detector was moved to a farther geometry, with its front face at 19.5 cm distance from the target position, again at an angle of 55∘ with respect to the beam direction. For the branching ratio analysis, both addback and singles mode data have been analyzed and were found to agree within their statistical uncertainty in all cases. In the following text, only the singles mode data will be discussed.
The detection efficiency was again established as described above (sec. II.3), with an analogous quality of the efficiency curve as the one shown for the 9.5 cm geometry (fig. 4). It should be noted that the efficiency curve does not depend on the branching ratios, just on the assumption of 1:1 cascade ratios without feeding or intermediate decay corrections for the two transitions through the states at 6172 and 6792 keV, and on the assumption of isotropy Povh and Hebbard (1959).
For the determination of the decay branchings of the 259 keV resonance, only the secondary -rays at 5181, 5241, 6172, and 6792 keV and the ground state primary -ray at 7556 keV were used (fig. 5, bottom panel). Therefore only the relative -efficiency in the limited energy range 5181-7556 keV is needed. Owing to the good quality of the -efficiency curve, over this limited energy range the efficiencies relative to the 6172 keV normalization point are known on the level of 0.5%, enabling a precise determination of the branching ratios.
For the major transitions through the excited states at 5181, 6172, and 6792 keV, the present branching ratios (tab. 4) are in excellent agreement with the modern literature Runkle et al. (2005); Imbriani et al. (2005). However, some minor discrepancies arise when it comes to the minor transitions.
The ground state transition has been the subject of discussion in recent years. It is now well-known that the previously accepted value of (3.50.5)% Tabata and Okano (1960); Hebbard and Bailey (1963); Ajzenberg-Selove (1991) was much too high, probably due to summing-in. The two most recent previous branching ratio measurements Runkle et al. (2005); Imbriani et al. (2005) were both performed at about 20 cm distance, where there is still more than 10% summing-in correction. The present value of (1.490.04)% has been obtained at 19.5 cm distance, with just 2.0% summing-in correction for the singles mode data, much less than in previous works. Note that the value (1.530.06)% from an abbreviated version of the present work Marta et al. (2008) had been obtained in closer geometry, at 9.5 cm distance, with 7.4% summing-in correction. The present (1.490.04)% ground state branching supersedes all previous LUNA branching ratio measurements of the 259 keV resonance, i.e. Imbriani et al. (2005); Marta et al. (2008).
For the transition to the 5241 keV state, the previous (0.60.3)% value Imbriani et al. (2005) was possibly affected by feeding through higher-lying excited states. Based on the difference between 5241 0 and 7556 5241 -rays, this feeding contribution amounts to (0.200.10)% of the total decay branching. It is probably due to the 6859 keV state, which decays to 100% to the 5241 keV state Ajzenberg-Selove (1991). However, such a weak feeding could possibly also arise through the 6172 or 6792 keV states, so in absence of conclusive evidence this (0.200.10)% is not assigned to any transition.
For the transition to the 5181 keV state, the present data confirms the slightly higher modern values Runkle et al. (2005); Imbriani et al. (2005) with respect to the compilation Ajzenberg-Selove (1991).
| Branching [%] | |||||||||
| Ajzenberg- | TUNL Runkle et al. (2005) | LUNA Imbriani et al. (2005) | LUNA, | ||||||
| Selove Ajzenberg-Selove (1991) | present work | ||||||||
| 7556 | 0 | 3.5 | 0.5 | 1.70 | 0.07 | 1.6 | 0.1 | 1.49 | 0.04 |
| 5181 | 15.8 | 0.6 | 17.3 | 0.2 | 17.1 | 0.2 | 17.3 | 0.2 | |
| 5241 | 0.6 | 0.3 | 0.15 | 0.03 | |||||
| 6172 | 57.5 | 0.4 | 58.3 | 0.5 | 57.8 | 0.3 | 58.3 | 0.4 | |
| 6792 | 23.2 | 0.6 | 22.7 | 0.3 | 22.9 | 0.3 | 22.6 | 0.3 | |
IV R-matrix analysis of ground state capture
For the purpose of an R-matrix analysis, the present relative data (sec. III.1, table 1) have been renormalized using a weighted average S-factor for capture to the 6792 keV state. Based on these values and the corrected Schröder data Schröder et al. (1987); Formicola et al. (2004), a new R-matrix fit for ground state capture has already been presented in the abbreviated form of the present work Marta et al. (2008). The present updated relative data are close to the values published in abbreviated form Marta et al. (2008), so this update does not warrant a revised fit.
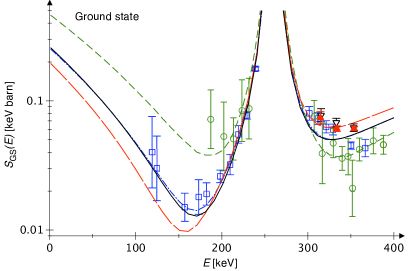
Also the present absolute data (sec. III.2) do not significantly deviate from the relative data, renormalized as stated above (fig. 8, bottom right panel). It should be noted that the present absolute data for capture to the 6792 keV state (fig. 8, bottom left panel) are in excellent agreement with previous data Runkle et al. (2005); Imbriani et al. (2005) and R-matrix fits Runkle et al. (2005); Imbriani et al. (2005), confirming that the renormalization procedure was adequate. By design the absolute data have higher uncertainty than the relative data (table 2) that have already been included in the fit Marta et al. (2008), so no new R-matrix fit is attempted here.
The previous fit Marta et al. (2008) is instead shown again here (fig. 8, bottom right panel), leading to (0) = 0.200.05 keV barn. That value is lower than the recently recommended 0.270.05 keV barn Adelberger et al. (2010), but still in agreement given the error bars. The difference is mainly due to the fact that in the present work, only the present and the Schröder Schröder et al. (1987) data (corrected for summing-in Formicola et al. (2004)) are included. The data from Refs. Imbriani et al. (2005); Runkle et al. (2005) are excluded due to concerns about the summing corrections. In Ref. Adelberger et al. (2010), instead, the data from Refs. Imbriani et al. (2005); Runkle et al. (2005) have also been included in the fit.
V Summary and outlook
The 14N(p,)15O reaction has been studied with a composite Clover-type detector at the LUNA underground facility at = 359, 380, and 399 keV, in an energy range important for future R-matrix fits of capture to the ground state in 15O. Precise cross section ratios for ground state capture relative to capture to the 6792 keV state have been presented, updating and extending their previous abbreviated publication Marta et al. (2008).
The present, precise relative cross section data (table 1) helped resolve the discrepancy between the previous, conflicting extrapolations for ground state capture Formicola et al. (2004); Runkle et al. (2005), in favour of Ref. Formicola et al. (2004). The present recommended value of (0) = 0.200.05 keV barn is based on a dataset where the summing-in correction is not larger than 50% Schröder et al. (1987) for the high-energy data and not larger than 30% for the present, lower-energy data.
The present absolute cross sections for capture to the excited states at 5181, 6172, and 6792 keV (fig. 8, table 3) have been obtained with two independent analysing methods (secs. III.2 and III.3). They are generally in good agreement with previous works Runkle et al. (2005); Imbriani et al. (2005) and in some cases more precise. They are in overall good agreement with the most recent R-matrix fit Adelberger et al. (2010). Because of their limited energy span, the present data alone cannot form the basis of new extrapolations. However, they may serve as useful reference points in an energy range that may be accessible not only at LUNA, but also at future underground accelerators.
The new branching ratios for the decay of the 259 keV resonance that are shown here improve the precision of the database for this resonance. Since this resonance is often used as normalization point for experimental work on the 14N(p,)15O reaction (Formicola et al., 2004; Runkle et al., 2005; Imbriani et al., 2005; Marta et al., 2010, e.g.), this improved information again facilitates future precision studies of this reaction.
The present data are an important ingredient in updates of the standard solar model Peña-Garay and Serenelli (2008); Haxton and Serenelli (2008); Serenelli et al. (2009). When experimental data for the flux of solar CNO neutrinos due to the -decay of 13N and 15O become available from Borexino Arpesella et al. (2008) or SNO+ Chen (2005), precise 14N(p,)15O cross sections may contribute to a direct measurement of the solar metallicity through a comparison of CNO and 8B neutrino fluxes Haxton and Serenelli (2008).
Possible next steps in improving the precision for the extrapolated S-factor of this reaction Adelberger et al. (2010) are to re-study the cross section at higher energies Marta et al. (2010), in order to improve the extrapolation, and a remeasurement of the strength of the 259 keV resonance.
Acknowledgements.
This work has been supported by INFN and in part by the EU (ILIAS-TA RII3-CT-2004-506222), OTKA (K68801 and NN 83261), and DFG (BE4100/2-1 and RO439/41-1).References
- Bethe (1939) H. Bethe, Phys. Rev. 55, 103 (1939).
- von Weizsäcker (1938) C.-F. von Weizsäcker, Phys. Z. 39, 633 (1938).
- Iliadis (2007) C. Iliadis, Nuclear Physics of Stars (Wiley-VCH, Weinheim, 2007).
- Bahcall et al. (2005) J. N. Bahcall, A. M. Serenelli, and S. Basu, Astrophys. J. 621, L85 (2005).
- Haxton and Serenelli (2008) W. C. Haxton and A. M. Serenelli, Astrophys. J. 687, 678 (2008).
- Arpesella et al. (2008) C. Arpesella et al., Phys. Rev. Lett. 101, 091302 (2008).
- Chen (2005) M. C. Chen, Nucl. Phys. B (Proc. Suppl.) 145, 65 (2005).
- Peña-Garay and Serenelli (2008) C. Peña-Garay and A. Serenelli, ArXiv e-prints (2008), eprint 0811.2424.
- Serenelli et al. (2009) A. M. Serenelli, S. Basu, J. W. Ferguson, and M. Asplund, Astrophys. J. Lett. 705, L123 (2009).
- Asplund et al. (2009) M. Asplund, N. Grevesse, A. J. Sauval, and P. Scott, Ann. Rev. Astron. Astroph. 47, 481 (2009).
- Lamb and Hester (1957) W. Lamb and R. Hester, Phys. Rev. 108, 1304 (1957).
- Hebbard and Bailey (1963) D. F. Hebbard and G. M. Bailey, Nucl. Phys. 49, 666 (1963).
- Schröder et al. (1987) U. Schröder et al., Nucl. Phys. A 467, 240 (1987).
- Caughlan and Fowler (1988) G. Caughlan and W. Fowler, At. Data Nucl. Data Tables 40, 283 (1988).
- Adelberger et al. (1998) E. Adelberger et al., Rev. Mod. Phys. 70, 1265 (1998).
- Angulo et al. (1999) C. Angulo et al., Nucl. Phys. A 656, 3 (1999).
- Bertone et al. (2001) P. Bertone et al., Phys. Rev. Lett. 87, 152501 (2001).
- Angulo and Descouvemont (2001) C. Angulo and P. Descouvemont, Nucl. Phys. A 690, 755 (2001).
- Mukhamedzhanov et al. (2003) A. Mukhamedzhanov et al., Phys. Rev. C 67, 065804 (2003).
- Yamada et al. (2004) K. Yamada et al., Phys. Lett. B 579, 265 (2004).
- Formicola et al. (2004) A. Formicola et al., Phys. Lett. B 591, 61 (2004).
- Runkle et al. (2005) R. C. Runkle et al., Phys. Rev. Lett. 94, 082503 (2005).
- Imbriani et al. (2005) G. Imbriani et al., Eur. Phys. J. A 25, 455 (2005).
- Schürmann et al. (2008) D. Schürmann, et al., Phys. Rev. C 77, 055803 (2008).
- Marta et al. (2008) M. Marta et al., Phys. Rev. C 78, 022802(R) (2008).
- Marta et al. (2010) M. Marta et al., Phys. Rev. C 81, 055807 (2010).
- Adelberger et al. (2010) E. Adelberger et al., Rev. Mod. Phys., in press (2010), eprint 1004.2318.
- Ajzenberg-Selove (1991) F. Ajzenberg-Selove, Nucl. Phys. A 523, 1 (1991).
- Formicola et al. (2003) A. Formicola et al., Nucl. Inst. Meth. A 507, 609 (2003).
- Costantini et al. (2009) H. Costantini et al., Rep. Prog. Phys. 72, 086301 (2009).
- Broggini et al. (2010) C. Broggini, D. Bemmerer, A. Guglielmetti, and R. Menegazzo, Annu. Rev. Nucl. Part. Sci. 60, 53 (2010).
- Bemmerer et al. (2005) D. Bemmerer et al., Eur. Phys. J. A 24, 313 (2005).
- Szücs et al. (2010) T. Szücs et al., Eur. Phys. J. A 44, 513 (2010).
- Caciolli et al. (2009) A. Caciolli et al., Eur. Phys. J. A 39, 179 (2009).
- Bonetti et al. (1999) R. Bonetti et al., Phys. Rev. Lett. 82, 5205 (1999).
- Imbriani et al. (2004) G. Imbriani et al., Astron. Astrophys. 420, 625 (2004).
- Lemut et al. (2006) A. Lemut, D. Bemmerer, et al., Phys. Lett. B 634, 483 (2006).
- Bemmerer et al. (2006) D. Bemmerer et al., Phys. Rev. Lett. 97, 122502 (2006).
- Bemmerer et al. (2009) D. Bemmerer et al., J. Phys. G 36, 045202 (2009).
- Limata et al. (2010) B. Limata et al., Phys. Rev. C 82, 015801 (2010).
- Ziegler (2008) J. Ziegler (2008), Software SRIM, URL http://www.srim.org.
- Ajzenberg-Selove (1991) F. Ajzenberg-Selove, Nucl. Phys. A 523, 1 (1991).
- Elekes et al. (2003) Z. Elekes et al., Nucl. Inst. Meth. A 503, 580 (2003).
- Povh and Hebbard (1959) B. Povh and D. F. Hebbard, Phys. Rev. 115, 608 (1959).
- Agostinelli et al. (2003) S. Agostinelli et al., Nucl. Inst. Meth. A 506, 250 (2003).
- Duchêne et al. (1999) G. Duchêne et al., Nucl. Inst. Meth. A 432, 90 (1999).
- Rolfs and Rodney (1988) C. Rolfs and W. Rodney, Cauldrons in the Cosmos (University of Chicago Press, Chicago, 1988).
- Tabata and Okano (1960) T. Tabata and K. Okano, J. Phys. Soc. Japan 15, 1552 (1960).