The VLT-FLAMES Tarantula Survey
II: R139 revealed as a massive binary system
We report the discovery that R139 in 30 Doradus is a massive spectroscopic binary system. Multi-epoch optical spectroscopy of R139 was obtained as part of the VLT-FLAMES Tarantula Survey, revealing a double-lined system. The two components are of similar spectral types; the primary exhibits strong C III emission and is classified as an O6.5 Iafc supergiant, while the secondary is an O6 Iaf supergiant. The radial-velocity variations indicate a highly eccentric orbit with a period of 153.9 days. Photometry obtained with the Faulkes Telescope South shows no evidence for significant variability within an 18 month period. The orbital solution yields lower mass limits for the components of and . As R139 appears to be the most massive binary system known to contain two evolved Of supergiants, it will provide an excellent test for atmospheric and evolutionary models.
Key Words.:
binaries: spectroscopic – stars: early-type – stars: individual: R139 – open clusters: individual: 30 Doradus1 Introduction
Massive binary stars provide vital insights to our understanding of massive-star evolution. This is primarily due to the accuracy with which their masses can be determined: an essential ingredient for understanding a wide range of stellar properties. Because of the additional constraints that can be placed on their age and evolution, these stars provide information on initial masses, chemical mixing and mass-loss (Moffat 2008; De Mink et al. 2009). In a broader context, they can then act as crucial calibration points for models of both stellar atmospheres and evolution.
From the catalogue of bright stars in the Magellanic Clouds by Feast et al. (1960), R139 has a -band magnitude of 12, making it one of the brightest objects in the 30 Doradus nebula111Other aliases of R139 include: Brey 86 (Breysacher 1981), Parker 952 (Parker 1993), BAT99-107 (Breysacher et al. 1999), and Selman 2 (Selman et al. 1999).. Walborn & Blades (1997) noted R139 as potentially one of the most massive stars in 30 Doradus, urging more detailed study.
Multi-epoch spectroscopy of R139 was obtained as part of the campaign by Moffat (1989). His mean radial velocity from observations in 1982 showed an offset of 100 kms-1 compared to the mean velocity from earlier data. He noted R139 as a single-lined binary, with a tentative period of 52.7 d adopted from a number of possible fits to the data. Schnurr et al. (2008b) presented spectroscopy of R139 from three observing seasons (spanning 2001 to 2003). While noting that the system displayed ‘slightly variable radial velocity’, it was concluded that R139 was single, citing the relatively large uncertainties in Moffat’s past work for the conflicting scenarios.
R139 has now been observed as part of the VLT-FLAMES Tarantula Survey222Observations obtained at the European Southern Observatory Very Large Telescope in programme 182.D-0222. (VFTS), an ESO Large Programme which has obtained multi-epoch spectroscopy of over 800 massive stars in 30 Doradus. A full overview of the survey is given by Evans et al. (Paper I, 2011), here we report on the discovery of R139 as a massive double-lined binary.
2 Observations
The observations of R139 are summarised in Table 1. The primary dataset of the VTFS has been obtained with the Giraffe spectrograph using the ‘Medusa’ fibre-fed mode of the FLAMES instrument on the Very Large Telescope (VLT). Details of the reductions and observational strategy can be found in Paper I, in which R139 is catalogued as object VTFS 527.
After the initial detection of binarity made from the FLAMES data, follow-up observations have been obtained on the 6.5m Magellan Clay Telescope with the MagE instrument, with X-Shooter on the VLT and also with FEROS on the MPG/ESO 2.2m telescope at La Silla333 FEROS observations obtained as part of programme 086.D-0997. All these follow-up observations provide coverage across the entire visible spectrum, with a typical signal-to-noise ratio of order 150 - although the FEROS data must be degraded to to achieve this.
| Epoch | Instrument / Setting | HJD +2400000 | HJD | |
|---|---|---|---|---|
| 1 | FLAMES / LR02 | 7,000 | 54748.7769a𝑎aa𝑎aThe FLAMES observations were comprised of back-to-back observations so only the mid-exposure HJD is given. | - |
| 2 | FLAMES / LR02 | 54748.8228 | 0.046 | |
| 3 | FLAMES / LR02 | 54749.7233 | 0.946 | |
| 4 | FLAMES / HR15N | 16,000 | 54749.7726 | 0.996 |
| 5 | FLAMES / LR03 | 8,500 | 54755.6882 | 6.911 |
| 6 | FLAMES / HR15N | 54810.6697 | 61.893 | |
| 7 | FLAMES / LR03 | 54810.7374 | 61.961 | |
| 8 | FLAMES / LR03 | 54810.7808 | 62.004 | |
| 9 | FLAMES / LR03 | 54810.8357 | 62.059 | |
| 10 | FLAMES / LR02 | 54837.6332 | 88.856 | |
| 11 | FLAMES / LR02 | 54868.5569 | 119.780 | |
| 12 | FLAMES / LR02 | 55112.8129 | 364.036 | |
| \hdashline13 | MagE / 1” slit | 4,500 | 55527.8017 | 779.025 |
| \hdashline14 | X-Shooter / 0.5” slit | 9,100b𝑏bb𝑏bThe resolving power quoted for X-shooter is that of the UV-arm only, which overlaps the LR02-03 regions of the FLAMES data. | 55580.5477 | 831.771 |
| 15 | X-Shooter | 55584.7076 | 835.931 | |
| 16 | X-Shooter | 55588.6922 | 839.915 | |
| \hdashline17 | FEROS | 48,000 | 55604.6909 | 855.936 |
| 18 | FEROS | 55605.5613 | 856.739 |
3 Results
3.1 Binary identification and spectral classification
Feast et al. (1960) described the spectrum of R139 as exhibiting ‘O-type absorption plus weak W emission’. Walborn & Blades (1997) argued that R139 has very strong Of emission features, classifying it as O7 Iafp, while Schnurr et al. (2008b) adopted the spectral type WN9h::a. This ambiguity has likely arisen because the emission features are the superposition from two similar stars. When observed at lower resolution, this would have falsely suggested enhanced emission or broadening of the lines.
The increased resolution and time-sampling of the new data have revealed that many of R139’s prominent emission and absorption features separate into two distinct and similar components. This is best illustrated by contrasting epochs 11 and 16 in Figure 1, which show the minimum and maximum observed separations respectively. The epochs which display well-separated components have allowed a precise classification of both components. The system consists of a more massive and more luminous primary, which is an O6.5 Iafc supergiant, and a slightly less luminous O6 Iaf companion. These spectral types are determined from visual inspection of the He II / He I absorption line ratios between 4200 / 4026 and also between 4542 / 4471, the latter of which can be seen in Figure 1.

The Ifc classification of the primary arises from emission of C III 4647 and 4650-4652. This relatively rare feature led to the recent introduction of the Ofc category in the morphological framework used to classify O-type spectra (Walborn et al. 2010). Figure 2 clearly illustrates that the N III emission lines separate into two distinct components, whereas the two C III emission lines show no evidence of separation, but merely shift between epochs in the same sense as the primary. The Ofc feature has previously been associated with the O5 spectral type (Walborn et al. 2010); this therefore, is an interesting example of the phenomenon in a later-type star, albeit in the LMC.
Where possible, the relative shift of the components was identified through the C III emission and also He I 4922 emission, which are only present in the primary. In the LR02 observations, the Si IV 4116 emission line was used as the main diagnostic for the relative shift of the components. The Struve-Sahade effect (e.g. Linder et al. 2007) can most likely be neglected in this system given its relatively long period.

3.2 Radial velocity analysis and lower mass limits
A global fitting approach has been used to determine the radial velocity shifts of the different epochs. This technique fits double Gaussian profiles to a number of lines: He I 4026, Si IV 4116, He II 4200, S IV 4485, S IV 4505, He II 4542, He II 4686 and He I 4922. The fitting is performed simultaneously on all the observations, which ensures that consistent profile shapes are used, including at conjunction. This approach improves the disentangling of the contribution from each star for the data sets with limited phase coverage, but ignores the possibility of line profile variations. The formal errors on the measurements for each component are a few km s-1.
The mass ratio of the system can be found from the ratios of the primary and secondary radial velocities, and is independent of any other assumptions about the orbit (Rauw et al. 2000). For R139 the mass ratio is found to be: .
Period searches based on Fourier analysis of the measured radial velocity shifts were performed using the methods of Gosset et al. (2001): the dominant signal indicated a period of 153.9 days. The corresponding orbital solution, which has an rms uncertainty of 6.2 km s-1, is shown in Figure 3 (based on methods of Sana et al. 2006a). The corresponding lower mass limits for the stars are: and . Other orbital parameters are listed in Table 2. These are sensitive to the behaviour of the system around periastron: further observations of this stage in the orbit would allow confirmation of these results.
| Property | Best-fit value |
|---|---|
| Period, P | 153.9 0.1 days |
| Eccentricity, e | 0.46 0.02 |
| Argument of periastron, | 106.9 5.0 deg |
| Date of (HJD - 2450000), T0 | 6035.9 1.3 days |
| Maximum velocity of primary, K1 | 107.8 3.8 km s-1 |
| Maximum velocity of secondary, K2 | 127.0 4.5 km s-1 |
| Projected semi-major axis for primary, a | 290.6 10.8 |
| Projected semi-major axis for secondary, a | 342.3 12.8 |
3.3 The luminosity of R139
To estimate the luminosity of the system, model atmospheres were calculated with CMFGEN (Hillier & Miller 1998), adopting abundances from Asplund et al. (2005) and scaling them appropriately for the LMC. These were used to constrain the effective temperature () consistent with: 1) the absence of N IV 4058 emission; 2) the presence of N III 4640 emission; 3) the intensity of the He I 4471 absorption. This gives an estimated for both components of kK.
The luminosity was then determined by matching optical and infrared photometry from Selman et al. (1999) and 2MASS (Skrutskie et al. 2006). For this purpose, the visual extinction was determined for each model, based on the relation from Fitzpatrick (1999). The resulting luminosity for the composite system is (with in the range 3.4–3.9).

4 Photometric Variability
R139 was identified as showing slight photometric variability by Feitzinger & Isserstedt (1983). They observed a 0.3 magnitude dimming in the band over a 25 day period. However, this was from only three observations taken with a wide (18”) aperture.
An active component of the VTFS is photometric follow-up with the 2 m Faulkes Telescope South, which has been used to monitor seven fields in the 30 Dor region. The default mode of the camera is 2 2 binning of the CCD pixels, giving an effective pixel-scale on the sky of 0278.
We have 54 V-band epochs for the relevant field, spanning an 18 month period starting in January 2009. The Faulkes data are reduced automatically following observations, but are not calibrated photometrically. Given the crowding in this field, we used apphot in iraf to obtain instrumental magnitudes of R139 from aperture photometry. Five ‘check’ stars of similar brightness were selected from the frames for comparison: R133, R137, R138, Mk 11, and R146. From these, differential residuals () were calculated for R139 compared to the mean magnitude of the check star for each epoch. The deviation was found to be consistent with that calculated between the check stars themselves, indicating that R139 shows no photometric variability. These results are shown in Figure 4, where the observations have been phased to the 153.9 day orbit.
If the inclination (i) of the system was , the maximum duration of eclipses near apastron and periastron has been calculated to be 7.9 and 2.9 days respectively. From the sampling of our photometric data, it is unlikely that such events would have gone undetected, see Figure 4. However, if the inclination is lower (), there is no eclipse near apastron and the periastron eclipse is shorter. Consequently, an intensive photometric observing campaign is required near to periastron to conclusively determine if there is any evidence for an eclipse.

5 X-rays
R139 was detected by Portegies Zwart et al. (2002) as an X-ray source in the 30 Dor field observed with the Advanced CCD Imaging Spectrometer on the Chandra X-Ray Observatory. Further analysis of the Chandra data was carried out by Townsley et al. (2006) and more recently by Guerrero & Chu (2008). These studies found R139 to have a relatively low X-ray luminosity compared with other W-R stars in the region. Guerrero & Chu (2008) also considered data from the Röntgen Satellite (ROSAT), but it did not detect R139 owing to its lower sensitivity.
The X-ray luminosity and the bolometric luminosity of massive O stars are linked by the relationship (Sana et al. 2006b). Therefore, with a luminosity of for the combined system, an X-ray luminosity of would be expected. This is slightly lower than Guerrero’s result of in the 0.5 - 7.0keV range - even considering the possible 25% error in the detected count rate. This slight excess emission might be associated with X-rays generated through the interaction of the system’s stellar winds. There is no evidence, however, for phase-dependent line profile variations, which would have also suggested colliding winds.
6 Discussion
Previous observations: In order to compare our result with the earlier work of Schnurr et al. (2008b), who found an insignificant radial velocity shift, our LR02 observations were degraded to the same resolving power as Schnurr’s (R ) and a number of lines were fit with a single Gaussian function. The radial velocity variation was found to be only 10.3 km s-1, while the FWHM of the profiles varied by around 40 km s-1. This suggests that, even if the system had been observed near periastron, it would have been difficult to confirm its binary nature.
Comparison systems: Some binary systems have been identified where both components are more massive than those of R139: NGC-3603-A1, is a system comprised of a 116M☉ primary and a 89M☉ star (Schnurr et al. 2008a), and also WR20a, an 83M☉ and 82M☉ system (Rauw et al. 2004; Bonanos et al. 2004). However, there are not many systems with a pair of massive evolved O-stars. Closer analogs are the Cyg OB2-B17 system (Stroud et al. 2010), where the component stars are O7 and O9 supergiants and Cyg OB2-#5 where one of the stars is an O6-7 supergiant (Rauw et al. 1999). It would appear that neither of these systems contain stars as massive as those predicted here. Consequently, it can be argued that R139 is the most massive O supergiant binary system yet discovered.
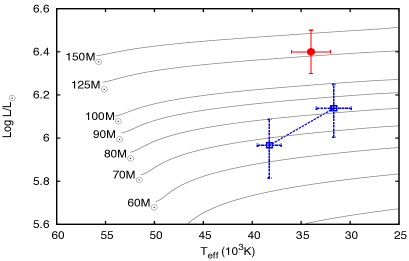
Evolutionary masses: Figure 5 shows how the R139 system compares to evolutionary tracks from Friedrich et al. (in prep.), computed analogously to the models of Brott et al. (2011). The figure shows that the total luminosity and of the system equals that of a single star with an initial mass above 125 .
Assuming R139 consists of coeval stars with a mass ratio of 1.2, the estimates for the current masses are for the (cooler) primary and for the (hotter) secondary. These values have been derived using a method to fit the combined luminosity of the stars against that quoted for the system. The effective temperatures of the stars were fitted against the CMFGEN-derived temperatures of kK. Interestingly, these estimated masses are in close agreement with the lower-mass limits from the orbital solution. This implies that the system has a high inclination and supports the need for additional photometric observations.
In these models an initial equatorial velocity of 110 km s-1 was adopted in agreement with the current observed . The effect of rotation on the evolutionary tracks is very limited for initial rotation rates up to about 300 km s-1(Brott et al. 2011). Nevertheless, these tracks are sensitive to uncertain physical processes such as internal mixing and mass loss. The errors on the mass estimates represent the formal 1-sigma confidence limits of the fit and do not include systematic uncertainties in the model physics.
The best fit corresponds to an age of 2 - 2.5 Myr and implies that both stars have significantly evolved off the zero-age main sequence. As the stars are assumed to be coeval, the substantial mass ratio implies a large difference in temperature between the components (see Fig. 5). This is surprising given the similar spectral types; Martins et al. (2005) predict a temperature difference nearer to 1 kK for a 0.5 variation in spectral types. This discrepancy may well reflect our still limited understanding of the physics of the most massive stars, illustrating the potential of massive binaries as tools to evaluate our models.
The high quality, time-sampled VFTS observations have revealed that R139 is a binary system. The data suggest that it is the most massive evolved O-star binary system yet discovered: a result which further observations around periastron would help to confirm. As demonstrated here, such a massive system has already presented challenges for theoretical models to reproduce its observed properties and it will likely provide a crucial test for evolutionary and atmospheric models in the future.
Acknowledgements.
Thanks to the referee, Anthony Moffat, for their constructive comments. SdM acknowledges NASA Hubble Fellowship grant HST-HF-51270.01-A awarded by STScI, operated by AURA for NASA, contract NAS 5-26555. AZB acknowledges support from the European Commission FP7 under the Marie Curie International Reintegration Grant PIRG04-GA-2008-239335. RHB acknowledges partial support from DIULS Project PR09101.References
- Asplund et al. (2005) Asplund, M., Grevesse, N., & Sauval, A. J. 2005, in Astronomical Society of the Pacific Conf. Series, Vol. 336, Cosmic Abundances as Records of Stellar Evolution and Nucleosynthesis, ed. T. G. Barnes III & F. N. Bash, 25
- Bonanos et al. (2004) Bonanos, A. Z., Stanek, K. Z., Udalski, A., et al. 2004, ApJ, 611, L33
- Breysacher (1981) Breysacher, J. 1981, A&AS, 43, 203
- Breysacher et al. (1999) Breysacher, J., Azzopardi, M., & Testor, G. 1999, A&AS, 137, 117
- Brott et al. (2011) Brott, I., De Mink, S. E., Cantiello, M., et al. 2011, ArXiv: 1102.0530
- De Mink et al. (2009) De Mink, S. E., Cantiello, M., Langer, N., et al. 2009, A&A, 497, 243
- Feast et al. (1960) Feast, M. W., Thackeray, A. D., & Wesselink, A. J. 1960, MNRAS, 121, 337
- Feitzinger & Isserstedt (1983) Feitzinger, J. V. & Isserstedt, J. 1983, A&AS, 51, 505
- Fitzpatrick (1999) Fitzpatrick, E. L. 1999, PASP, 111, 63
- Gosset et al. (2001) Gosset, E., Royer, P., Rauw, G., Manfroid, J., & Vreux, J. 2001, MNRAS, 327
- Guerrero & Chu (2008) Guerrero, M. A. & Chu, Y. 2008, ApJS, 177, 216
- Hillier & Miller (1998) Hillier, D. J. & Miller, D. L. 1998, ApJ, 496, 407
- Linder et al. (2007) Linder, N., Rauw, G., Sana, H., De Becker, M., & Gosset, E. 2007, A&A, 474, 193
- Martins et al. (2005) Martins, F., Schaerer, D., & Hillier, D. J. 2005, A&A, 436, 1049
- Moffat (1989) Moffat, A. F. J. 1989, ApJ, 347, 373
- Moffat (2008) Moffat, A. F. J. 2008, in IAU Symposium, Vol. 250, IAU Symposium, ed. F. Bresolin, P. A. Crowther, & J. Puls, 119–132
- Parker (1993) Parker, J. W. 1993, AJ, 106, 560
- Portegies Zwart et al. (2002) Portegies Zwart, S. F., Pooley, D., & Lewin, W. H. G. 2002, ApJ, 574, 762
- Rauw et al. (2004) Rauw, G., De Becker, M., Nazé, Y., et al. 2004, A&A, 420, L9
- Rauw et al. (2000) Rauw, G., Sana, H., Gosset, E., et al. 2000, A&A, 360, 1003
- Rauw et al. (1999) Rauw, G., Vreux, J., & Bohannan, B. 1999, ApJ, 517, 416
- Sana et al. (2006a) Sana, H., Gosset, E., & Rauw, G. 2006a, MNRAS, 371, 67
- Sana et al. (2006b) Sana, H., Rauw, G., Nazé, Y., Gosset, E., & Vreux, J. 2006b, MNRAS, 372, 661
- Schnurr et al. (2008a) Schnurr, O., Casoli, J., Chené, A., Moffat, A. F. J., & St-Louis, N. 2008a, MNRAS, 389, L38
- Schnurr et al. (2008b) Schnurr, O., Moffat, A. F. J., St-Louis, N., Morrell, N. I., & Guerrero, M. A. 2008b, MNRAS, 389, 806
- Selman et al. (1999) Selman, F., Melnick, J., Bosch, G., & Terlevich, R. 1999, A&A, 347, 532
- Skrutskie et al. (2006) Skrutskie, M. F., Cutri, R. M., Stiening, R., et al. 2006, AJ, 131, 1163
- Stroud et al. (2010) Stroud, V. E., Clark, J. S., Negueruela, I., et al. 2010, A&A, 511, A84
- Townsley et al. (2006) Townsley, L. K., Broos, P. S., Feigelson, E. D., Garmire, G. P., & Getman, K. V. 2006, AJ, 131, 2164
- Walborn & Blades (1997) Walborn, N. R. & Blades, J. C. 1997, ApJS, 112, 457
- Walborn et al. (2010) Walborn, N. R., Sota, A., Maíz Apellániz, J., et al. 2010, ApJ, 711, L143