e-mail h.eschrig@ifw-dresden.de, Phone: +49-351-4659-569, Fax: +49-351-4659-750
XXXX
The effect of chemical disorder on the magnetic anisotropy of strained Fe-Co films
Abstract
\abstcolStrained Fe-Co films have recently been demonstrated to exhibit a large magnetocrystalline anisotropy (MCA) and thus to be of potential interest as magnetic storage material. Here, we show by means of density-functional (DF) calculations, that chemical order can remarkably enhance the MCA. We also investigate the effect of relaxation perpendicular to the applied strain and evaluate the strain energy as a function of Co concentration and substrate lattice parameter. On this basis, favourable preparation routes for films with a large perpendicular anisotropy are suggested.
keywords:
magnetic anisotropy, Fe-Co alloys, strained films, chemical disorder, perpendicular recording.1 Introduction
Materials for high-density magnetic recording media (hard disc drives) have to obey two competing requirements [1]. On the one hand, stability against thermally activated switching is guaranteed only if the volume-integrated MCA of a single storage bit is larger than about , where is the Boltzmann constant and is the operating temperature [2]. On the other hand, the magnetic field needed to write a bit is, apart from demagnetisation effects, proportional to [3], where denotes the (uniaxial) MCA energy and is the saturation magnetisation. Since the write field is constrained by the construction of the write head [1], a large of the storage material is desirable along with a large , the latter demand resulting from the stability requirement.
Fe-Co alloys are well-known to have a high saturation magnetisation at ambient conditions, but their bulk MCA is minute due to their cubic symmetry. It is however possible to achieve high anisotropy values without sacrificing the advantageously large magnetisation by designing artificial structures that break the cubic symmetry. One way to achieve this goal would be to manufacture FeCo superlattices. It has been demonstrated experimentally and confirmed by DF calculations, that [(110)-FeCo]n superlattices show a large in-plane magnetic anisotropy [4]. Unfortunately, advanced recording techniques require a magnetisation orientation perpendicular to the surface, i.e., an out-of-plane anisotropy. A second possibility would be the preparation of ultrathin films. Monolayers of Fe-Co on Pt(111) show a maximum out-of-plane anisotropy energy of about eV per atom both in DF theory and in low temperature experiments. However, they have Curie temperatures close to room temperature [5] and are, thus, not suited for the discussed application.
A third, recently suggested route is to fabricate strained, bulk-like Fe1-xCox films by epitaxial growth on a suitable substrate [6]. This idea relies on the fact that alloys which are cubic in their bulk phase can be grown as metastable tetragonal films, if they are deposited on substrates with a fourfold symmetric surface, e.g., the (001) surface of cubic crystals. It was shown in a recent study that the Fe0.7Pd0.3 alloy can be prepared to form nm thick, i.e., bulk-like, epitaxial films on a number of substrates. Thus, the centred-tetragonal structure of these films with lattice-parameter ratios between and spans almost the whole range from BCC () to FCC () [7].
Turning back to Fe1-xCox alloys, the out-of-plane values of predicted by DF calculations reach up to eV per atom for and between and [6]. We will demonstrate below, that the elastic strain energy of Fe1-xCox is small enough in the interesting region of to allow the stabilisation of films with a decent thickness. (Note, that quantum-size effects strongly influence the MCA of thin films at least up to monolayers (ML) or about nm thickness [8].)
Meanwhile, the mentioned prediction by Burkert et al. (abbreviated below BNEH [6]) has been confirmed by several experiments [9, 10, 11, 12]. These confirmations should be viewed with caution, since in all quantified cases the measured values of seem to be lower than the predictions for comparable parameter values of and of by factors of two to four. In detail, eV per atom was found for Fe0.5CoPd(001) films with - ML thickness, about half the predicted value [10]; for [Fe0.36CoPt(001)]n superlattices, only one half [9] or one quarter [11] of the theoretical value was measured, depending on the way of comparison (dedicated calculation for a certain superlattice [9] or evaluation of bulk data from various superlattice data [11]). One should note that in the latter case the anisotropy was measured at room temperature, which explains a part of the discrepancy.
Looking for a reason of the possibly systematic disagreement between theory and experiment, a first thought might blame the mentioned quantum oscillations. However, data evaluation in two of the three mentioned cases considered fits to a number of systems with varying film thickness, and the third comparison involved a calculation for the specific geometry. Another possible source of deviation might be the local density approximation (LSDA) applied by BNEH. We argue, that this is unlikely since in most known cases LSDA results for underestimate the experimental -values.
Here, we are going to advocate a third idea: While the experiments in all cases known to us were performed on presumably chemically disordered (though structurally well-ordered) alloys, the calculations by BNEH employed the so-called virtual crystal approximation (VCA) to simulate the alloy. In this approximation, the electron number is adjusted to its correct value according to the alloy composition by allowing the atomic nuclei to carry a non-integer charge. In this way, a perfect chemical order is introduced. In our particular case, all Fe and Co atoms are replaced by only one kind of atoms with atomic charge . This means, the VCA describes a chemically ordered structure with the correct electron number of the chemically disordered alloy.
As the main result of the present work, we will show that strained Fe-Co films with chemical order can have a much larger magnetic anisotropy than chemically disordered films. Beyond this main point, we will contrast the strain-energy landscape with the related magnetocrystalline anisotropy energy in order to find promising preparation parameters for films with a large perpendicular anisotropy.
The following sections contain computational details, numerical results and their discussion, and the conclusions.
2 Computational details
The DF calculations were carried out with the all-electron, full-potential local-orbital code FPLO, version 8.00-31 [13, 14]. The generalised gradient approximation (GGA) in the parameterisation by Perdew, Burke, and Ernzerhof [15] was used. We preferred this approach against the LSDA previously used by BNEH, since we are interested in the evaluation of strain energies in addition to the magnetic quantities. The valence basis set comprised , , , , , , and states. Brillouin zone integrations were performed using the linear tetrahedron method with Blöchl corrections. Structural properties and spin magnetism were evaluated in a scalar relativistic mode, while a four-component fully relativistic mode was used for the calculation of the MCA.
Five different structural models were employed to describe the atomistic geometry and the chemical order of the strained alloy films. All these models are based on the assumptions that (i) the films are thick enough to disregard the influence of the surface and of the substrate on the electronic structure and that (ii) the substrate-film interaction is nonetheless strong enough to let the in-plane lattice parameter be dictated by the substrate. These assumptions are inherent to the concept of the epitaxial Bain path (EBP) [16, 17] that we applied in a part of the calculations.
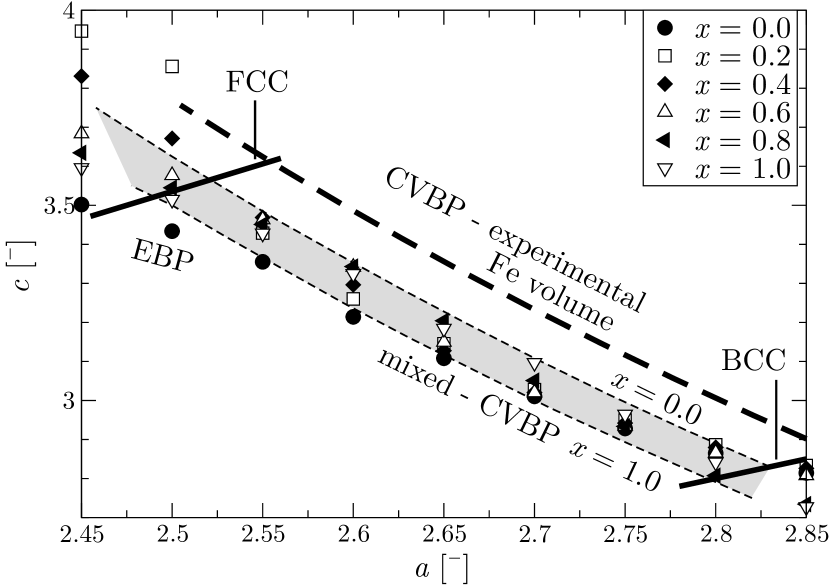
Model I: A centred-tetragonal (BCT) structure with one kind of atoms of atomic number (VCA). The lattice parameter was determined by the assumption of constant volume, where the latter was chosen to be the experimental volume of BCC Fe at room temperature, i.e., Å (Figure 1, thick dashed line, the so-called constant volume Bain path, CVBP).
Model II: Same structure (BCT) and chemistry (VCA) as in Model I, but the lattice parameter was calculated by minimisation of the total energy for and fixed, using spin polarised GGA. Related data are given in Figure 1 with symbols for different . These data constitute the EBP. For comparison, CVBPs are given (dashed lines including shaded area) using the GGA volumes of BCC Fe () and of FCC Co (). The EBP values of are close to the related CVBP values except for small in the region close to the FCC structure. This can be understood by the strong -dependence of the spin moment in this region, see Figure 4 below.
Contour plots presented below are based on data calculated with Model I or II on grids with and Å.
Model III: L10 structure with stacks of single quadratic Fe- and Co-layers, . This structure is the strained variant of the known -Fe-Co (B2) phase, where . The lattice parameter was calculated by minimisation of the total energy for fixed (EBP).
Model IV: Stacks of single FCC-like (Fe, Co)- and (Co, Co)-layers, , and EBP condition for . This structure is derived from the L12 structure which is obtained for .
Model V: A BCT supercell with 16 atoms, used to describe chemical disorder by means of an ensemble average. Fe8Co8 (), Fe6Co10 (), and Fe4Co12 () were considered. The atoms were arranged such that the nearest neighbour patterns match the completely disordered alloy as closely as possible. Starting from a single atomic configuration, a symmetry-adapted ensemble average was constructed in such a way that its MCA correctly vanishes for (BCC structure). Details of the method are described in Reference [18], where 32-atom supercells modelled the case of a slightly distorted FCC structure.
The space groups , , , , were used in the calculations for structure Models I V, respectively. Structure optimisation was carried out for Models I IV, where -meshes with points in the full Brillouin zone (BZ) for all models were used. For the more complex Model V, internal relaxation is expected to be of minor importance, since Fe and Co atoms have almost the same atomic volumes. Thus, we abstained from a relaxation of the inner degrees of freedom. Further, the atomic volume obtained with Model II at the appropriate -value and Å (a value of particular interest, see next section) was taken to construct a CVBP for Model V.
For the Models I IV, the MCA energy was evaluated from independent self-consistent total energy calculations for magnetic moment orientations along the -axis () and along the -axis (),
| (1) |
The in-plane anisotropy () was not considered. In these calculations, finer -meshes than in the structure optimisations were used: points in the full BZ for all models.
To cope with Model V, we relied on the so-called magnetic force-theorem [19]: the total energy difference was approximated by the difference of band energy sums, evaluated with -points in the full BZ. In Eqn. (1) is to be replaced by ( ), where is the band energy calculated for a magnetic moment orientation along the -axis.
3 Results and discussion
3.1 Strain energy

Figure 2 shows a contour plot of the strain energy,
| (2) |
with -dependent ground-state energy , evaluated with Model II (VCA, EBP). There are two valleys corresponding to the BCC ( ) and FCC ( ) ground state, separated by a saddle point at ; Å. The calculated critical Co concentration of about % for the FCC-BCC transition is consistent with the known existence range of the BCC-like Fe-Co B2 phase up to % Co and two-phase behaviour (FCC + BCC) at higher Co concentration [20].
The strain energy is an important quantity that determines the feasibility of epitaxial growth. In a simplified picture, the achievable thickness of a metastable film is inversely proportional to . Recent work on Fe0.7Pd0.3 films demonstrated the possibility to grow nm films (about ML) with a strain energy of meV per atom, estimated by DF calculations [7]. Considering Fe-Co films on a Rh(001) substrate ( Å), we predict a strain energy between and meV per atom for . Indeed, experiments indicate that epitaxial growth is stable up to about ML, while thicker films seem to become crystallographically disordered [10].
From this perspective, it seems worthwhile to try the growth of thicker films in the saddle point region of Figure 2. The related in-plane lattice parameters define a region of very high strain (either BCC or FCC serve as zero-strain reference), but the strain energy is comparably low. As an additional advantage of this area the in-plane stress is low (zero at the saddle point) which might additionally facilitate the epitaxial growth.We note, that in reality the saddle point area might appear at about Å higher -values, since the GGA calculations find somewhat smaller ground-state volumes than known from experiment, see Figure 1.
To check, whether different types of structural or chemical order have an influence on the film stability, we compare strain energies obtained with three different structure models, Figure 3. The calculations were performed for , a line cutting the -plane close to the saddle point. All three models show very similar dependence of on , with minima at the FCC- and BCC-(like)-structures and a maximum (close to the saddle point in Figure 2) of meV per atom. We conclude, that the -dependence of the strain energy is mainly determined by the electron number featured in the VCA. Structural details and chemical disorder only slightly modulate the behaviour.
3.2 Spin moment

For magnetic storage applications, a large saturation magnetisation is needed to allow switching with a magnetic field of limited strength. Figure 4 shows the VCA spin moment, which accounts for about % [21] of , as a function of and . We find high values of , depending only weakly on and being almost insensitive to a variation of , except in the region Å. The weak -dependence can be understood by assuming constant atomic moments for and transition from weak to strong ferromagnetism of iron in the region (Slater-Pauling behaviour). For the case of Fe-Co films on Cu(001) ( Å), this behaviour has been confirmed in experiment [22].
The pronounced moment reduction in the Fe-rich area below Å is related to the instability of ferromagnetism in FCC iron. In the present GGA calculations, restricted to collinear ferromagnetic states, we find a low-moment solution for very small Co concentrations and a high-moment solution for . This strong -dependence of the spin moment has an effect on the EBP (Figure 1) by magneto-volume coupling: for , the volume is reduced in comparison to the constant-volume assumption, while it is considerably enhanced for .
The earlier results for by BNEH agree qualitatively with our data but do not show any low-spin behaviour, since they do not include the region very close to FCC. Furthermore, those data were obtained for slightly larger (experimental) volume [6] which stabilises the high-moment solution.
3.3 Magnetocrystalline anisotropy: chemically ordered films
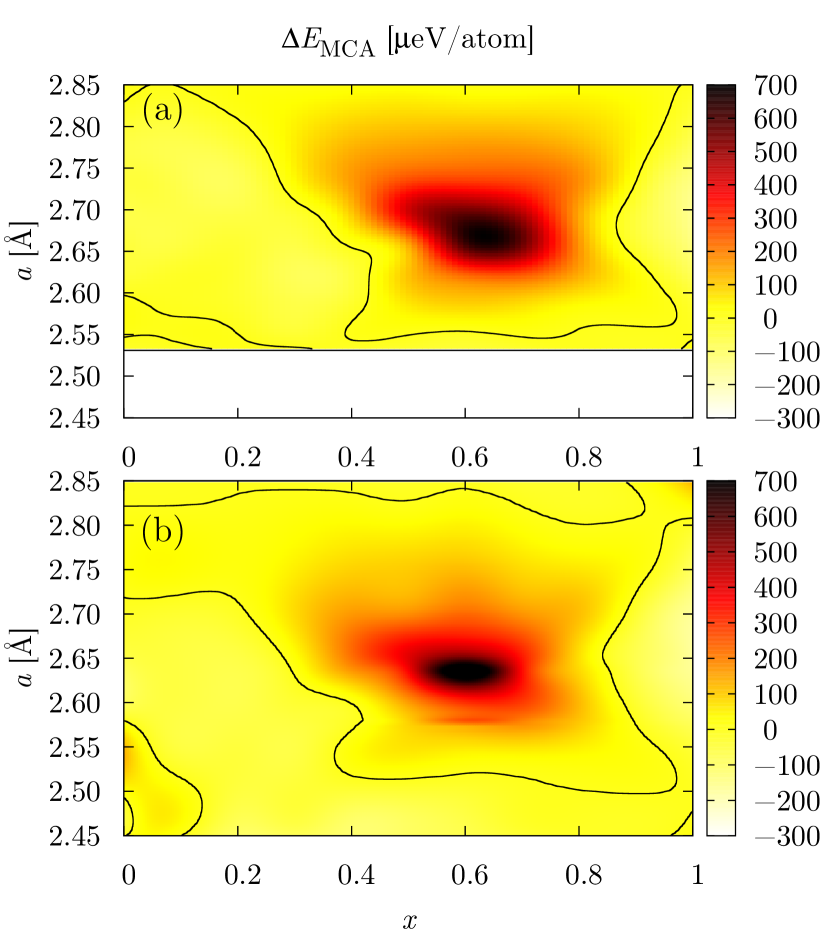
We now turn to the key quantity for magnetic materials applications, the MCA. Recall, that for chemically ordered Fe-Co layers BNEH predicted a peak in with a maximum height of about eV in the vicinity of ; . Figure 5a shows our data for , evaluated with Model I (VCA, CVBP). They agree well with the data published by BNEH which were confirmed qualitatively by experiments [9, 10, 11, 12].
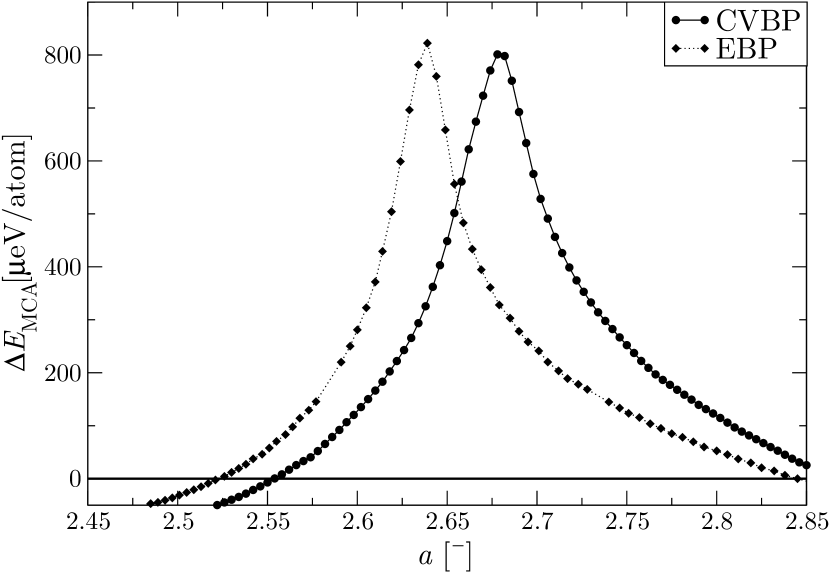
To check whether consideration of - and -specific relaxation of the film perpendicular to the film plane might affect the MCA, we repeated the calculation for the EBP (Model II, Figure 5b). By comparison of the two panels of Figure 5 we find that both geometries yield qualitatively the same results. A cut at (approximately through the peak maximum) shows, that both structure models yield almost the same maximum MCA energy of eV, see Figure 6. The main difference consists of a shift of the MCA-maximum from Å (CVBP) to Å (EBP). Further, the EBP-peak has a somewhat smaller width. In both cases, the ratio lies between and (as found by BNEH). Thus, the different optimum -value originates from the volume difference (experimental vs. calculated volume).
3.4 Magnetocrystalline anisotropy: the effect of chemical disorder
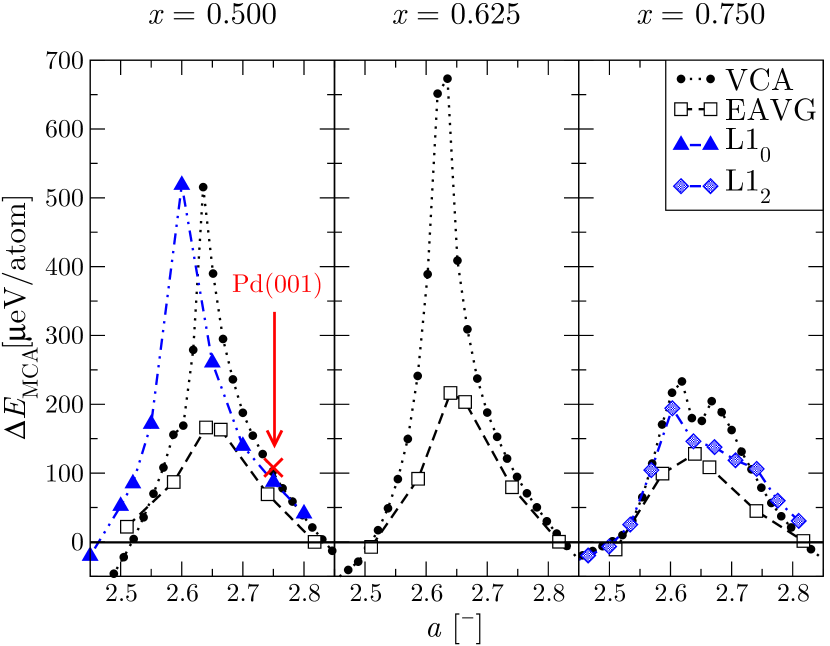
Finally, we investigate how chemical disorder of the films might influence their magnetic anisotropy. To this end, VCA results are compared with results for two other structure types with perfect chemical order on the one hand and with an ensemble average simulating disorder on the other hand. We recall, that VCA is a model imposing perfect chemical order. The calculations were performed for the most interesting concentration range between and .
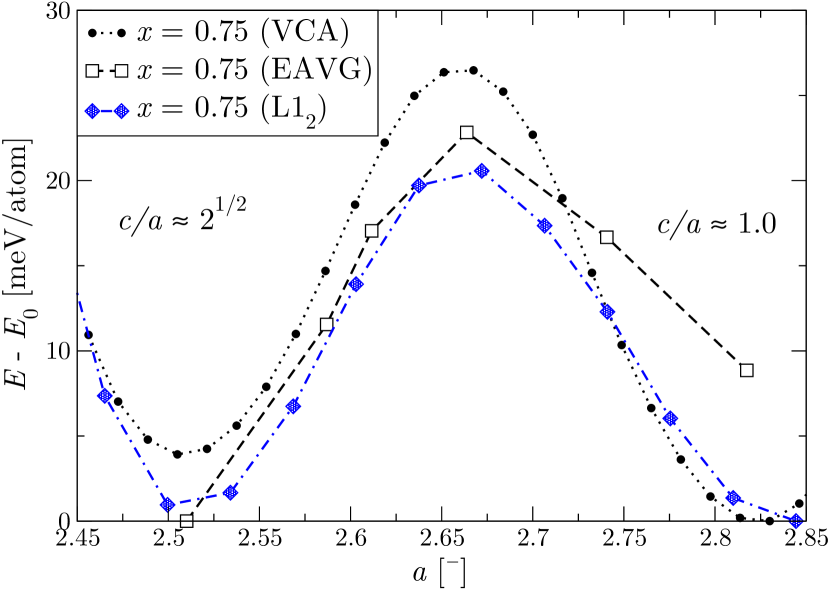
Figure 7 compiles calculated data for all four mentioned structure models. Obviously, the specific type of crystallographic structure is, in the present case, of minor importance. What matters is chemical order. This finding is not at all trivial, since the magnetic anisotropy is known to be sensitive to the detailed electronic structure and, hence, to the specific crystal structure. It was already mentioned by BNEH that L10 results for closely resemble the VCA results for . We here confirm this point (left panel of Figure 7) and add, that also by using an L12-derived structure the VCA data () are rather well reproduced (right panel).
However, a striking difference is immediately visible between the MCA of the chemically ordered structure models and the MCA of Model V, the chemically disordered case. The latter yields peaks smaller than those of the ordered structures by factors of to , depending on . We suggest, that the relatively low experimental values (compared with the prediction by BNEH) might be caused by the lack of chemical order.
As a concluding remark, the experimental value for Fe0.5CoPd(001) [10], red cross in the left panel of Figure 7, seems to compare quite well with our VCA or L10 data. One has to bear in mind, however, that renormalisation of the calculated curves to the experimental volume would shift all calculated data by Å to the right, thus providing coincidence of the experimental value with the simulated disorder.
4 Conclusions
We have shown, that neither detailed structural relaxation nor the specific structure type have an important influence on the magnetic and elastic properties of strained Fe-Co films. On the other hand, chemical disorder can reduce the magnetic anisotropy energy by factors of to . We suggest that this might be a reason for the relatively small -values measured, hitherto.
Epitaxial growth of thick, highly strained Fe1-xCox films on substrates with lattice parameter is predicted to be most stable in the parameter range ; Å Å, independent of chemical order. The maximum possible values of are expected for almost the same range of in-plane lattice parameters, Å Å but somewhat lower Co concentration, .
Based on these findings, we suggest two promising routes to fabricate strained Fe-Co films with large perpendicular anisotropy:
(1) Preparation of relatively thin ordered Fe-Co L10-films () on a substrate with Å. The maximum thickness of these films is probably limited to about ML by a relatively large strain energy. On the other hand, very large values up to eV per atom are expected (Figure 7). Thus, a large volume-integrated anisotropy can be achieved with relatively thin films.
(2) Preparation of relatively thick films close to the saddle point of the strain energy, e.g., and Å Å. For these parameters, of chemically disordered films is limited to about eV per atom, too small a value to overcome the in-plane shape anisotropy. There is, however, a chance to enhance the magnetic anisotropy of these films by careful annealing: calculations performed by a group including Manfred Fähnle point to the possibility to stabilise an ordered Co3Fe phase by epitaxial strain [23].
We hope that our results will add another important route to the experimental search for Fe-Co based magnetic recording media: the preparation of chemically ordered strained films.
We thank Hongbin Zhang, Sebastian Fähler, and Ingo Opahle for discussion and we thank Ingo Opahle for providing a code generating stochastic ensembles in Model V.
References
- [1] D. Weller, A. Moser, L. Folks, M. E. Best, W. Lee, M. F. Toney, M. Schwickert, J. U. Thiele, and M. F. Doerner, IEEE Transactions on Magnetics 36, 10 – 15 (2000).
- [2] S. H. Charap, P. L. Lu, and Y. J. He, IEEE Trans. Magn. 33, 978 – 983 (1997).
- [3] H. Kronmüller, in: Science and Technology of Nanostructured Magnetic Materials, edited by G. C. Hadjipanayis and G. A. Prinz, (Plenum, New York, 1991), p. 657.
- [4] V. A. Vas’ko, M. Kim, O. Mryasov, V. Sapozhnikov, M. K. Minor, A. J. Freeman, and M. T. Kief, Appl. Phys. Lett. 89, 092502 (2006).
- [5] G. Moulas, A. Lehnert, S. Rusponi, J. Zabloudil, C. Etz, S. Ouazi, M. Etzkorn, P. Bencok, P. Gambardella, P. Weinberger, and H. Brune, Phys. Rev. B 78, 214424 (2008).
- [6] T. Burkert, L. Nordström, O. Eriksson, and O. Heinonen, Phys. Rev. Lett. 93, 027203 – 027206 (2004).
- [7] J. Buschbeck, I. Opahle, M. Richter, U. K. Rößler, P. Klaer, M. Kallmayer, H. J. Elmers, G. Jakob, L. Schultz, and S. Fähler, Phys. Rev. Lett. 103, 216101 (2009).
- [8] H. Zhang, M. Richter, K. Koepernik, I. Opahle, F. Tasnádi, and H. Eschrig, New Journal of Physics 11, 043007 (2009).
- [9] G. Andersson, T. Burkert, P. Warnicke, M. Björck, B. Sanyal, C. Chacon, C. Zlotea, L. Nordström, P. Nordblad, and O. Eriksson, Phys. Rev. Lett. 96, 037205 – 037208 (2006).
- [10] F. Luo, X. L. Fu, A. Winkelmann, and M. Przybylski, Appl. Phys. Lett. 91, 262512 (2007).
- [11] P. Warnicke, G. Andersson, M. Björck, J. Ferré, and P. Nordblad, J. Phys.: Condens. Matter 19, 226218 – 226227 (2007).
- [12] F. Yildiz, M. Przybylski, X. D. Ma, and J. Kirschner, Phys. Rev. B 80, 064415 (2009).
- [13] K. Koepernik and H. Eschrig, Phys. Rev. B 59, 1743 – 1757 (1999), see also http://www.fplo.de.
- [14] H. Eschrig, M. Richter, and I. Opahle, Relativitic Solid State Calculations, in: Relativistic Electronic Structure Theory, Part 2: Applications, edited by P. Schwerdtfeger, (Elsevier, 2004), pp. 723 – 776.
- [15] J. P. Perdew, K. Burke, and M. Ernzerhof, Phys. Rev. Lett. 77, 3865 – 3868 (1996).
- [16] E. C. Bain, Trans. AIME 70, 25 (1924).
- [17] P. Alippi, P. M. Marcus, and M. Scheffler, Phys. Rev. Lett. 78, 3892 – 3895 (1997).
- [18] J. Buschbeck, I. Opahle, S. Fähler, L. Schultz, and M. Richter, Phys. Rev. B 77, 174421 (2008).
- [19] G. H. O. Daalderop, P. J. Kelly, and M. F. H. Schuurmans, Phys. Rev. B 41, 11919 – 11937 (1990).
- [20] T. Nishizawa and K. Ishida, Bull. Alloy Phase Diagrams 5, 250 – 259 (1984).
- [21] F. Yildiz, F. Luo, C. Tieg, R. M. Abrudan, X. L. Fu, A. Winkelmann, M. Przybylski, and J. Kirschner, Phys. Rev. Lett. 100, 037205 (2008).
- [22] M. Zharnikov, A. Dittschar, W. Kuch, K. Meinel, C. M. Schneider, and J. Kirschner, Thin Solid Films 275, 262 – 265 (1996).
- [23] A. Díaz-Ortiz, R. Drautz, M. Fähnle, H. Dosch, and J. M. Sanchez, Phys. Rev. B 73, 224208 (2006).