High-Fidelity State Detection and Tomography of a Single Ion Zeeman Qubit
Abstract
We demonstrate high-fidelity Zeeman qubit state detection in a single trapped ion. Qubit readout is performed by shelving one of the qubit states to a metastable level using a narrow linewidth diode laser at followed by state-selective fluorescence detection. The average fidelity reached for the readout of the qubit state is 0.9989(1). We then measure the fidelity of state tomography, averaged over all possible single-qubit states, which is 0.9979(2). We also fully characterize the detection process using quantum process tomography. This readout fidelity is compatible with recent estimates of the detection error-threshold required for fault-tolerant computation, whereas high-fidelity state tomography opens the way for high-precision quantum process tomography.
1 Introduction
One of the basic requirements for implementing a physical qubit is the ability to faithfully measure its state [1]. Furthermore, qubit state detection must be performed with high fidelity to reach fault tolerant quantum computation. The exact detection error threshold required depends on many factors; however under quite general assumptions error values on the order of were estimated [2]. Another important use of high-fidelity state detection is precision process tomography for studying different quantum processes.
Trapped ion qubits are a promising candidate system for physically realizing a quantum computer and serve as a convenient test-ground for studying fundamental quantum dynamics. Ion species used for this purpose typically have a single electron in their valence shell and the two qubit states are encoded in two energy levels of the valence electron. State detection methods used so far rely on state-selective fluorescence. Here photons are scattered from a laser that is resonant with a transition from one of the qubit states to a short-lived excited state, whereas transitions from the other qubit state are largely off-resonance. State inference is then based on the detected photon statistics [3]. To this end, qubit choices with a large energy separation are advantageous.
For optical qubits, in which the two qubit states are separated by an optical transition, state detection fidelity as high as 0.9999 was demonstrated using state-selective florescence and accounting for photon arrival times [4, 5]. Another detection scheme, using repetitive quantum nondemolition measurements on an ancila ion-qubit, was shown to give a fidelity of 0.9994 [6]. Optical qubits, however, have the disadvantage of an excited state lifetime on the order of one second, depending on the exact ion species used. Furthermore, the linewidth of even ultra-stable optical local oscillators, i.e., frequency stabilized lasers, would limit the dephasing time of an optical qubit.
Qubits that are encoded into a pair of levels in the electronic ground state, in which the two qubit levels are split, either by the Zeeman effect or the hyperfine interaction, by radio-frequency transitions, have practically an infinite lifetime, as well as a very long coherence time [7]. Hyperfine qubit levels are typically separated by frequencies in the GHz range. State detection for this type of qubit can still be implemented by direct state-selective fluorescence, since the typical linewidth of electric-dipole transitions is two orders of magnitude smaller. Here, off-resonance scattering normally limits state detection fidelity to below 0.995 [8, 9, 10]. The use of ancila qubits can, in principle, increase the detection fidelity of a hyperfine ion-qubit [11]. In ion species that have low-lying meta-stable levels, one of the qubit states can be shelved to a meta-stable level prior to detection. Here detection fidelity is similar to that of an optical qubit with an additional error introduced by the state shelving process. Using state selective optical pumping for shelving, a hyperfine ion-qubit measurement fidelity as high as 0.9977 was demonstrated. [4].
Ion-qubits that are encoded into a pair of Zeeman split levels pose the hardest state-measurement challenge. This is because the frequency separation between the qubit levels is typically in the MHz range and is comparable to the spectral linewidth of electric-dipole transitions used for state-selective fluorescence. Since direct state-selective fluorescence is impossible, Zeeman qubits can be readout only by state mapping onto a Hyperfine ancila qubit [6] or by shelving one of the qubit states onto a meta-stable level. However, the fidelity of state shelving in a Zeeman qubit using optical pumping is limited due to the strong coupling of the shelving light to the other qubit state [12]. Thus, the only way to state-selectively shelve a Zeeman qubit with high fidelity is by using a narrow-linewidth laser. Although there have been several reports on detecting a Zeeman qubit with shelving via a narrow-linewidth laser, with typical fidelities below 0.996 [13, 14], to our knowledge, there hasn’t been a systematic study of the measurement error and limitations in this kind of qubit.
Here we demonstrate the readout of a single-ion Zeeman qubit with a fidelity of 0.9989(1). Spin state detection is performed via electron shelving with a narrow-linewidth diode laser, followed by state-selective fluorescence. We analyze the different fundamental sources as well as technical sources of measurement error in detail. Further, we use the high-fidelity state detection of our qubit to demonstrate high-fidelity state tomography [15]. Here, we measure the fidelity of quantum state tomography averaged over all possible single qubit states and also fully characterize the detection process using quantum process tomography.
2 Experimental Setup
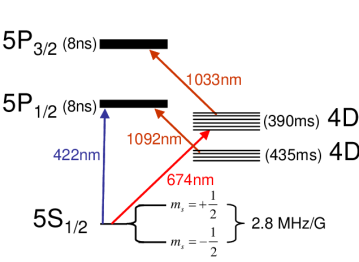
We trap a single ion in a linear RF Paul trap. The trapping potential is well approximated as harmonic with a secular axial frequency of , and two nearly degenerate radial frequencies of . A scheme of the relevant energy levels in is shown in Fig. 1. The and qubit states are encoded in the and spin states respectively. A magnetic field of mT splits the two qubit levels by a frequency, MHz.
An oscillating magnetic field, perpendicular to the quantization axis, is generated by a current, oscillating at , through an electrode positioned 2 mm from the ion, resulting in coherent coupling between the two qubit levels. Zeeman qubit coherent rotations are therefore generated by oscillating current pulses.
In the first part of state detection the electron is shelved from the state to one of the , Zeeman-split, levels using a narrow linewidth, 674 nm, external cavity diode laser. The diode laser is stabilized to a high finesse (), ultra-low expansion glass, reference cavity. Residual frequency noise of the laser has three dominant spectral features. First, slow thermal drifts of the cavity result in drifts of the laser frequency with a typical magnitude of 10 Hz/S. The atomic resonance frequency is scanned every two minutes to correct for this drift. Second, intermediate frequency noise results in a laser line half-width of 70 Hz over several seconds, estimated in a Ramsey spectroscopy experiment [16]. The third spectral feature results from fast frequency noise that is unsuppressed, or even slightly enhanced, by our frequency servo system. This spectral feature is often referred to as the servo bump. Our servo bumps are centered around on both sides of the carrier, having a width of , and contain an estimated of the optical power. A detailed discussion of our narrow linewidth diode laser system is given in [17]. In this experiment, the direction of 674 nm laser light propagation relative to the Zeeman splitting magnetic field direction, limits the allowed transitions between and manifolds to transitions.
Electron shelving is followed by state-selective fluorescence detection on the transition at . Photons that are scattered in a direction perpendicular to the 422 nm laser beam and the magnetic field are collected by an imaging system (N.A. = 0.31) and are detected with a Photo Multiplier Tube (PMT). State inference relies on the detected photon statistics. Qualitatively, a small number of detected photons implies that the ion qubit started in the state and was shelved to the non-fluorescing level, whereas a large number of detected photons implies that the ion qubit started in the state and therefore was not shelved and remained at the fluorescing level.
3 State Discrimination
Following electron shelving, the number of photons , detected by the PMT during a given detection time, , is a random variable. This random variable is denoted by if the ion is in the fluorescing (bright) state , and if the ion is in the non-fluorescing (dark) state . Photon detection events, which occur when the ion is in the dark state are primarily due to scattering of the laser beam from trap surfaces. The fidelity of state discrimination is compromised by the overlap of the probability distribution functions (PDFs) of these two random variables. State inference can be performed by introducing a threshold value for the number of photons detected, . If the number of photons detected is greater (smaller) than this threshold, , then we can infer that the ion is in the bright (dark) state. Given the probability distribution functions for and , the errors in detecting the bright and dark states are and respectively. We want to find the parameters and that minimize the mean error
| (1) |
The detection fidelity is then given by . If the lifetime of the level would have been infinite, the random variables and would follow two Poisson distributions. Given photon detection rates and in the bright and dark states respectively and a detection time, , the means of these distributions would be given by . Here the longer the detection time, the smaller is the overlap between the two PDFs and therefore also the detection error. However, the finite lifetime, , of the level introduces a correction to the PDF for , since there is a finite probability for the ion to decay during the detection. Upon decay, the photon detection rate becomes . At a detection time much shorter than the lifetime, , the PDFs for and are given by [18]
| (2a) | |||
| (2b) | |||
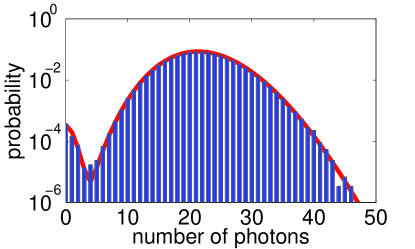
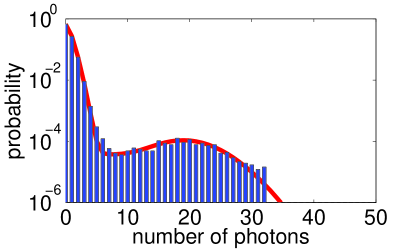
respectively. Here denotes the probability of detecting photons for a Poisson distribution with a mean , and is the incomplete gamma function. The two PDFs are denoted by the blue and red curves in Fig. 2, for our measured photon detection rates and , a detection time of and the known level lifetime, [19].
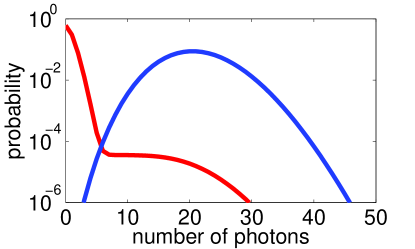
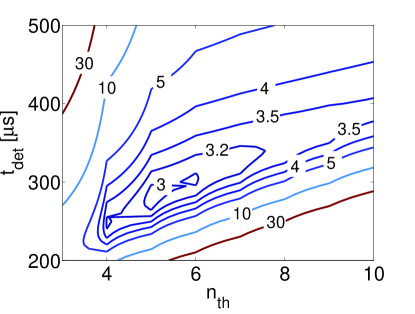
As the detection time is increased, the overlap between the two functions initially decreases owing to the larger spacing between the two Poisson peaks, but it eventually increases owing to the growing tail of the dark distribution. Hence, an optimal detection time and a threshold number of photons exist such that the error in state discrimination is minimal. Figure 3a shows a contour plot for , as a function of the detection time and the threshold on the number of photons , for the same , and values used in Fig. 2. A minimal error of is calculated at a detection time of and a threshold value for the number of detected photons.
The actual distributions measured in the experiment are also affected by the state preparation error, and an error resulting from an imperfect shelving of the ion to the metastable state. State preparation errors, and for the and states, respectively, are given by the fraction of experiments in which the ion was initialized in the wrong state. The shelving error for the state, , is the probability that the ion remained at the level after shelving was performed. For the state, is the probability that the ion was shelved to the level due to off-resonant light. Neglecting terms that are second order in the different errors, the resulting PDFs for the and states are given by [18],
| (2ca) | |||
| (2cb) | |||
Note that only the sum of the initialization error and the shelving error appears . This prevents us from distinguishing the state preparation error from the shelving error. The total mean detection error,
| (2cd) |
can be related to the error resulting from the finite lifetime of the metastable level alone, obtained before
| (2ce) |
In particular, a minimum of is obtained for the same values of detection time and the threshold on the number of photons , as the minimum of .
4 Experimental Sequence
In the experiment, two sets of data are taken. In each set the ion is prepared in one of the two Zeeman qubit states, or , and then state detection is performed. Each set of data contains repetitions of the experiment, yielding statistical uncertainty of the estimated measurement error which is below .
In both sequences the ion is first Doppler cooled on the transition for , resulting in a mean axial harmonic oscillator number of . Second, sideband cooling is performed on the narrow transition. To this end, the red sideband of the transition is continuously excited for with the laser, while the laser is left on to repump the population from the metastable level, and a polarized light is left on to repump the population from the state via the manifold. Following sideband cooling the mean axial harmonic oscillator number is .
Following cooling, the spin state is initialized. At this stage, it is highly probable that the qubit is already in the state. To increase this probability further, we leave the polarized, , optical pumping beam for an additional . To initialize the qubit in the state, we use an coherent qubit rotation to bring the electron from to . Optical pumping using the laser follows, to further increase the initialization efficiency. Ten consecutive -pulses on the transition, each followed by a repump pulse, pump the remaining population out of the or state respectively.
State detection begins with electron shelving. A long, -pulse on the transition is applied. To increase shelving efficiency another, long, -pulse is applied on the transition. Following shelving, an on-resonance laser light is shined on the ion for , during which fluorescent photons are collected by the PMT and their time of arrival is recorded for further analysis. Then, any population shelved to the level is repumped back to the ground state using a, long, laser pulse. At the end of the sequence, a red detuned light Doppler-cools the ion until the next sequence begins. During the entire sequence the laser is left on to repump population from the metastable level.
5 State Detection Results
Normalized histograms of the number of detected photons that were obtained in the two experiments for , are plotted in Figs. 4a and 4b. A maximum likelihood fit to the expected distribution functions given by Eqs. 2ca and 2cb is denoted by the solid red line. The known detection time and level lifetime [19] are used whereas , , and are fit parameters. The sum of the initialization and shelving errors for the bright and dark states obtained from the fit are and respectively.
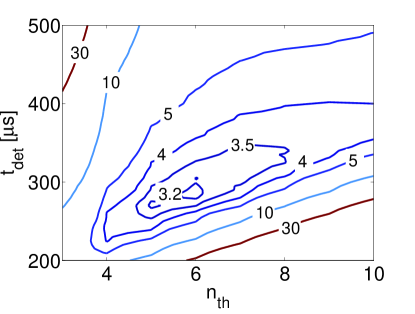
To determine the minimal detection error and the optimal parameters required to obtain it, we contour plot the measured mean error as a function of the detection time, , and the threshold value, , in Fig. 3b. Here the mean error resulting from initialization and shelving is subtracted. As shown, the experimental plot reproduces the theoretical error plot shown in Fig. 3a relatively well. In particular, the optimal parameters determined experimentally (, ) and the minimal error resulting from imperfect state discrimination approach the estimated optimal parameters (, ), and detection error .
6 Error Budget
The error shown in Figures 3a and 3b is fundamental and does not result from technical imperfections. As shown by Myerson et. al. [4], this error can be somewhat reduced by accounting for the photon times of arrival 111By similarly analyzing photon arrival times we were indeed able to lower this error to . Shelving and initialization errors however, result from technical imperfections. In the following discussion we try to point out the dominant sources for this errors by calculating an order of magnitude estimates for the contribution of different possible error sources. A summary of this error budget is presented in Table 1.
6.1 Initialization Error
The first stage of initialization consists of optical pumping to the state via the manifold. Ideally, the optical pumping beam has to match a perfect polarization. Otherwise, the matrix elements for the transitions will not null, and some population will be pumped out of the state. To this end, the wave-vector, , of the beam has to be exactly parallel to the external magnetic field and a perfect circular polarization is required. We found the fidelity of this initialization step in our setup to be limited to less than due to stress-induced birefringence in the fused silica vacuum chamber optical ports.
To increase initialization efficiency, we use the narrow linewidth laser to optically pump the remaining population from the state to the state via the level as described above. This initialization procedure is limited due to the finite off-resonance excitation probability on the transition, resulting in a finite probability for the electron to be in the state at the end of the process. Note that there are two different contributions to off-resonant excitation. The first is coherent with respect to the resonant light component and is due to the pulse finite time. The second is incoherent and is due to the servo bumps. In steady state, i.e., after a sufficient number of pulses, this probability is given by the ratio of the and transfer probabilities. These are, in turn, estimated based on the off-resonance excitation rate, the polarization of the repump laser, and the different decay probabilities from the excited states to either the or states. The incoherent off-resonance excitation rate is directly measured and is seen to be very sensitive to the specific laser and servo-loop working parameters, such as current or gain; we have observed this rate change by a factor of 2 when working with slightly different parameters. The coherent off-resonance excitation rate is estimated based on the measured Rabi frequencies and detuning. We thus estimate the state initialization error to be due to coherent off-resonance excitation and due to incoherent off-resonance excitation.
When initializing to the state, we initially perform optical pumping to the state and apply an RF -pulse, which transfers the electron to the state with a fidelity higher than 0.999. This procedure is followed by 10 similar pulses on the transition, which result in state initialization with the same error as for the state.
Note that another possible error in the initialization process could arise from leakage of laser light, resulting in mixing of the two qubit states. This was, however, found not to be a problem in our system by measuring the lifetime of each of the qubit states.
6.2 Electron Shelving Error
The error in the shelving process is different for the two qubit states and is therefore analyzed separately.
state shelving error. For the state, the shelving error is the probability that the ion was shelved to the level manifold due to off-resonant light. The nearest transition from to the level is detuned from the laser carrier, and the coupling to the motional sidebands is suppressed by the Lamb-Dicke parameter ( for the longitudinal motion). Here, the contribution of coherent off-resonance excitations during the two shelving pulses to the error is estimated to be , while the error due to incoherent excitations is .
state shelving error. For the state, the shelving error is the probability that the ion remains in the manifold after shelving was performed. A number of factors contribute to this error.
The shelving transition Rabi frequency depends on the ions’ motion through the Debye-Waller factor. The temperature of the ion therefore has a large effect on the shelving error. The ion is initially Doppler cooled to a mean axial harmonic oscillator number of . This leads to an error of in a single shelving -pulse. It is important to note that in the second shelving pulse the error is increased to due to the change in the level occupation distribution induced by the first pulse; following the first pulse, motional states with a smaller Debye-Waller factor are preferentially left at the level. To reduce this error, Doppler cooling of the ion is followed by sideband cooling on the transition. After five ms cooling, a mean axial harmonic oscillator number of , inferred from the imbalance between the motional sidebands, is reached. Yet, the mean harmonic oscillator level does not provide the full motional population distribution, which is required to estimate the shelving error. A thermal distribution with would lead to a shelving error equal to in the first pulse and in the second pulse. However, the distribution of high harmonic oscillator levels, following sideband cooling, is poorly described by a thermal distribution. This is because motional states outside the Lamb-Dicke regime have a small Debye-Waller factor on the cooling transition and therefore are not efficiently cooled. The exact dynamics of the sideband cooling process and the resulting energy level distribution are not calculated here. In our estimates we use the error values assuming a thermal distribution. This is probably an overly optimistic estimate and could be the source of the discrepancy between our evaluated and measured errors for the state.
Motion along the radial direction of the trap has a much weaker effect on shelving infidelity, because of the stronger confinement along this direction. However, while sideband cooling is performed for the axial motion, the radial motion is only Doppler cooled and thus can not be neglected. We estimate the infidelity due to radial motion to be in the first pulse and in the second pulse.
Intensity fluctuations of the laser are reduced to a negligible level using an intensity noise eater. An effective residual intensity noise resulting from beam pointing fluctuations on the ion is estimated to give an error of in a single shelving pulse.
Magnetic field fluctuations are studied in a Ramsey experiment on the transition, where a coherence time of is measured. The resulting errors are estimated by numerical solution of the optical Bloch equations with a corresponding coherence decay term. Taking into account the different magnetic field susceptibilities for the different transitions, as well as the different durations for the two shelving pulses, we estimate the errors to be and for the two -pulses respectively.
A different contribution to the shelving error results from laser frequency noise. As detailed above, this noise has few spectral contributions. Noises that are slow compared with the experiment time result in a typical laser frequency drift of two between consecutive scans of the atomic line, giving a shelving error of per pulse. The contribution of the laser linewidth to the decoherence rate is found in a Ramsey experiment on the , yielding a coherence time of . After quadratically subtracting the contribution of magnetic field fluctuations to this decoherence rate, we estimate the error owing to the linewidth of the laser alone to be in a single shelving pulse.
The finite decay probability from the level manifold during the shelving process also contributes to the state shelving error. This probability has two contributions. The first is due to the finite lifetime of the metastable level [19]. After the first shelving pulse, the electron is found at the level with high probability and therefore it decays with rate during the second shelving pulse. During the first shelving pulse this error is half as large, because, on average, only half of the population is in the manifold. Using pulse durations of and we estimate this effect to give a contribution of to the shelving error. The second contribution is due to off-resonant coupling of light to motional sidebands. This coupling results in population transfer from the manifold back to the state. The largest such contribution is due to the incoherent light in the servo bump which has a significant spectral overlap with the axial-motion sidebands, located away from the carrier. The estimated contribution to the error here is for the two shelving pulses combined.
In addition, leakage of laser light during detection can shorten the lifetime of the meta-stable state and thus reduce detection fidelity. In this experiment we find the lifetime of the level to be consistent with [19], indicating that leakage of repump light has no significant effect.
Summing up all the different contributions for the state shelving error after both -pulses we get an error estimate equal to .
| Error Source | ||||
| Initialization | ||||
| Coherent off-resonance excitation | ||||
| Incoherent off-resonance excitation | ||||
| Initialization Total Error | ||||
| Shelving | ||||
| Shelving Error Sources | pulse | pulse | pulse | pulse |
| Coherent off-resonance excitation | - | |||
| Incoherent off-resonance excitation | - | |||
| Off-resonance sideband excitation | - | |||
| level decay during shelving | - | |||
| Axial motion in the trap | - | |||
| Radial motion in the trap | - | |||
| Beam pointing noise | - | |||
| Frequency drift | - | |||
| Fast laser linewidth | - | |||
| Magnetic field noise | - | |||
| Shelving Total Error | ||||
| Overall estimated error | ||||
| Overall measured error | ||||
6.3 Error Summary
A summary of the estimated initialization and shelving errors and their sources is presented in Table 1 in units of . The total estimated errors for the and states are and respectively, whereas the measured errors of and respectively are roughly twice as large.
As the error budget suggests, one significant source for initialization and shelving errors is off-resonance excitation. This is not surprising considering that here one needs to spectrally distinguish between two states that differ by a on top of a transition. There are two main contributions to off-resonance excitation. The first is coherent and is due to the pulse finite time, while the second is incoherent and is driven by the laser servo bumps. There are several possible avenues for reducing these errors. Increasing the magnetic field and thus the separation between the qubit states will reduce the off-resonance excitation probability. Decreasing the shelving laser intensity will reduce both coherent and incoherent off-resonance excitation errors. Slowing down the shelving transition Rabi frequency, thereby increasing the pulse length, will reduce the coherent off-resonance excitation error in proportion to the laser intensity. Second, since the pulse time is proportional to the square root of the laser intensity whereas the incoherent off-resonance excitation rate is proportional to the laser intensity, the incoherent off-resonance excitation error will reduce as the intensity square root. Note that this error reduction will come at the expense of larger error contributions due to slower laser frequency noise (drift and linewidth) and magnetic field noise. The shelving laser servo bumps can be reduced by engineering a faster servo system, by using a laser that has a narrower noise bandwidth to begin with (diode laser systems are notorious for their broad frequency noise spectrum), or by spectral filtering.
Here, incoherent off-resonance excitation errors are below . However, it is worth noting that this error source becomes much larger when carrying out operations that are off-resonance from the carrier, where the servo bump and the transition carrier have a significant overlap. We observe a large error caused by the servo bump when performing Rapid Adiabatic Passage (RAP) on the transition [13], as well as when driving the motional sideband.
As mentioned above, a possible explanation for the discrepancy between the estimated and measured state errors is a deviation of the ions’ harmonic oscillator energy level distribution from a thermal distribution. Such a deviation is not surprising since in instances in which the ion motion is high, both the sideband cooling mechanism and the shelving transition are likely to fail. As an example, starting from a thermal distribution after Doppler cooling, failure to sideband cool all the instances where the ion motion is in will produce a larger shelving error than that we measure. Reducing this error contribution will require better cooling of the tail of the ion energy distribution, via e.g. second-sideband cooling.
7 High-Fidelity Quantum State Tomography
Ion-qubit state measurement is an important tool for executing many quantum algorithms [20, 21, 22] and for studying different quantum processes via state and process tomography [23, 24, 25]. In all these cases the states that are being measured do not necessarily coincide with the electronic eigen-basis (the two Zeeman states in the case of a Zeeman qubit). However, all these states are related to the electronic eigen-basis via single qubit rotations. Typically, measurement fidelity has been characterized as the average fidelity of state detection for the two electronic eigen-states (which are also the measurement eigen-basis). The fidelity of single-qubit rotations was separately benchmarked [26]. However, the error introduced by rotations is not uniformly spread over all possible input states. To this end, the experimental estimate of state tomography fidelity, averaged over all possible single ion-qubit states, is beneficial.
Qubit state tomography is represented by a quantum map . The fidelity of state tomography of a given pure input state is therefore the fidelity of this state and the reconstructed output state ,
| (2cf) |
The output state is reconstructed by
| (2cg) |
Here , and are the measured projections of on the , and axes correspondingly and are the Pauli spin operators [15]. Note that this definition of the fidelity is in agreement with Eq. 1 for the special cases of .
Here we are interested in determining the fidelity of state tomography averaged over all possible input states. A value for the fidelity, averaged over all possible qubit states, can be obtained by calculating an algebraic average of the fidelities of the six pure input states , , and [28]. These measurements require the ability to initialize the qubit in different states, as well as perform measurements in different bases. Both are achieved via qubit rotations.
The experimental sequence performed is similar to the one previously discussed. Briefly, the ion is first ground-state cooled. Then state preparation is performed; the qubit is first prepared in either the or state and when required is rotated to initialize the states. Projection measurement consists of mapping the measurement basis onto the basis, once again using qubit rotations, followed by shelving and state-selective fluorescence detection. In principle a total of 18 measurements, three for each input state, are needed. However since there is no phase information in the detection process, only nine measurements are not redundant and were therefore performed. The measurement uncertainties are determined by the amount of collected statistics. For the projections on an axis that is parallel to the input state, repetitions were performed, yielding an error of . For projections on an axis that is orthogonal to the input state repetitions were performed which yield an uncertainty of . A summary of the different measured projections and the calculated fidelities for different input states are presented in Table 2.
| X projection | Y projection | Z projection | Fidelity | |
|---|---|---|---|---|
| +z | -0.011 | -0.011 | 0.9967 | 0.9984(2) |
| -z | 0.005 | 0.005 | -0.9975 | 0.9988(2) |
| +x | 0.9948 | 0.003 | 0.005 | 0.9974(2) |
| -x | -0.9957 | 0.017 | 0.005 | 0.9979(2) |
| +y | 0.017 | 0.9948 | 0.005 | 0.9974(2) |
| -y | -0.003 | -0.9957 | 0.005 | 0.9979(2) |
| Averaged | 0.9979(2) |
The measurement fidelities here are somewhat lower than the best effort presented above. This might be due to slightly non-optimal detection parameters 222The optimal and values depend on the photon detection rates, and , which can drift due to small changes in the laser parameters.. The measurement fidelities for the states are generally lower than the measurement fidelities due to larger state initialization and detection errors caused by imperfect qubit rotations. The non-zero projections in measurement basis orthogonal to the initialization axis are due to systematic errors in the preparation and the measurement sequence (e.g. slightly incorrect pulse durations). Note, however, that all the measured state projections are within two standard deviations from the expected value 333In fact, taking into account the imbalance in the fidelities of , the projection on an orthogonal axis is expected to be . Based on the measurements performed, we calculate the averaged state tomography fidelity over the entire Bloch sphere to be .
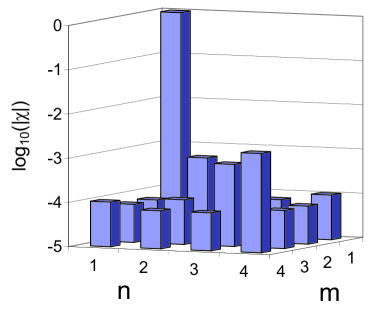
A more complete characterization of the detection process is achieved by performing full process tomography [15]. We use the chi matrix, , representation to characterize the completely positive map representing the detection process,
| (2ch) |
Here, the fixed set forms a basis for single qubit quantum maps. Ideally, the detection process would be represented by the chi matrix
| (2ci) |
corresponding to the Identity operation.
To determine the chi matrix of a single qubit map experimentally, it is enough to measure the output density matrices for the following set of four, linearly independent, input density matrices, . An explicit formula can then be obtained for the chi matrix values [15]. The non-zero orthogonal state projections, originating from systematic and statistical errors, result in a non-physical (non-positive) reconstructed chi matrix. To obtain a meaningful physical chi matrix, we therefore null all orthogonal state projections 444A different approach would have been to perform maximum likelihood estimate of a physical operation [25, 27]. However since we believe we have identified the origin of the operation non-positiveness with the small finite projection in the orthogonal direction, the better approach, in our opinion, is to null those. Two more notes: with better statistics the magnitude of orthogonal projections can be increasingly lowered by adjusting the rotation pulse time. Second, by artificially nulling these projections the estimate of the error becomes larger and is therefore pessimistic.. The absolute values of the reconstructed chi matrix entries are plotted in Fig. 5a on a logarithmic scale. As expected, , which represents the identity operation, is three orders of magnitude larger than any other entry. Other diagonal entries are an order of magnitude larger than off-diagonal entries, implying that qubit depolarization is the main error channel. The increased measurement error of superposition states, due to rotation errors, is manifested in the slightly larger (dephasing channel) as compared with and (spin-flip channels). Off-diagonal elements are due to the small imbalance between the measurement fidelity of the and the states.
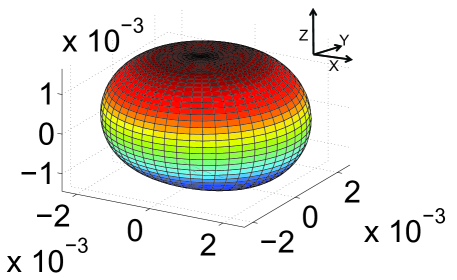
Using the obtained chi matrix, one can calculate the output of any input state, and hence also the fidelity. Figure 5b depicts the detection error over the entire Bloch sphere. The polar angle, , and the azimuthal angle, , define the pure state , whereas the radial distance from the origin in this direction indicates the error for this state. As expected from qubit depolarization an almost spherical spheroid is obtained. The resulting spheroid is also somewhat oblate due to the added error in qubit rotations and is minutely dilated in the positive hemisphere direction, owing to the slight imbalance between the measurement fidelity of the and states. Using the reconstructed chi matrix, we find the process fidelity to be .
8 Summary
In conclusion, we demonstrate high-fidelity state detection of a qubit encoded in the Zeeman splitting of the ground state of a single ion. The limitations of the best effort readout fidelity of are analyzed in detail. Our estimates of the contribution of imperfect state preparation and shelving to the measured error is . The remaining part, , results from limited state discrimination efficiency owing to the finite lifetime of the metastable level. This fraction of the error is intrinsic to our state detection scheme, and can be somewhat decreased if the information on photon detection times is used [4].
Since one of the applications of high-fidelity state detection is performing high accuracy quantum process tomography we measured the averaged state tomography fidelity over the entire Bloch sphere, which is . We also performed quantum process tomography for the detection process, and found the process fidelity to be . This fidelity can be further increased if higher fidelity qubit rotations are used.
Our measured state detection fidelity is compatible with recent estimates of the required fault-tolerance error threshold and can be used in the future to implement effective quantum error correction protocols. In addition, highly accurate quantum process tomography, important for studying basic quantum processes, can be implemented.
We gratefully acknowledge supported by the ISF Morasha program, the Crown Photonics Center and the Minerva Foundation.
9 References
References
- [1] DiVincenzo D P 2000 The Physical Implementation of Quantum Computation Fortschritte der Physik 48 771
- [2] Knill E 2005 Quantum computing with realistically noisy devices Nature 434 39
- [3] Wineland D J et al 1998 Experimental Issues in Coherent Quantum-State Manipulation of Trapped Atomic Ions J. Res. Nat. Inst. Stand. Tech. 103 259
- [4] Myerson A H et al 2008 High-fidelity readout of trapped-ion qubits Phys. Rev. Lett. 100 200502
- [5] Burrell A. H. Szwer D. J. Webster S. C. and Lucas D. M. 2010 Scalable simultaneous multiqubit readout with single-shot fidelity Phys. Rev. A 81 040302(R)
- [6] Hume D B, Rosenband T and Wineland D J 2007 High-fidelity adaptive qubit detection through repetitive quantum nondemolition measurements Phys. Rev. Lett. 99 120502
- [7] Langer C et al 2005 Long-lived qubit memory using atomic ions Phys. Rev. Lett. 95 60502
- [8] Acton M Brickman K A Haljan P C Lee P J Deslauriers L and Monroe C 2006 Near-Perfect Simultaneous Measurement of a Qubit Register Quantum Inf. Comp. 6 465
- [9] Langer C E 2006 High Fidelity Quantum Information Processing with Trapped Ions PhD Thesis University of Colorado
- [10] Olmschenk S, Younge K C Moehring D L Matsukevich D N Maunz P and Monroe C 2007 Manipulation and detection of a trapped hyperfine qubit Phys. Rev. A 76 052314
- [11] Schaetz T et al 2005 Enhanced Quantum State Detection Efficiency through Quantum Information Processing Phys. Rev. Lett. 94 010501
- [12] McDonnell M J et al 2004 High-Efficiency Detection of a Single Quantum of Angular Momentum by Suppression of Optical Pumping Phys. Rev. Lett. 93 153601
- [13] Wunderlich C 2007 Robust state preparation of a single trapped ion by adiabatic passage Journal of Mod. Opt. 54 1541
- [14] Poschinger U G et al 2009 Coherent manipulation of a spin qubit in a micro ion trap Journal of Physics B 42 154013
- [15] Nielsen M A and Chuang I L 2000 Quantum Computation and Quantum Information (Cambridge University Press)
- [16] Sengtock K, Sterr U Müller J H Rieger V Bettermann D and Ertmer W 1994 Optical Ramsey spectroscopy on laser-trapped and thermal Mg atoms Appl. Phys. B 59 99
- [17] Glickman Y et al, In preperation.
- [18] Keselman A 2010 High Fidelity Ion Qubit State Detection MSc Thesis Feinberg Graduate school, Weizmann Institute of science
- [19] Letchumanan V Wilson M A Gill P and Sinclair A G 2005 Lifetime measurement of the metastable state in using a single trapped ion Phys. Rev. A 72 12509
- [20] Barrett M D et al 2004 Deterministic quantum teleportation of atomic qubits Nature 429, 737
- [21] Riebe M et al 2004 Deterministic quantum teleportation with atoms Nature 429, 734
- [22] Chiaverini J et al 2004 Realization of quantum error correction Nature 432, 602
- [23] Riebe M et al 2006 Process tomography of ion trap quantum gates Phys. Rev. Lett. 97, 220407
- [24] Riebe M et al 2007 Teleportation with atoms: quantum process tomography New J. Phys. 9, 211
- [25] Hannemann T Wunderlich C Plesch M Ziman M and Buzek V 2009 Scrutinizing single-qubit quantum channels: Theory and experiment with trapped ions arXiv:0904.0923
- [26] Knill E et al 2008 Randomized benchmarking of quantum gates Phys. Rev. A 77, 012307
- [27] Ziman M Plesch M Bužek V and Štelmachovič P 2005 Process reconstruction: From unphysical to physical maps via maximum likelihood Phys. Rev. A 72, 022106
- [28] Bowdrey M D Oi D K L Short A J Banaszek K and Jones J A 2002 Fidelity of single qubit maps Phys. Lett. A 294 258