THE COLOR-PERIOD DIAGRAM AND STELLAR ROTATIONAL EVOLUTION
- NEW ROTATION PERIOD MEASUREMENTS IN THE OPEN CLUSTER M3411affiliation: WIYN Open Cluster Study XLV
Abstract
We present the results of a 5-month photometric time-series survey for stellar rotation periods combined with a 4-year radial-velocity survey for membership and binarity in the 220 Myr open cluster M34. We report surface rotation periods for 120 stars, 83 of which are kinematic and photometric late-type cluster members. A comparison to previous work serves to illustrate the importance of high cadence long baseline photometric observations and membership information. The new M34 periods are less biased against slow rotation and cleaned for non-members. The rotation periods of the cluster members span over more than an order of magnitude from 0.5 day up to 11.5 days, and trace two distinct rotational sequences - fast () and moderate-to-slow () - in the color-period diagram. The sequences represent two different states (fast and slow) in the rotational evolution of the late-type cluster members. We use the color-period diagrams for M34 and for younger and older clusters to estimate the timescale for the transition from the to the sequence and find 150 Myr, 150-300 Myr, and 300-600 Myr for G, early-mid K, and late K dwarfs, respectively. The small number of stars in the gap between and suggest a quick transition. We estimate a lower limit on the maximum spin-down rate () during this transition to be 0.06 days/Myr and 0.08 days/Myr for early and late K dwarfs, respectively. We compare the sequence rotation periods in M34 and the Hyades for G and K dwarfs and find that K dwarfs spin down slower than the Skumanich rate. We determine a gyrochronology age of 240 Myr for M34. The gyro-age has a small formal uncertainty of 2% which reflects the tight sequence in the M34 color-period diagram. We measure the effect of cluster age uncertainties on the gyrochronology age for M34 and find the resulting error on the gyro-age to be consistent with the error estimate for the technique in general. We use the M34 sequence to redetermine the coefficients in the expression for rotational dependence on color used in gyrochronology. Finally, we propose that stability in the phase, shape, and amplitude of the photometric variability for the 120 rotators over the 5 month duration of our survey, is due to spot generation at active stellar longitudes.
1 INTRODUCTION
The angular momentum of a late-type star is not conserved and is depleted at varying rates over its lifetime. The changes with time of this fundamental stellar property is an integral part of the formation and evolution of the Sun and stars similar to it. Our understanding of the rate and timing of the depletion of stellar angular momentum is tied to our understanding of the physical mechanisms responsible for redistribution of angular momentum inside of stars, and for the generation and evolution of the magnetic fields by which angular momentum is lost externally. Observing the rotational evolution for late-type stars of different masses, and thus different internal structures, is a critical step toward identifying which physical processes are at work and when.
Open star clusters present coeval and homogeneous populations of stars over a range of masses and with well known ages. They are therefore ideal systems for studying stellar rotation as a function of mass and age. Calibrated relationships, based on observations in clusters, allow rotation to be used as an indicator of stellar age (gyrochronology, see e.g. Barnes, 2003, 2007; Mamajek & Hillenbrand, 2008; Soderblom, 2010). An important early example is the study by Skumanich (1972) of solar-type stars in the Pleiades and Hyades from which the relation between stellar projected rotation velocity and age () derive. Subsequent observations of for late-type dwarfs in young () open clusters revealed bimodality and large dispersions in rotation rates, but no clear relationship to stellar mass (e.g. Soderblom et al., 1983, 1993; Stauffer et al., 1984, 1985, 1989; Stauffer & Hartmann, 1987; Terndrup et al., 2000; Soderblom et al., 2001; Terndrup et al., 2002). In the Hyades (625 Myr; Perryman et al., 1998), Radick et al. (1987) found that the rotation of even the most rapidly spinning F, G, and K (FGK) dwarfs has converged toward a mass-dependent rate. Such observations combined with rotational data for late-type stars in the pre main-sequence (PMS) phase (see Herbst et al., 2007, for a review), have shown that their early angular momentum evolution is highly dynamical and that there are gaps in our understanding of it.
Models of the evolution of angular momentum have developed in parallel with the observations and have become increasingly sophisticated. The angular momentum loss rate for a late-type star is expressed in terms of its spin velocity, mass, radius, and mass loss rate through a magnetized stellar wind (e.g. Kawaler, 1988; Pinsonneault et al., 1989; Bouvier et al., 1997; Sills et al., 2000; Barnes et al., 2001; Denissenkov et al., 2010). The loss rates predicted by Weber & Davis (1967) and subsequent theoretical studies are consistent with the observed Skumanich relation under certain assumptions about the production (a linear dynamo) and geometry of the stellar magnetic field. However, to account for the observed evolution from the PMS phase to the Sun, current models have come to include additional elements such as “saturation” of the wind-loss at a mass-dependent threshold rotation velocity (e.g. MacGregor & Brenner, 1991; Chaboyer et al., 1995; Barnes & Sofia, 1996; Krishnamurthi et al., 1997; Sills et al., 2000; Tinker et al., 2002), magnetic braking of stellar rotation by a circumstellar disk during the PMS phase (“disk-locking”, e.g. Koenigl, 1991; Shu et al., 1994; Krishnamurthi et al., 1997; Barnes et al., 2001; Sills et al., 2000; Denissenkov et al., 2010) and decoupling followed by re-coupling on a mass-dependent timescale of the star’s radiative core and convective envelope (e.g. Endal & Sofia, 1981; MacGregor & Brenner, 1991; Jianke & Collier Cameron, 1993; Denissenkov et al., 2010). The increasing complexity of the models stresses the importance of obtaining and analyzing new and better observational data, especially at ages between the Pleiades (125 Myr) and the Hyades (625 Myr).
Presently, measurements of the surface rotation velocity or period provide the best empirical constraints on stellar angular momentum models. Early studies in open clusters measured primarily , requiring only one measurement of the Doppler broadening of spectral lines to produce a result. This technique is useful for stars that rotate faster than a threshold velocity set by the spectral resolution, but the result is ambiguous due to the unknown stellar radius () and spin-axis inclination (). Accordingly, recent work has focused on direct measurements of the stellar rotation period from brightness modulations by star spots (e.g. Prosser et al., 1995; Krishnamurthi et al., 1998; Barnes, 2003; Irwin et al., 2007; Meibom et al., 2009; Collier Cameron et al., 2009; Hartman et al., 2009, 2010a). The rotation period is independent of and and only mildly affected by latitudinal differential rotation. Its detection is limited to stars with periodic brightness variations with amplitudes above a threshold set by the photometric precision and requires access to uninterrupted telescope time with a duration of at least twice the number of nights of the longest period one wants to measure. Nevertheless, dedicated time-series photometric surveys of cool stars in young open clusters have begun to reveal mass- and time-dependencies on stellar rotation not previously discernible in the data (e.g. Barnes, 2003; Hartman et al., 2009) - and in particular when combined with information about cluster membership to produce the cleanest samples (Meibom et al., 2009; Collier Cameron et al., 2009; Hartman et al., 2010a).
The emergence from these studies of distinct groups of coeval fast and slowly rotating stars, forming tight “rotational sequences” in the color vs. rotation period plane, have opened a new window on the angular momentum evolution of late-type stars. Indeed, the observed time- and mass-dependent changes in the distributions of stellar rotation period vs. color, promise to make the color-period diagram an important testing ground for future models of angular momentum evolution - much like the color-magnitude diagram was and still is for models of stellar evolution.
This paper joins a series of studies to employ the color-period diagram in order to empirically describe the relationship between stellar surface rotation, age, and mass for late-type stars. Our earlier study (hereinafter Paper I; Meibom et al., 2009) targeted the 180 Myr open cluster M35. Here we present the results of an extensive multi-month time-series photometric survey for rotation periods and a multi-year spectroscopic survey for membership and binarity in the field of the open cluster M34 (NGC 1039). M34 is a northern hemisphere cluster located 470 pc (Jones & Prosser, 1996) toward the galactic anti-center (, ; , ) with an estimated reddening of (Canterna et al., 1979). Recent age estimates derived from fitting stellar evolution isochrones to the cluster color-magnitude diagrams range from 177 Myr (Meynet et al., 1993) to 251 Myr (Ianna & Schlemmer, 1993). James et al. (2010) derived a mean gyrochronology age of Myr. We adopt a fiducial (average) stellar evolution age of 220 Myr for this paper. The metallicity of M34 is found to be close to solar (Fe/H ; Schuler et al., 2003; Steinhauer, 2010).
Section 2 describes the photometric and spectroscopic observations, data-reduction, and determination of rotation periods and cluster membership. Section 3 presents our results and comparisons to results from prior rotational studies in M34. Section 4 offers analysis and discussion of the M34 color-period diagram in the context of early angular momentum evolution and of gyrochronology. Summary and conclusions are given in Section 5.
2 OBSERVATIONS, DATA-REDUCTION, AND ROTATION PERIOD DETERMINATION
The photometric and spectroscopic observations presented in this paper for stars in M34 were taken in parallel with the observations for Paper I. We have reduced and analyzed the M34 data using the same procedures and methods. Thus, we provide here only basic information about the observations, data-reduction, and determination of rotation periods and cluster membership, and refer to Meibom et al. (2009) for a more detailed description.
2.1 Time-series photometry
2.1.1 Observations
We obtained time-series photometry over a time-span of 143 days for a region centered on the open cluster M34. The photometric data were obtained in the Johnson V-band with the WIYN 0.9m telescope 111The 0.9m telescope is operated by WIYN Inc. on behalf of a Consortium of ten partner Universities and Organizations (see http://www.noao.edu/0.9m/general.html) on Kitt Peak equipped with a field-of-view CCD camera.
The dataset presented is composed of images from high-frequency (approximately once per hour for 5-6 hours per night) time-series photometric observations over 16 full nights from 2-17 December 2002, complemented with a queue-scheduled observing program over 143 nights from 22 October 2002 to 11 March 2003, obtaining one image per night interrupted only by bad weather and scheduled instrument changes. The result is a database of differential V-band light curves for 5,656 stars with .
The sampling frequency of the December 2002 observations allows us to detect photometric variability with periods ranging from less than a day to about 10 days. The long time-span of the queue-scheduled observations provide data suitable for detecting periodic variability of up to 75 days, and for testing the near-term stability of photometric variations. From this database we derive rotation periods for 120 stars.
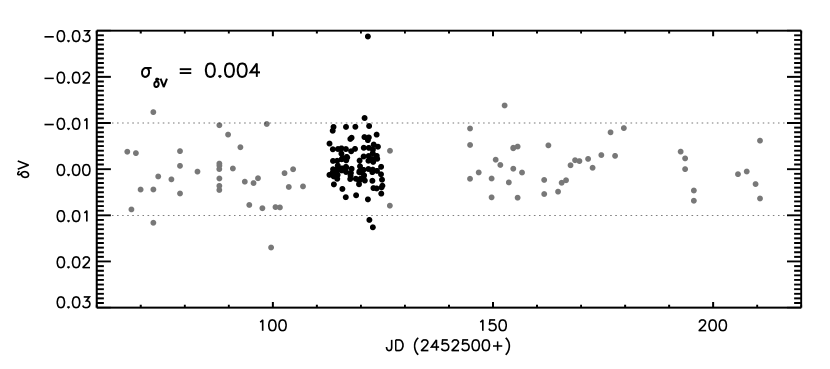
Figure 1 displays the time-series data from both observational programs for a photometrically non-variable star. Black symbols represent the high-frequency observations and grey symbols represent the queue-scheduled observations.
2.1.2 Basic reductions, photometry, and light curves
Basic reductions of our CCD frames, identification of stellar sources, and computations of equatorial coordinates222We used data from the STScI Digitized Sky Survey; The Digitized Sky Surveys were produced at the Space Telescope Science Institute under U.S. Government grant NAG W-2166. were done using standard IRAF packages. Instrumental magnitudes were determined from Point Spread Function (PSF) photometry using the IRAF DAOPHOT package. The analytical PSF and a residual look-up table were derived for each frame based on 30 evenly distributed isolated stars. The number of measurements in the light curves vary because stars near the edges of individual frames may be missed due to telescope pointing errors, while bright stars near the CCD saturation limit and faint stars near the detection threshold may be excluded on some frames because of variations in seeing, sky brightness, and sky transparency. To ensure our ability to perform reliable time-series analysis on stars in our database, we have eliminated stars that appear on fewer than 50 frames.
We applied the Honeycutt (1992) algorithm as implemented in Stassun et al. (1999, 2001) for differential CCD photometry to our raw light curves to remove non-stellar frame-to-frame photometric variations. Figure 2 shows the standard deviation of the photometric measurements as a function of the apparent V magnitude for each star in the field of M34. The relative photometric precision is 0.5% for stars with .

2.1.3 Photometric period detection
We employed the Scargle (1982) periodogram analysis to detect periodic variability in the light curves because of its ability to handle unevenly sampled data. We searched 5000 frequencies corresponding to periods between 0.1 day and 90 days. The lower search limit was set at a period ensuring critical sampling based on the Nyquist critical frequency for our high-frequency data (, where is the sampling interval of 1 hour). The upper limit was set at 90 days because a star with a 90-day period would complete about 1.5 cycle over the 143 nights of the survey.
A false alarm probability (FAP), the probability that a signal detected at a certain power level can be produced by statistical fluctuation, was calculated as the measure of confidence in a detected period. The FAP for each star is based on a two-dispersion Monte Carlo calculation generating 100 synthetic light curves. The maximum power of the resulting 100 periodograms was adopted as the level of 1% FAP, and used as the initial threshold for detecting significant photometric variability. For all stars that met the FAP criterion we examined - by eye - the periodogram and raw and phased light curves. We report stellar rotation periods for 120 stars in our database (see Table 1 in Appendix B).
2.2 The Spectroscopic Survey
We observed M34 from 2001 to 2004 as part of the WIYN 333The WIYN Observatories are joint facilities of the University of Wisconsin-Madison, Indiana University, Yale University, and the National Optical Astronomy Observatories. Open Cluster Study (WOCS; Mathieu (2000)). A total of 3320 spectra has been obtained of 437 FGK stars within a 1-degree field centered on the cluster. The selection of spectroscopic target stars was based on photometric membership data (Deliyannis (2010), see Section 2.3). In the M34 vs. color-magnitude diagram (CMD), stars on or less than above and less than below the cluster main sequence were selected between of 12 () and 17 (). All spectroscopic data were obtained using the WIYN 3.5m telescope equipped with a multi-object fiber optic positioner (Hydra) feeding a bench mounted spectrograph. Observations were done at central wavelengths of 5130Å or 6385Å with a wavelength range of 200Å including many narrow absorption lines as well as the Mg B triplet. Radial velocities with a precision of (Geller et al., 2008) were derived from the spectra via cross-correlation with a high sky spectrum.
Of the 120 stars with rotation periods presented in this study, 74 have one or more radial-velocity measurements (the remainder being below the faint limit of the spectroscopic survey or photometric non-members). The radial-velocity cluster membership probability of each star is calculated using the formalism by Vasilevskis et al. (1958) and the stellar mean radial velocity. We have adopted as the threshold for assigning radial-velocity cluster membership. A separate paper describing the spectroscopic survey of M34 and presenting the resulting membership information will follow.
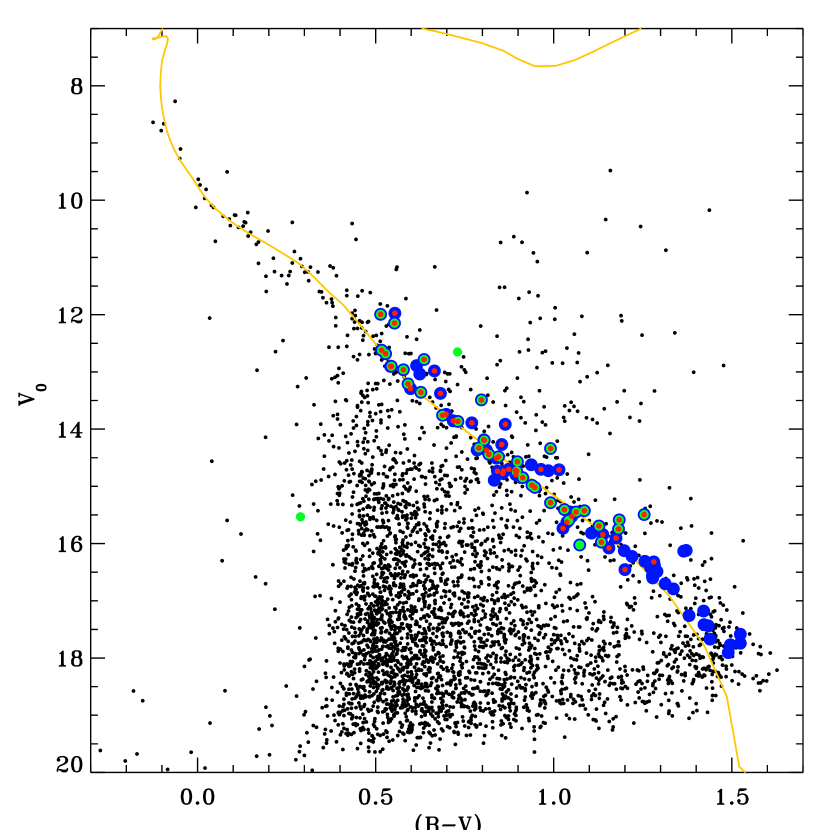
2.3 The M34 Color-Magnitude Diagram and Cluster Membership
Figure 3 shows the vs. color-magnitude diagram (CMD) for M34. The photometry was kindly provided by Deliyannis (2010) who obtained BVRI data over a field on the cluster using the WIYN 0.9m telescope. We highlight only those of the 120 rotators that have been found to be either photometric, proper-motion (Jones & Prosser, 1996), or radial-velocity cluster members. Stars selected as photometric members are shown in blue. Stars that are proper-motion members are overplotted in green. Radial-velocity members are marked in red. The fraction of late-F and G dwarf members in M34 with measured rotation periods is 22%, and the fraction of K dwarf members in M34 with measured rotation periods is 23%. We thus find no difference in the detection rate as a function of stellar color (mass) or brightness in the range of interest to this study.
Of the 92 photometric members 9 are kinematic non-members bringing the sample of cluster members with rotation periods to 83 stars. These 83 stars constitute our study sample for M34 in this paper.
3 RESULTS
3.1 Rotation periods
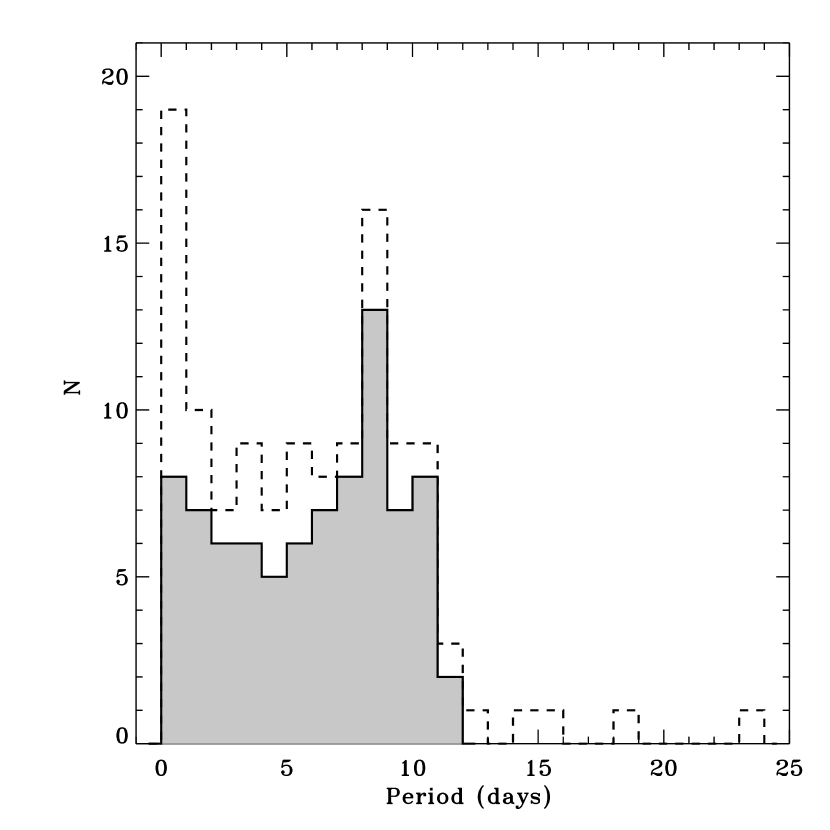
Figure 4 shows the distribution of all 120 rotation periods determined in this study. The distribution spans over more than an order of magnitude from from 0.1 days to 23 days, showing that we are capable of detecting rotation periods down to the pseudo-Nyquist period-limit of about 2 hours ( days) resulting from our sampling cadence of about in December 2002. The shortest rotation period for a cluster members is 0.49 days, suggesting that the lower limit of 0.1 days for our period search was set appropriately for the stars in M34. The long-period tail of the period distribution for all 120 rotators falls off at 12-13 days, but 4 stars have longer periods. The longest rotation period among cluster members is 11.5 days, while rotation periods of 14, 15, 18, and 23 days are found among field stars. This may suggest that we observe a physical upper limit on the rotation period distribution among FGK dwarfs in M34. It is possible that we are not detecting the photometric variability of members with even slower rotation if the frequency and size of spots on such stars is insufficient for detection with the photometric precision of our data (e.g. Stassun et al., 2004, 2007). Constraining the rotation for such slowly rotating stars will require either higher photometric precision (see e.g. Hartman et al., 2010b; Irwin et al., 2010) or high-resolution () spectroscopic observations to measure projected rotation velocities.
3.2 The M34 color-period diagram
We focus now on the 83 members of M34 with measured rotation periods. In Figure 5 we display their rotation periods against their color indices. Dark blue symbols represent stars that are both photometric and kinematic (radial-velocity and/or proper-motion) members of M34. Light blue symbols are used for stars that are photometric members only. The color indices derive from the multi-band photometry by Deliyannis (2010, Section 2.3) corrected for a reddening of . The corresponding stellar masses are estimated from a 200 Myr Yale isochrone (Yi et al., 2003, see Figure 3) and marked on the upper x-axis. As in Paper I, we use the dereddened color index as the primary independent variable because the corresponding stellar mass is model dependent and includes additional errors and uncertainties in the color-mass transformation.
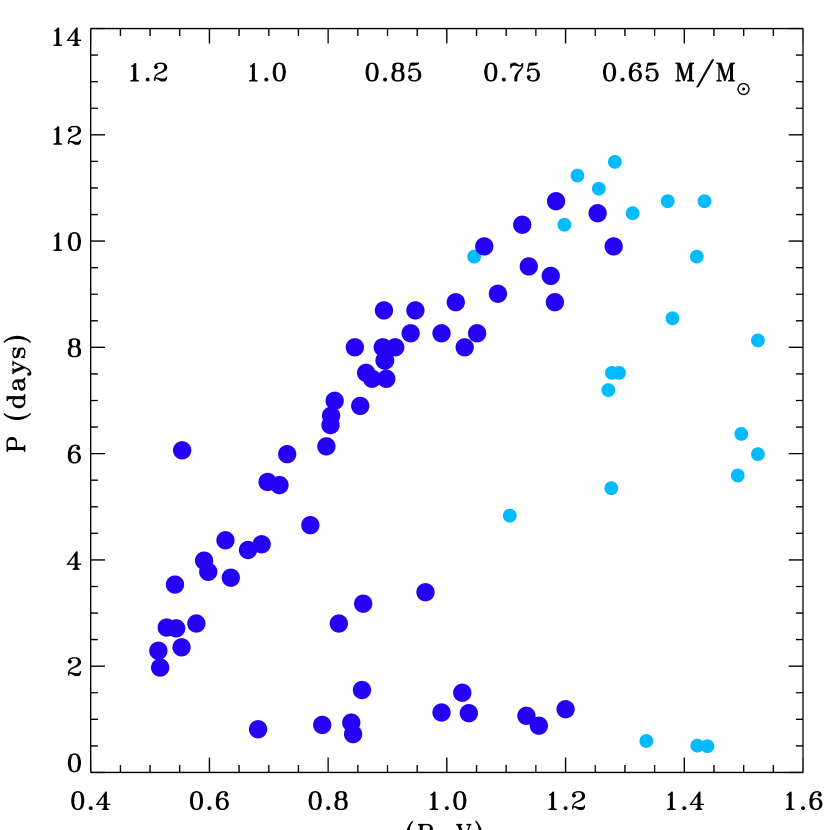
M34 is less rich and closer than M35 (Paper I) and in a less crowded stellar field. Therefore, on average, more radial-velocity measurements were obtained on any given candidate cluster member and to a fainter magnitude limit. Stars with variable radial velocities were observed more frequently than velocity stable stars. The median number of velocity measurements for radial-velocity members is 10, with a minimum and a maximum of 3 and 18 velocities, respectively. Accordingly, the M34 color-period diagram represent an exceptionally “clean” sample of coeval single and close binary FGK dwarfs, showing the preferred stellar rotation periods as a function of color for 220 Myr late-type stars. The 83 members lay primarily along two rotational sequences. One sequence displays a narrow diagonal band of stars whose periods are increasing with increasing color (decreasing mass). The second sequence consists of rapidly rotating ( days) stars. A subset of stars are found distributed between these two sequences, and one late-F single member has a rotation period about twice that of similar cluster stars placing it above the diagonal sequence in Figure 5.
Our spectroscopic survey allow us to identify single and close binary stars among the M34 members. Figure 6 shows the location in the color-period diagram of 19 single and 6 close binary members. The single stars are marked with additional filled black circles. These stars have 5 or more radial-velocity measurements with a standard deviation of less than (our radial-velocity measurement precision). Stars identified as close binaries are marked with additional open circles. These stars have between 14 and 18 radial-velocity measurements with a standard deviation above (). The remaining (36) radial-velocity members have velocity standard deviations in the “grey-zone” between and . Orbital parameters have been determined for 5 of the close binaries. These are marked with arrows in Figure 6. The binary primary star with days and is in a 4.39 day circular () orbit and thus rotates at a sub-synchronous velocity. The 8 day rotation period is confirmed by James et al. (2010), and in neither study does a 4.39 day rotation period lead to a well-phased light curve. This binary and its tidal evolution is discussed in Meibom et al. (2006). The binary primary star with days and is in a 4.30 day circular () orbit, and has synchronized its rotation to its orbital velocity. The three remaining binaries with orbits have periods of 280, 715, and 1075 days. We refer to Meibom et al. (2006, Section 5) for a discussion of why the detected photometric variability represent rotation of the binary primary star. Further study of the distribution of single and binary primary stars in the color-period diagram will be presented in a forthcoming paper.
3.3 Comparison with previous work
Two recent papers present rotation periods for late-type stars in M34 based on time-series photometry. Irwin et al. (2006) determined rotation periods for 105 stars and James et al. (2010) for 55 stars. Only 58 of the Irwin et al. rotators fall within the color-range of rotators in James et al. and the present study (). Neither the Irwin et al. nor the James et al. studies have membership information beyond the results from Jones & Prosser (1996).
We compare here the rotation periods for stars in common between the two studies and our own. This comparison serves as a test of our own results as well as to illustrate how 1) the time-span and cadence of the photometric time-series affects the ability to correctly determine the rotation periods for, in particular, more slowly rotating stars, and 2) erroneous period determinations combined with contamination from field stars can conspire to obscure the dependencies between stellar rotation and color (mass).
Figure 7 shows a direct comparison of rotation periods for 33 stars (left) and 29 stars (right) in common between the present study and Irwin et al. (2006) and James et al. (2010), respectively. Allowing for a 10% deviation to accomodate period uncertainties, we find that for periods beyond 5 days, half of the periods published by Irwin et al. are significantly shorter than ours. This systematic trend toward shorter periods (bias against longer periods) in the Irwin et al. study is almost certainly due to the nature of their observations of M34 - half nights over a relatively short 10-night campaign. We note that the overall photometric precision of the two studies is similar. The comparison thus demonstrates the importance of the long time baseline and the frequency of observations to measure the true periods for the more slowly rotating cluster members.
With a 17-night baseline and observations acquired throughout the entire nights, the rotation periods determined by James et al. (2010) are in better agreement with ours. Four periods of 6 days and longer deviate significantly, with 3 of the James et al. periods lying on or close to the phase-halving line. We too have 3-4 gap stars (see Figure 5) with periods near half the period of corresponding stars on the sequence. In all three studies, if such periods are indeed half the true periods, it is likely because of spots at two opposite active longitudes at the time of the observations that could not be resolved with the sampling and photometric precision in the respective datasets.


While seemingly innocuous in Figure 7, erroneous period detections combined with small stellar samples and contamination from field stars can act to obscure the dependencies of stellar rotation on mass and age revealed in color-period diagrams for open clusters. This is well illustrated by a comparison of the color-period diagrams with the results of the three studies of M34. We show in Figure 8 the color-period diagrams based on the results from Irwin et al. (2006, top), James et al. (2010, center), and from the present study (bottom). We have used the color-color transformation by Caldwell et al. (1993) and to convert the colors in Irwin et al. (2006) to . We note that the areal coverage of the Irwin et al. and James et al. surveys are 75% and 50% of ours. However, the comparison is qualitative and the number of erroneous period determinations and the contamination by field stars will increase in proportion to the number of stars observed (area). We note that the differences between the current and prior studies are not due to just deviating periods among cluster members or just contamination by non-members, but rather a combination of both.
While all three color-period diagrams in Figure 8 capture the large dispersion in stellar rotation among late-type stars in M34, the striking morphology visible in our new results is largely hidden in the top and center panels. Previous authors (e.g. Barnes, 2003; Meibom et al., 2009; Hartman et al., 2009; Irwin et al., 2009; James et al., 2010) have noted persistent features in the period-color diagram. The diagonal sequence of stars on which rotation periods increase with color, the sequence of rapidly rotating stars, and the region in between, was dubbed the sequence, the sequence, and the gap, respectively, by Barnes (2003, hereinafter B03). We demonstrate in the sections to follow how the rotational sequences in the color-period diagram for clusters of different ages enable detailed study of the angular momentum evolution of cool stars.

Finally, Figure 9 shows the measurements from Soderblom et al. (2001) against our rotation periods for 12 members of M34. The solid, dashed, and dotted curves show the relation between rotation period and the for a solar-like star with a , , and inclination of the rotational axis, respectively. The 3 stars with rotation periods of day have correspondingly high values.

4 ANALYSIS AND DISCUSSION
The color-period diagrams for young open clusters like M34 have emerged as important tools for describing the rotational properties of low-mass stars after the PMS phase (e.g. Irwin et al., 2009; Meibom et al., 2009; Hartman et al., 2009, 2010a; James et al., 2010). The mass- and time-dependent changes of the sequences in the color-period diagram therefore makes it an important testing ground for models of stellar angular momentum evolution - much like the Hertzsprung-Russell diagram for models of stellar evolution. Here we compare the M34 color-period diagram to those of younger and older clusters with the goal of estimating the timescale and rate for spin-down of the stellar surface and its dependence on stellar mass.
4.1 Timescales for transition from fast to slow rotation
In Figure 10 we show the color-period diagram for M34 with the color-period diagrams for the Pleiades (125 Myr), M35 (180 Myr), NGC3532 (300 Myr), M37 (550 Myr), and the Hyades (625 Myr). The diagrams are shown in chronological order with the youngest cluster in the top panel. All clusters display distinct and sequences and sample well the age range between the ZAMS and the age of the Hyades. We can use this line-up of color-period diagrams to estimate the timescale for the rotational evolution of stars off the sequence and onto the sequence for stars of different masses.
Already by the age of the Pleiades and M35 the number of rapidly rotating G dwarfs on the sequence is small, whereas the G dwarfs sequences are rich and well defined. Observations in the even younger clusters IC2391 (30 Myr Patten & Simon, 1996), IC2602 (30 Myr Barnes et al., 1999), and Alpha Per (50 Myr Prosser et al., 1993) find sequences well populated by G dwarfs (see Barnes, 2003). Together, these results suggest that the characteristic timescale for G dwarfs to evolve off the sequence and onto the sequence is less than 150 Myr. By the 300 Myr age of NGC3532, the rich populations of early- and mid-K dwarfs found on the M35 sequence have evolved onto the sequence, while the NGC3532 sequence and gap are populated by late K dwarfs. This change suggests that early to mid K dwarfs evolve onto the sequence on a timescale between 150 and 300 Myr, or approximately twice the time required for G dwarfs. Finally, by the age of M37 and the Hyades, mostly early M dwarfs are found on the sequence or in the gap, suggesting that late-K dwarfs evolve off the sequence and onto the sequence within 600 Myr, or approximately twice the time required for the early to mid K dwarfs.

The low density of stars in the gap region for all of these young clusters indicates that stars spend less time in this part of the diagram than on the and sequences (a feature of the color-period diagram that is similar to the Hertzsprung-gap in the color-magnitude diagram). The narrow and sequences in both the Pleiades and M35 also suggest that the rapidly rotating stars lose little angular momentum until they quickly evolve through the gap and onto the sequence. Accordingly, their surface spin-down rate () must reach a maximum value in the gap. We can derive a rough estimate of for K dwarfs from the and sequences for the Pleiades. To that end we make the assumption that the Pleiades sequence represent the rotation periods for K dwarfs at the ZAMS and that the periods of the Pleiades K dwarfs on the sequence are representative of post-gap rotation. Accordingly, the early K sequence dwarfs with periods of 6 days and the late K sequence dwarfs with periods of 8 days have spun down from the 0.5 day periods over 100 Myr. This corresponds to of 0.06 days/Myr and 0.08 days/Myr for early and late K dwarfs, respectively. These are crude estimates, as described, and the spin-down rate will not be constant as a star transition through the gap. The maximum will likely be higher than the derived values.
The timescales for the transition from fast ( sequence) to slow ( sequence) surface rotation as well as the lower limit on the maximum spin-down rate though the gap, offer constraints on the rates of internal and external angular momentum transport and on the evolution of stellar dynamos in late-type stars of different masses.
4.2 Testing the Skumanich Spin-Down Rate Between M34 and the Hyades
We show in Figure 11 (left) the color-period diagrams for M34 and the Hyades. The rotational evolution over the 400 Myr age-gap is clearly visible with the Hyades sequence G and K dwarfs offset to longer periods. Also, the 3 late K/early M Hyades sequence dwarfs appears to have evolved into the gap. Once stars have converged in their rotational evolution onto the sequence it is assumed that they steadily lose angular momentum through a solar-type wind and spin-down following the Skumanich spin-down law. Indeed, Skumanich (1972) used measurements for early-G sequence stars in the Pleiades and Hyades. With a well-defined sequence extending to late-K dwarfs in M34 we can directly test whether the evolution of the surface rotation period for K dwarfs follow the time-dependence between the ages of M34 and the Hyades. In the right panel of Figure 11 we have artificially spun up the Hyades stars by a factor of in accordance with the Skumanich spin-down law. The spun-up Hyades sequence G dwarfs coincide with the corresponding M34 stars, while the Hyades sequence K-dwarfs have rotation periods systematically shorter than the M34 K dwarfs. We conclude that while the G dwarfs follow the Skumanich spin-down law, the K-dwarfs spin down slower than the rate from 220 Myr to 625 Myr. A similar result was found from our comparison of M35 (180 Myr) with the Hyades (Paper I).

4.3 Gyrochronology and the gyro-age of M34
The sequence in the color-period diagram, onto which essentially all FGK dwarfs evolve within 600 Myr (see Figure 10), provide the basis for establishing empirically the relationship between stellar rotation and stellar color (mass) at a given age. Accordingly, color-period diagrams for clusters of different ages can be used to establish the relationships between stellar rotation and stellar age for stars of different masses.
B03 introduced, and Barnes (2007, hereinafter B07) modified, a heuristic functional form () to represent the dependency of the sequence. define one-parameter families, with that parameter being the age of the stellar population, and the resulting curves in the color-period plane represent rotational isochrones. B07 proposed
| (1) |
with values for the , , , and coefficients determined using the sequences from multiple young open clusters. A value of 0.52 was determined for the index in by demanding solar rotation at solar age. We note that Mamajek & Hillenbrand (2008) determined different coefficients in the gyrochronology relation than B07.
In Paper I we used the tight M35 sequence to redetermine the , , and coefficients in . Here, we wish to use determined from the M35 sequence to determine a new gyrochronology age (gyro-age) for M34. Furthermore, to illustrate the effect of an uncertainty in the age of M35 on the gyro-age for M34, we determine from M35 using three different ages for that cluster that span the range set by modern photometric studies: 160 Myr (Sarrazine et al., 2000), 180 Myr (Kalirai et al., 2003), and 200 Myr (Sung & Bessell, 1999). Table 1 lists the , , and coefficients for resulting from non-linear least squares fits of to the M35 sequence with , , and , respectively. Note that only the coefficient is affected significantly by a change in age.
| Coefficient | M35 | M35 | M35 | M34 |
|---|---|---|---|---|
| a | ||||
| b | ||||
| c |
Using the three sets of coefficients (and ) and assuming no prior knowledge of the age of M34 (letting be a free parameter), we perform a non-linear least squares fit of to the M34 sequence stars. The best fits for the three different isochrones all fall within the black solid curve shown in the left panel of Figure 12. The corresponding gyro-ages are , , and , respectively, for assumed M35 ages of 160 Myr, 180 Myr, and 200 Myr. The range in gyro-ages for M34 directly reflects the assumed uncertainty on the age of M35 through the coefficients in . It corresponds to deviations from the mean gyro-age of 240 Myr that results from using an age of 180 Myr for M35 - the age adopted for this paper. For comparison, B07 estimate the representative errors associated with the gyrochronology technique to 15% based on a more sophisticated analysis of errors in the measured stellar rotation periods, colors, and cluster ages. The range in M34 gyro-ages overlaps with the range of stellar evolution ages for the cluster and include the mean stellar evolution age of 220 Myr adopted for this paper. We conclude that the gyro-ages derived for M34 are consistent with the stellar evolution age for the cluster, and that the measured effect of age uncertainties for M35 on the M34 gyro-age is consistent with the error analysis by B07. We adopt the gyro-age of 240 Myr for M34 corresponding to an age of 180 Myr for M35.
We emphasize the small formal () error on the gyrochronology age of M34. Assuming that all sequence stars are truly coeval, the 5 Myr standard error gives a formal uncertainty on the gyro-age for M34 of only 2%. This small formal uncertainty, which does not include possible systematic errors in gyrochronology, reflect the well-defined sequence in M34. We show in the right panel of Figure 12, the distribution of gyro-ages for all M34 sequence stars calculated using with coefficients determined from M35 with an assumed age of 180 Myr. The mean and median ages of the distribution are 240 Myr and 246 Myr, respectively. The most deviant gyro-ages in the distribution ( and ) are for late F and early G type stars near the blue and steepest part of the sequence, where the deviation from the rotational isochrone is a larger fraction of the stellar rotation period.


As demonstrated, the method of gyrochronology relies on fitting the sequence with a rotational isochrone. The isochrone’s functional dependence between stellar color and rotation period will thus directly affect the derived gyro-age. To constrain the color-period relation further we redetermine the , , and coefficients of Equation [1] from a non-linear least squares fit to the M34 sequence stars with a fixed cluster age () of 220 Myr. The coefficients with uncertainties are listed in Table 1 and the corresponding rotational isochrone is shown in Figure 13. To illustrate how closely the isochrone trace the sequence, we plot a dashed curve representing the moving average of the rotation periods along the sequence.
The translational term in Equation 1, fixed to 0.4 by B07 to allow for more blue stars to be fitted, corresponds to the color for F-type stars at the transition from a radiative to a convective envelope. This transition was noted from early observations of stellar rotation (the break in the Kraft curve, Kraft (1967)) and is associated with the onset of effective magnetic wind breaking (e.g. Schatzman, 1962). The fitted values of for M35 and M34 suggest that blue (high-mass) end of the sequence begins at the break in the Kraft curve and set the color of the break to 0.472 and 0.481, respectively.
4.4 Long-term stability of stellar spots and spot-groups
The majority of the 120 phased light curves shown in Appendix A (Figure 14), for both cluster and field stars, display a notable stability in the phase, shape, and amplitude of photometric variability over the 5 month duration of our survey. We discuss here two possible explanations for this stability: 1) Spots on the observed stars are significantly longer lived than sunspots, or, 2) Spots on the observed stars tend to emerge non-uniformly at preferred long-lived active longitudes.
Let us first examine the idea of long-lived starspots. On the Sun, larger sunspots live longer, with lifetimes increasing linearly with area. To first order, however, the solar log-normal spot size distribution is strongly dominated by small spots and largely unchanged (except for an overall scaling factor) over the solar cycle (Bogdan et al., 1988). Even permitting a small fractional increase in larger spots at cycle maximum, allowed by the solar data, Solanki & Unruh (2004) found that when extrapolating to very active stars, small spots below the resolution limit still dominate. Furthermore, the enhanced differential rotation expected in the more rapidly rotating stars (; Donahue et al., 1996) would tend to decrease spot lifetimes due to increased shear. Thus we do not expect that an increase in numbers of spots will significantly change the average spot lifetime on stars.
We also note that there is no direct evidence that the solar log-normal spot size distribution holds for other stars. However, there is evidence that small spots dominate stellar surfaces. Measurement of TiO band depths (e.g. O’Neal et al., 1996) imply that a large number of unresolved spots are present on active stars, and high precision photometric measurements during stellar (Jeffers et al., 2006) and exoplanet eclipses (Pont et al., 2007; Lanza et al., 2009; Silva-Valio et al., 2010) indicate spots and spot groups similar in size to solar. Finally, there is also direct evidence that starspot lifetimes are short (Mosser et al., 2009) even if the lifetimes of large-scale spot groups can seem long on similar stars (e.g. Hussain, 2002).
To reconcile these apparently disparate observations, the second possibility can be invoked: starspots emerge at preferred longitudes. If the “spots” seen by most photometric (and Doppler imaging observations) are actually mostly spot groups consisting of a range of smaller spots emerging at preferred longitudes, the observed spottedness can be maintained for long periods even if the underlying individual spots come and go. The only requirement is that the emergence rate is sufficiently high to maintain a quasi-steady “spot” size, but this is expected - at least on stars as young and active as those in M34. The Sun too shows evidence for preferred longitudes (Berdyugina & Usoskin, 2003), but the phenomenon is widespread in active stars (Korhonen & Järvinen, 2007). While seen most often in binaries, preferred longitudes are also observed in single stars (Berdyugina & Järvinen, 2005). We therefore suggest that the five month stability of rotational patterns on most of our objects is due to enhanced spot generation rates coupled with preferred longitudes of spot emergence.
5 SUMMARY AND CONCLUSIONS
We present the results of an extensive time-series photometric survey over 5 months of late-type members in the 220 Myr open cluster M34. We obtain a photometric precision of 0.5% and light curves for 5,656 stars with over a field on the cluster. We measure surface rotation periods for 120 stars and determine their cluster membership and binarity from the results of a 4-year radial-velocity survey in M34 and from published proper-motion measurements. The result is surface rotation periods for 83 kinematic and/or photometric cluster members.
The rotation periods of the 83 cluster members span over more than an order of magnitude from 0.5 day up to 11.5 days. Plotted as a function of stellar color in the color-period diagram, the 83 periods provide an exceptionally clear definition of the relationship between stellar rotation and stellar mass at 220 Myr. A comparison of our periods with those of recently published photometric surveys in M34 underscores the importance of high frequency and long time-baseline observations to minimize false period determinations, and of cluster membership information to minimize field star contamination.
The 83 rotation periods in M34 trace two distinct rotational sequences in the color-period diagram, representing two different states in their rotational evolution. Color-period diagrams for select younger and older clusters show similar sequences, and we compare these with M34 to study the mass-dependent timescales and rates of the spin-down of late-type stars. Analysis of the chronologically sorted color-period diagrams supports the idea that late-type stars evolve from fast to slow rotation on a timescale that is inversely related to the stellar mass. We estimate the timescales for the rotational evolution off the sequence and onto the sequence for G, early-mid K, and late-K dwarfs, respectively, to be 150 Myr, 150-300 Myr, and 300-600 Myr. We estimates the spin-down rate () through the gap between the sequences to 0.06 days/Myr and 0.08 days/Myr for early and late K dwarfs, respectively. These timescales and rates offer constraints on the rates of internal and external angular momentum transport and on the evolution rates of stellar dynamos in late-type stars of different masses.
A comparison of the M34 color-period diagram with that of the older Hyades clusters, confirms our finding in Paper I of mass-dependent deviations from the Skumanich spin-down rate on the main sequence. The K dwarfs spin down slower than the rate from M34 (220 Myr) to the Hyades (625 Myr).
We use rotational isochrones constrained by the sequence in M35 (Paper I) to determine a new gyrochronology age for M34 of 240 Myr from a fit to the M34 sequence. We find that an assumed 10% age-uncertainty for M35 propagates into a 10% uncertainty on the gyro-age for M34 and conclude that the this effect is consistent with the systematic errors on gyrochronology ages estimated by Barnes (2007). The range of gyro-ages found for M34 includes the mean stellar evolution age for the cluster of 220 Myr. We emphasize the small formal uncertainty of 2% on the gyro-age of M34. The small formal error reflects the well-defined sequence in M34. We use the narrow sequence in the M34 color-period diagram to further adjust the coefficients in the color-period relation for late-type stars.
Finally, we comment on a high level of stability in the phase, shape, and amplitude of the photometric variability of the 120 rotators over the 5 month duration of our survey. We propose that the observed stability is due to enhanced spot generation at active stellar longitudes.
We conclude by emphasizing that the color-period diagram for open star clusters can reveal sequences whose mass- and time-dependent changes constitute a crucial testing ground for future models of stellar angular momentum evolution - much like the color-magnitude diagram for models of stellar evolution.
Appendix A PHASED LIGHT CURVES
This appendix presents the light curves for the stars in the field of M34 for which we measured rotation periods. In the printed journal, Figure 14 shows an example of the phased light curve plots. Phased light curves for all 120 stars can be found in the electronic edition of the Journal. The light curves have been divided into 3 groups according to the amplitude of the photometric variation. For each group the light curves are sorted by the rotation period and are presented with the same range on the ordinate. The group of stars with the largest photometric variability are shown first (in the electronic edition of the Journal).
For each star we plot the data from the high-frequency survey (December 2002) as black symbols and data from the low-frequency survey (October 2002 through March 2003) as grey symbols. A running ID number corresponding to the ID number in Table 2 in Appendix B is given in the upper left hand corner in each plot. The period to which the data are phased (the rotation period listed in Table 2 as ) is given in the upper right corner. The letter code in the lower right corner informs about the stars membership status. The codes have the following meaning: Photometric Member (PM; described in Section 2.3), Kinematic (and Photometric) Member (KM), Non-Member (NM). In each plot a horizontal grey line mark and a vertical grey line marks a phase of 1.0.
![[Uncaptioned image]](/html/1103.5171/assets/x18.png)
Fig. 14. — Continued.
![[Uncaptioned image]](/html/1103.5171/assets/x19.png)
Fig. 14. — Continued.
![[Uncaptioned image]](/html/1103.5171/assets/x20.png)
Fig. 14. — Continued.
![[Uncaptioned image]](/html/1103.5171/assets/x21.png)
Fig. 14. — Continued.
![[Uncaptioned image]](/html/1103.5171/assets/x22.png)
Fig. 14. — Continued.
Appendix B DATA FOR THE 120 STARS WITH MEASURED ROTATION PERIODS IN THE FIELD OF M34
Table 2 presents the results from this study together with information relevant to this paper for 120 stars in the field of M34. In the printed journal a stub version of Table 2 show the form of the full table and a sample the first 5 lines of its contents. The full version of the table can be found in the electronic edition of the Journal. The stars appear in order of increasing rotation period and the running number in the first column corresponds to the number in the upper left hand corner of each light curve in Appendix A. Columns 2 and 3 give the stellar equatorial coordinates (equinox 2000). Column 4 lists the measured stellar rotation period in decimal days. Columns 5 and 6 gives the stellar V magnitude and B-V color index, respectively, corrected for extinction and reddening. Column 7 presents the number of radial-velocity measurements for the star and columns 8 and 9 give the mean radial-velocity and the velocity standard deviation, respectively. Column 10 list the radial-velocity cluster membership probability calculated using the formalism by Vasilevskis et al. (1958). Column 11 contains a proper-motion cluster membership probability from Jones & Prosser (1996). In column 12 we give the membership codes (mcode) also found in the light curve plots as explained in Appendix A. Finally, in column 13 the rotational state of the star is indicated by a 1-letter code representing, respectively, the sequence (“i”), the sequence (“c”), and the gap (“g”). Stars with a “-” in column 13 have locations in the color-period diagram that do not correspond to either of the sequences or the gap.
| No. aaRunning number assigned to 120 rotators after sorting by rotation period. | RA | DEC | bbProper-motion membership probabilities are from (Jones & Prosser, 1996) | mcode ccLetter code denoting a star’s cluster membership status (see introductory text of Appendix for code meaning). | Sequence ddLetters “i”, “c”, and “g” mark stars on the I and C sequances or in the gap, respectively. | |||||||
|---|---|---|---|---|---|---|---|---|---|---|---|---|
| Days | % | % | ||||||||||
| 1 | 2 40 54.560 | 42 57 56.857 | 0.11 | 12.45 | 0.24 | 1 | 5.6 | 0.0 | 8 | … | NM | i |
| 2 | 2 41 50.600 | 43 01 26.819 | 0.13 | 19.43 | … | … | … | … | … | … | NM | c |
| 3 | 2 42 10.510 | 42 46 33.219 | 0.16 | 18.42 | 0.48 | … | … | … | … | … | NM | – |
| 4 | 2 40 40.141 | 42 46 32.244 | 0.19 | 18.94 | 0.30 | … | … | … | … | … | NM | i |
| 5 | 2 41 31.450 | 42 59 05.837 | 0.21 | 16.08 | 0.53 | … | … | … | … | … | NM | – |
| 6 | 2 43 13.200 | 42 50 25.223 | 0.36 | 15.83 | 0.12 | … | … | … | … | … | NM | i |
| 7 | 2 43 02.100 | 42 46 53.969 | 0.49 | 17.67 | 1.44 | … | … | … | … | … | PM | c |
| 8 | 2 40 58.099 | 42 49 44.409 | 0.51 | 16.92 | 0.79 | … | … | … | … | … | NM | c |
| 9 | 2 41 04.319 | 42 35 11.462 | 0.51 | 17.42 | 1.42 | … | … | … | … | … | PM | c |
| 10 | 2 41 43.970 | 42 45 07.965 | 0.59 | 16.79 | 1.34 | … | … | … | … | … | PM | c |
| 11 | 2 43 30.380 | 42 53 02.286 | 0.72 | 14.74 | 0.84 | 13 | -7.5 | 1.3 | 95 | 2 | KM | c |
| 12 | 2 43 00.049 | 42 58 01.224 | 0.79 | 15.60 | 1.04 | 12 | -13.4 | 3.0 | 6 | 47 | NM | c |
| 13 | 2 41 30.240 | 42 27 54.934 | 0.79 | 17.93 | 1.40 | … | … | … | … | … | NM | c |
| 14 | 2 43 32.040 | 42 38 31.084 | 0.81 | 13.38 | 0.68 | 8 | -7.8 | 0.1 | 96 | 8 | KM | c |
| 15 | 2 41 53.320 | 42 35 25.800 | 0.88 | 16.08 | 1.16 | 6 | -6.9 | 1.7 | 91 | … | KM | c |
| 16 | 2 42 17.510 | 42 35 03.566 | 0.88 | 15.53 | 0.29 | … | … | … | … | … | NM | i |
| 17 | 2 41 35.330 | 42 41 01.995 | 0.90 | 14.33 | 0.79 | 15 | -7.7 | 1.8 | 95 | 86 | KM | c |
| 18 | 2 42 50.869 | 42 58 07.555 | 0.94 | 14.51 | 0.84 | 15 | -10.0 | 1.6 | 72 | 0 | KM | c |
| 19 | 2 42 06.570 | 42 39 36.755 | 0.96 | 17.66 | 1.41 | … | … | … | … | … | NM | c |
| 20 | 2 42 31.619 | 42 37 09.950 | 1.07 | 15.97 | 1.13 | 9 | -9.9 | 1.8 | 74 | 46 | KM | c |
| 21 | 2 42 05.120 | 42 25 26.509 | 1.09 | 15.01 | 0.85 | 12 | -14.1 | 2.5 | 6 | … | NM | c |
| 22 | 2 43 23.870 | 42 30 58.475 | 1.12 | 15.63 | 1.04 | 12 | -6.9 | 1.6 | 91 | … | KM | c |
| 23 | 2 41 57.581 | 43 00 26.353 | 1.13 | 15.29 | 0.99 | 11 | -9.9 | 2.5 | 76 | 53 | KM | c |
| 24 | 2 42 26.029 | 42 48 53.871 | 1.19 | 17.32 | 0.93 | … | … | … | … | … | NM | c |
| 25 | 2 42 47.650 | 42 45 46.596 | 1.19 | 16.45 | 1.20 | 11 | -7.2 | 1.3 | 94 | … | KM | c |
| 26 | 2 42 49.180 | 42 40 13.875 | 1.50 | 15.73 | 1.03 | 5 | -7.7 | 0.3 | 95 | … | KM | c |
| 27 | 2 42 57.940 | 42 58 03.559 | 1.55 | 14.78 | 0.86 | 13 | -6.3 | 1.7 | 81 | 0 | KM | c |
| 28 | 2 42 47.890 | 43 00 47.186 | 1.63 | 17.52 | 1.12 | … | … | … | … | … | NM | c |
| 29 | 2 42 42.530 | 42 40 30.835 | 1.97 | 12.62 | 0.52 | 10 | -9.8 | 0.8 | 77 | 99 | KM | i |
| 30 | 2 41 33.661 | 42 32 21.985 | 2.29 | 11.99 | 0.51 | 11 | -8.4 | 0.9 | 95 | 99 | KM | i |
| 31 | 2 42 34.410 | 42 36 21.679 | 2.36 | 12.15 | 0.55 | 10 | -7.0 | 0.6 | 93 | 98 | KM | i |
| 32 | 2 41 58.850 | 42 57 30.105 | 2.39 | 15.60 | 0.83 | … | … | … | … | … | NM | g |
| 33 | 2 42 08.270 | 42 38 41.535 | 2.71 | 12.90 | 0.54 | 3 | -7.1 | 0.2 | 93 | 97 | KM | i |
| 34 | 2 41 48.100 | 42 39 03.343 | 2.73 | 12.68 | 0.53 | 11 | -7.5 | 0.8 | 95 | 99 | KM | i |
| 35 | 2 41 36.720 | 42 50 20.018 | 2.80 | 14.44 | 0.82 | 11 | -7.6 | 0.8 | 95 | 44 | KM | g |
| 36 | 2 41 40.911 | 42 54 46.917 | 2.80 | 12.96 | 0.58 | 9 | -8.6 | 0.5 | 95 | 99 | KM | i |
| 37 | 2 42 15.010 | 42 54 33.376 | 3.10 | 13.04 | 0.62 | 8 | -2.4 | 0.2 | 7 | 0 | NM | i |
| 38 | 2 42 36.410 | 42 54 31.317 | 3.18 | 14.73 | 0.86 | 11 | -7.3 | 0.5 | 94 | 0 | KM | g |
| 39 | 2 41 48.760 | 42 27 58.477 | 3.39 | 14.70 | 0.96 | 15 | -8.3 | 5.5 | 95 | … | KM | g |
| 40 | 2 43 15.420 | 42 30 36.186 | 3.54 | 12.90 | 0.54 | 15 | -8.5 | 1.7 | 95 | … | KM | i |
| 41 | 2 42 44.011 | 42 26 39.733 | 3.67 | 17.59 | 0.89 | … | … | … | … | … | NM | g |
| 42 | 2 42 51.481 | 42 47 52.375 | 3.67 | 12.78 | 0.64 | 15 | -8.2 | 1.1 | 95 | 99 | KM | i |
| 43 | 2 41 05.060 | 42 46 51.566 | 3.78 | 13.29 | 0.60 | 8 | -7.4 | 0.2 | 95 | 4 | KM | i |
| 44 | 2 42 57.960 | 42 41 46.119 | 3.86 | 16.13 | 1.36 | … | … | … | … | … | NM | g |
| 45 | 2 41 26.390 | 42 48 12.934 | 3.99 | 13.21 | 0.59 | 10 | -8.2 | 0.3 | 96 | 98 | KM | i |
| 46 | 2 41 59.641 | 42 41 01.555 | 4.19 | 12.98 | 0.67 | 18 | -6.5 | 12.2 | 87 | 87 | KM | i |
| 47 | 2 43 18.140 | 42 46 36.968 | 4.29 | 13.76 | 0.69 | 16 | -8.1 | 28.3 | 96 | 94 | KM | i |
| 48 | 2 41 38.540 | 42 39 03.906 | 4.37 | 13.36 | 0.63 | 6 | -7.9 | 0.2 | 96 | 95 | KM | i |
| 49 | 2 42 14.080 | 42 55 47.974 | 4.65 | 13.89 | 0.77 | 10 | -7.8 | 0.4 | 96 | 17 | KM | i |
| 50 | 2 41 49.060 | 42 39 59.290 | 4.83 | 15.82 | 1.11 | … | … | … | … | … | PM | g |
| 51 | 2 42 23.200 | 42 27 28.444 | 4.88 | 14.65 | 0.68 | … | … | … | … | … | NM | i |
| 52 | 2 42 00.530 | 42 48 53.350 | 4.93 | 12.65 | 0.73 | 18 | -17.2 | 8.3 | 6 | 99 | NM | i |
| 53 | 2 41 51.771 | 42 38 22.913 | 5.35 | 16.57 | 1.28 | … | … | … | … | … | PM | g |
| 54 | 2 41 37.561 | 42 59 39.414 | 5.41 | 13.86 | 0.72 | 12 | -9.4 | 0.6 | 88 | 3 | KM | i |
| 55 | 2 42 18.811 | 42 28 58.422 | 5.41 | 16.72 | 1.07 | … | … | … | … | … | NM | g |
| 56 | 2 42 41.849 | 43 00 49.287 | 5.41 | 12.89 | 0.61 | 13 | -0.5 | 0.4 | 7 | 0 | NM | i |
| 57 | 2 41 33.510 | 42 42 11.360 | 5.47 | 13.74 | 0.70 | 7 | -8.9 | 0.7 | 93 | 5 | KM | i |
| 58 | 2 41 48.579 | 42 49 33.532 | 5.47 | 16.02 | 1.07 | 10 | -0.6 | 1.3 | 7 | 17 | NM | g |
| 59 | 2 41 36.680 | 42 40 03.438 | 5.59 | 17.91 | 1.49 | … | … | … | … | … | PM | g |
| 60 | 2 41 32.840 | 43 02 16.148 | 5.99 | 17.74 | 1.52 | … | … | … | … | … | PM | g |
| 61 | 2 41 38.240 | 42 44 04.231 | 5.99 | 13.87 | 0.73 | 10 | -7.9 | 0.3 | 96 | 93 | KM | i |
| 62 | 2 40 44.530 | 42 54 04.373 | 6.06 | 12.64 | 0.98 | 1 | -55.8 | 0.0 | 15 | … | NM | g |
| 63 | 2 41 47.970 | 42 41 18.076 | 6.06 | 11.97 | 0.55 | 10 | -8.4 | 0.4 | 95 | 0 | KM | – |
| 64 | 2 42 06.660 | 42 36 20.484 | 6.14 | 13.49 | 0.80 | 4 | -6.8 | 0.1 | 90 | 95 | KM | i |
| 65 | 2 42 10.400 | 42 59 35.885 | 6.37 | 17.77 | 1.50 | … | … | … | … | … | PM | g |
| 66 | 2 42 56.980 | 42 35 21.281 | 6.54 | 14.19 | 0.80 | 7 | -8.2 | 0.2 | 96 | 0 | KM | i |
| 67 | 2 41 49.430 | 42 36 37.046 | 6.71 | 14.19 | 0.81 | 9 | -7.3 | 0.4 | 94 | 91 | KM | i |
| 68 | 2 42 11.430 | 42 50 36.346 | 6.90 | 14.27 | 0.85 | 8 | -8.1 | 0.3 | 96 | 0 | KM | i |
| 69 | 2 41 05.251 | 42 56 43.029 | 7.00 | 14.37 | 0.81 | 8 | -8.1 | 0.3 | 96 | … | KM | i |
| 70 | 2 40 42.850 | 42 38 58.660 | 7.20 | 16.42 | 1.27 | … | … | … | … | … | PM | g |
| 71 | 2 42 50.400 | 42 34 19.882 | 7.30 | 17.76 | 1.41 | … | … | … | … | … | NM | g |
| 72 | 2 41 01.090 | 42 52 46.521 | 7.41 | 14.70 | 0.87 | 13 | -7.5 | 0.9 | 95 | 0 | KM | i |
| 73 | 2 43 10.360 | 42 54 32.621 | 7.41 | 14.57 | 0.90 | 5 | -6.7 | 0.4 | 89 | 72 | KM | i |
| 74 | 2 40 45.000 | 42 53 47.014 | 7.52 | 16.60 | 1.28 | … | … | … | … | … | PM | g |
| 75 | 2 41 35.160 | 42 33 30.539 | 7.52 | 13.92 | 0.86 | 10 | -7.9 | 0.5 | 96 | 0 | KM | i |
| 76 | 2 42 11.080 | 42 43 16.083 | 7.52 | 16.49 | 1.29 | … | … | … | … | … | PM | g |
| 77 | 2 41 23.170 | 42 40 15.523 | 7.75 | 14.74 | 0.90 | 12 | -7.1 | 0.5 | 93 | 84 | KM | i |
| 78 | 2 42 47.840 | 42 47 42.790 | 7.75 | 14.73 | 0.90 | 11 | -8.8 | 0.6 | 94 | 67 | KM | i |
| 79 | 2 41 01.950 | 42 42 31.163 | 8.00 | 14.85 | 0.91 | 9 | -7.5 | 0.4 | 95 | 76 | KM | i |
| 80 | 2 41 06.299 | 42 46 21.010 | 8.00 | 15.41 | 1.03 | 15 | -7.3 | 5.9 | 94 | 26 | KM | i |
| 81 | 2 41 51.379 | 42 34 24.372 | 8.00 | 14.72 | 0.89 | 8 | -8.9 | 0.4 | 93 | 0 | KM | i |
| 82 | 2 42 26.400 | 42 30 13.074 | 8.00 | 14.48 | 0.84 | 12 | -7.1 | 0.7 | 94 | 85 | KM | i |
| 83 | 2 42 04.990 | 42 37 46.905 | 8.13 | 17.58 | 1.52 | … | … | … | … | … | PM | g |
| 84 | 2 40 49.760 | 42 46 54.999 | 8.27 | 15.52 | 1.05 | 11 | -8.7 | 0.8 | 94 | … | KM | i |
| 85 | 2 41 21.480 | 42 35 43.996 | 8.27 | 14.98 | 0.94 | 11 | -9.0 | 0.4 | 92 | 10 | KM | i |
| 86 | 2 42 05.880 | 42 46 53.475 | 8.27 | 14.34 | 0.99 | 9 | -8.5 | 0.5 | 95 | 71 | KM | i |
| 87 | 2 42 02.370 | 43 01 13.320 | 8.40 | 14.73 | 0.98 | 15 | -2.8 | 0.6 | 7 | … | NM | i |
| 88 | 2 41 44.269 | 42 35 35.454 | 8.55 | 17.26 | 1.38 | … | … | … | … | … | PM | g |
| 89 | 2 43 03.560 | 43 03 01.563 | 8.55 | 15.61 | … | … | … | … | … | … | NM | g |
| 90 | 2 41 30.691 | 42 28 53.423 | 8.70 | 14.80 | 0.89 | 11 | -7.7 | 0.6 | 95 | … | KM | i |
| 91 | 2 42 02.650 | 42 51 51.411 | 8.70 | 15.02 | 0.95 | 12 | -7.4 | 0.6 | 95 | 76 | KM | i |
| 92 | 2 41 24.320 | 42 48 18.550 | 8.85 | 14.71 | 1.01 | 10 | -6.9 | 0.6 | 92 | 0 | KM | i |
| 93 | 2 41 27.290 | 42 43 41.970 | 8.85 | 14.89 | 0.83 | 9 | -24.4 | 0.4 | 6 | 0 | NM | i |
| 94 | 2 43 21.230 | 42 48 56.069 | 8.85 | 15.74 | 1.18 | 13 | -10.5 | 0.8 | 44 | 24 | KM | i |
| 95 | 2 41 42.990 | 42 33 13.277 | 9.01 | 15.43 | 1.09 | 13 | -9.3 | 0.5 | 89 | 5 | KM | i |
| 96 | 2 42 25.920 | 42 28 44.057 | 9.01 | 13.80 | 1.21 | … | … | … | … | … | NM | i |
| 97 | 2 41 13.010 | 42 50 19.112 | 9.35 | 15.71 | 0.89 | … | … | … | … | … | NM | i |
| 98 | 2 41 56.050 | 42 58 30.558 | 9.35 | 15.90 | 1.18 | 9 | -8.3 | 0.7 | 95 | … | KM | i |
| 99 | 2 42 24.871 | 42 27 39.595 | 9.52 | 15.84 | 1.14 | 12 | -8.1 | 0.7 | 96 | … | KM | i |
| 100 | 2 41 37.671 | 42 57 21.426 | 9.71 | 15.45 | 1.05 | … | … | … | … | … | PM | i |
| 101 | 2 42 25.010 | 42 53 25.824 | 9.71 | 17.18 | 1.42 | … | … | … | … | … | PM | g |
| 102 | 2 41 19.321 | 42 35 28.148 | 9.90 | 16.32 | 1.28 | 8 | -8.0 | 1.1 | 96 | … | KM | i |
| 103 | 2 42 59.660 | 42 33 13.991 | 9.90 | 15.45 | 1.06 | 14 | -7.6 | 44.8 | 95 | 6 | KM | i |
| 104 | 2 41 46.440 | 42 32 31.501 | 10.31 | 16.12 | 1.20 | … | … | … | … | … | PM | i |
| 105 | 2 42 55.190 | 42 45 50.249 | 10.31 | 15.69 | 1.13 | 9 | -7.2 | 0.8 | 94 | 27 | KM | i |
| 106 | 2 41 38.340 | 42 55 42.865 | 10.52 | 15.73 | 0.91 | … | … | … | … | … | NM | i |
| 107 | 2 42 11.749 | 42 31 17.440 | 10.52 | 16.70 | 1.31 | … | … | … | … | … | PM | i |
| 108 | 2 42 59.650 | 42 48 23.426 | 10.52 | 15.49 | 1.25 | 10 | -6.7 | 0.9 | 90 | 43 | KM | i |
| 109 | 2 41 38.931 | 42 43 00.963 | 10.75 | 17.44 | 1.43 | … | … | … | … | … | PM | i |
| 110 | 2 41 45.020 | 42 53 56.215 | 10.75 | 16.12 | 1.37 | … | … | … | … | … | PM | i |
| 111 | 2 42 43.550 | 42 52 30.027 | 10.75 | 15.59 | 1.18 | 12 | -10.4 | 0.8 | 49 | 19 | KM | i |
| 112 | 2 42 20.410 | 42 49 05.517 | 10.99 | 16.31 | 1.26 | … | … | … | … | … | PM | i |
| 113 | 2 41 01.740 | 42 37 34.573 | 11.23 | 16.23 | 1.22 | … | … | … | … | … | PM | i |
| 114 | 2 41 31.200 | 42 41 13.943 | 11.23 | 17.91 | 1.48 | … | … | … | … | … | NM | i |
| 115 | 2 40 49.190 | 42 48 20.432 | 11.49 | 16.39 | 1.28 | … | … | … | … | … | PM | i |
| 116 | 2 40 38.520 | 42 43 33.826 | 12.98 | 18.50 | 0.50 | … | … | … | … | … | NM | i |
| 117 | 2 42 23.059 | 42 57 28.814 | 14.08 | 14.37 | 0.79 | 8 | -28.0 | 1.4 | 6 | 0 | NM | i |
| 118 | 2 43 13.039 | 42 32 29.496 | 15.37 | 16.79 | 0.93 | … | … | … | … | … | NM | i |
| 119 | 2 41 23.820 | 42 30 55.811 | 18.85 | 14.62 | 0.94 | 5 | 6.0 | 0.2 | 8 | 0 | NM | i |
| 120 | 2 43 07.390 | 42 47 46.772 | 23.22 | 12.36 | 1.25 | 1 | -6.8 | 0.0 | 90 | 0 | NM | i |
Note. — This stub version of Table 2 is intended to show the form of the full table and a sample of its contents. The full version of the table can be found online.
References
- Barnes & Sofia (1996) Barnes, S., & Sofia, S. 1996, ApJ, 462, 746
- Barnes et al. (2001) Barnes, S., Sofia, S., & Pinsonneault, M. 2001, ApJ, 548, 1071
- Barnes (2003) Barnes, S. A. 2003, ApJ, 586, 464
- Barnes (2007) —. 2007, ApJ, 669, 1167
- Barnes et al. (1999) Barnes, S. A., Sofia, S., Prosser, C. F., & Stauffer, J. R. 1999, ApJ, 516, 263
- Berdyugina & Järvinen (2005) Berdyugina, S. V., & Järvinen, S. P. 2005, Astronomische Nachrichten, 326, 283
- Berdyugina & Usoskin (2003) Berdyugina, S. V., & Usoskin, I. G. 2003, A&A, 405, 1121
- Bogdan et al. (1988) Bogdan, T. J., Gilman, P. A., Lerche, I., & Howard, R. 1988, ApJ, 327, 451
- Bouvier et al. (1997) Bouvier, J., Forestini, M., & Allain, S. 1997, A&A, 326, 1023
- Caldwell et al. (1993) Caldwell, J. A. R., Cousins, A. W. J., Ahlers, C. C., van Wamelen, P., & Maritz, E. J. 1993, South African Astronomical Observatory Circular, 15, 1
- Canterna et al. (1979) Canterna, R., Crawford, D. L., & Perry, C. L. 1979, PASP, 91, 263
- Chaboyer et al. (1995) Chaboyer, B., Demarque, P., & Pinsonneault, M. H. 1995, ApJ, 441, 865
- Collier Cameron et al. (2009) Collier Cameron, A., Davidson, V. A., Hebb, L., Skinner, G., Anderson, D. R., Christian, D. J., Clarkson, W. I., Enoch, B., Irwin, J., Joshi, Y., Haswell, C. A., Hellier, C., Horne, K. D., Kane, S. R., Lister, T. A., Maxted, P. F. L., Norton, A. J., Parley, N., Pollacco, D., Ryans, R., Scholz, A., Skillen, I., Smalley, B., Street, R. A., West, R. G., Wilson, D. M., & Wheatley, P. J. 2009, MNRAS, 1358
- Deliyannis (2010) Deliyannis, C. P. 2010, private comm.
- Denissenkov et al. (2010) Denissenkov, P. A., Pinsonneault, M., Terndrup, D. M., & Newsham, G. 2010, ApJ, 716, 1269
- Donahue et al. (1996) Donahue, R. A., Saar, S. H., & Baliunas, S. L. 1996, ApJ, 466, 384
- Endal & Sofia (1981) Endal, A. S., & Sofia, S. 1981, ApJ, 243, 625
- Geller et al. (2008) Geller, A. M., Mathieu, R. D., Harris, H. C., & McClure, R. D. 2008, AJ, 135, 2264
- Hartman et al. (2010a) Hartman, J. D., Bakos, G. Á., Kovács, G., & Noyes, R. W. 2010a, ArXiv e-prints
- Hartman et al. (2010b) Hartman, J. D., Bakos, G. Á., N. R. W. S. B. M. T. S. A., & Pal, A. 2010b, ArXiv e-prints
- Hartman et al. (2009) Hartman, J. D., Gaudi, B. S., Pinsonneault, M. H., Stanek, K. Z., Holman, M. J., McLeod, B. A., Meibom, S., Barranco, J. A., & Kalirai, J. S. 2009, ApJ, 691, 342
- Herbst et al. (2007) Herbst, W., Eislöffel, J., Mundt, R., & Scholz, A. 2007, in Protostars and Planets V, ed. B. Reipurth, D. Jewitt, & K. Keil, 297–311
- Honeycutt (1992) Honeycutt, R. K. 1992, PASP, 104, 435
- Hussain (2002) Hussain, G. A. J. 2002, Astronomische Nachrichten, 323, 349
- Ianna & Schlemmer (1993) Ianna, P. A., & Schlemmer, D. M. 1993, AJ, 105, 209
- Irwin et al. (2009) Irwin, J., Aigrain, S., Bouvier, J., Hebb, L., Hodgkin, S., Irwin, M., & Moraux, E. 2009, MNRAS, 392, 1456
- Irwin et al. (2006) Irwin, J., Aigrain, S., Hodgkin, S., Irwin, M., Bouvier, J., Clarke, C., Hebb, L., & Moraux, E. 2006, MNRAS, 370, 954
- Irwin et al. (2010) Irwin, J., Berta, Z. K., Burke, C. J., Charbonneau, D., Nutzman, P., West, A. A., & Falco, E. E. 2010, ArXiv e-prints
- Irwin et al. (2007) Irwin, J., Hodgkin, S., Aigrain, S., Hebb, L., Bouvier, J., Clarke, C., Moraux, E., & Bramich, D. M. 2007, MNRAS, 377, 741
- James et al. (2010) James, D. J., Barnes, S. A., Meibom, S., Lockwood, G. W., Levine, S. E., Deliyannis, C., Platais, I., Steinhauer, A., & Hurley, B. K. 2010, A&A, 515, A100+
- Jeffers et al. (2006) Jeffers, S. V., Barnes, J. R., Cameron, A. C., & Donati, J. 2006, MNRAS, 366, 667
- Jianke & Collier Cameron (1993) Jianke, L., & Collier Cameron, A. 1993, MNRAS, 261, 766
- Jones & Prosser (1996) Jones, B. F., & Prosser, C. F. 1996, AJ, 111, 1193
- Kalirai et al. (2003) Kalirai, J. S., Fahlman, G. G., Richer, H. B., & Ventura, P. 2003, AJ, 126, 1402
- Kawaler (1988) Kawaler, S. D. 1988, ApJ, 333, 236
- Koenigl (1991) Koenigl, A. 1991, ApJ, 370, L39
- Korhonen & Järvinen (2007) Korhonen, H., & Järvinen, S. P. 2007, in IAU Symposium, Vol. 240, IAU Symposium, ed. W. I. Hartkopf, E. F. Guinan, & P. Harmanec, 453–455
- Kraft (1967) Kraft, R. P. 1967, ApJ, 150, 551
- Krishnamurthi et al. (1997) Krishnamurthi, A., Pinsonneault, M. H., Barnes, S., & Sofia, S. 1997, ApJ, 480, 303
- Krishnamurthi et al. (1998) Krishnamurthi, A., Terndrup, D. M., Pinsonneault, M. H., Sellgren, K., Stauffer, J. R., Schild, R., Backman, D. E., Beisser, K. B., Dahari, D. B., Dasgupta, A., Hagelgans, J. T., Seeds, M. A., Anand, R., Laaksonen, B. D., Marschall, L. A., & Ramseyer, T. 1998, ApJ, 493, 914
- Lanza et al. (2009) Lanza, A. F., Pagano, I., Leto, G., Messina, S., Aigrain, S., Alonso, R., Auvergne, M., Baglin, A., Barge, P., Bonomo, A. S., Boumier, P., Collier Cameron, A., Comparato, M., Cutispoto, G., de Medeiros, J. R., Foing, B., Kaiser, A., Moutou, C., Parihar, P. S., Silva-Valio, A., & Weiss, W. W. 2009, A&A, 493, 193
- MacGregor & Brenner (1991) MacGregor, K. B., & Brenner, M. 1991, ApJ, 376, 204
- Mamajek & Hillenbrand (2008) Mamajek, E. E., & Hillenbrand, L. A. 2008, ApJ, 687, 1264
- Mathieu (2000) Mathieu, R. D. 2000, in ASP Conf. Ser. 198: Stellar Clusters and Associations: Convection, Rotation, and Dynamos, 517
- Meibom et al. (2006) Meibom, S., Mathieu, R. D., & Stassun, K. G. 2006, ApJ, 653, 621
- Meibom et al. (2009) —. 2009, ApJ, 695, 679
- Meynet et al. (1993) Meynet, G., Mermilliod, J., & Maeder, A. 1993, A&AS, 98, 477
- Mosser et al. (2009) Mosser, B., Baudin, F., Lanza, A. F., Hulot, J. C., Catala, C., Baglin, A., & Auvergne, M. 2009, A&A, 506, 245
- O’Neal et al. (1996) O’Neal, D., Saar, S. H., & Neff, J. E. 1996, ApJ, 463, 766
- Patten & Simon (1996) Patten, B. M., & Simon, T. 1996, ApJS, 106, 489
- Perryman et al. (1998) Perryman, M. A. C., Brown, A. G. A., Lebreton, Y., Gomez, A., Turon, C., de Strobel, G. C., Mermilliod, J. C., Robichon, N., Kovalevsky, J., & Crifo, F. 1998, A&A, 331, 81
- Pinsonneault et al. (1989) Pinsonneault, M. H., Kawaler, S. D., Sofia, S., & Demarque, P. 1989, ApJ, 338, 424
- Pont et al. (2007) Pont, F., Gilliland, R. L., Moutou, C., Charbonneau, D., Bouchy, F., Brown, T. M., Mayor, M., Queloz, D., Santos, N., & Udry, S. 2007, A&A, 476, 1347
- Prosser et al. (1995) Prosser, C. F., Shetrone, M. D., Dasgupta, A., Backman, D. E., Laaksonen, B. D., Baker, S. W., Marschall, L. A., Whitney, B. A., Kuijken, K., & Stauffer, J. R. 1995, PASP, 107, 211
- Prosser et al. (1993) Prosser, C. F., Shetrone, M. D., Marilli, E., Catalano, S., Williams, S. D., Backman, D. E., Laaksonen, B. D., Adige, V., Marschall, L. A., & Stauffer, J. R. 1993, PASP, 105, 1407
- Radick et al. (1987) Radick, R. R., Thompson, D. T., Lockwood, G. W., Duncan, D. K., & Baggett, W. E. 1987, ApJ, 321, 459
- Sarrazine et al. (2000) Sarrazine, A. R., Steinhauer, A. J. B., Deliyannis, C. P., Sarajedini, A., Hainline, L. J., Bailyn, C., Platais, I., Kozhurina-Platais, V., & von Hippel, T. 2000, in Bulletin of the American Astronomical Society, Vol. 32, Bulletin of the American Astronomical Society, 1461–+
- Scargle (1982) Scargle, J. D. 1982, ApJ, 263, 835
- Schatzman (1962) Schatzman, E. 1962, Annales d’Astrophysique, 25, 18
- Schuler et al. (2003) Schuler, S. C., King, J. R., Fischer, D. A., Soderblom, D. R., & Jones, B. F. 2003, AJ, 125, 2085
- Shu et al. (1994) Shu, F., Najita, J., Ostriker, E., Wilkin, F., Ruden, S., & Lizano, S. 1994, ApJ, 429, 781
- Sills et al. (2000) Sills, A., Pinsonneault, M. H., & Terndrup, D. M. 2000, ApJ, 534, 335
- Silva-Valio et al. (2010) Silva-Valio, A., Lanza, A. F., Alonso, R., & Barge, P. 2010, A&A, 510, A25+
- Skumanich (1972) Skumanich, A. 1972, ApJ, 171, 565
- Soderblom (2010) Soderblom, D. R. 2010, ARA&A, 48, 581
- Soderblom et al. (2001) Soderblom, D. R., Jones, B. F., & Fischer, D. 2001, ApJ, 563, 334
- Soderblom et al. (1983) Soderblom, D. R., Jones, B. F., & Walker, M. F. 1983, ApJ, 274, L37
- Soderblom et al. (1993) Soderblom, D. R., Stauffer, J. R., Hudon, J. D., & Jones, B. F. 1993, ApJS, 85, 315
- Solanki & Unruh (2004) Solanki, S. K., & Unruh, Y. C. 2004, MNRAS, 348, 307
- Stassun et al. (2004) Stassun, K. G., Ardila, D. R., Barsony, M., Basri, G., & Mathieu, R. D. 2004, AJ, 127, 3537
- Stassun et al. (1999) Stassun, K. G., Mathieu, R. D., Mazeh, T., & Vrba, F. J. 1999, AJ, 117, 2941
- Stassun et al. (2001) Stassun, K. G., Mathieu, R. D., Vrba, F. J., Mazeh, T., & Henden, A. 2001, AJ, 121, 1003
- Stassun et al. (2007) Stassun, K. G., van den Berg, M., & Feigelson, E. 2007, ApJ, 660, 704
- Stauffer et al. (1984) Stauffer, J. R., Hartmann, L., Soderblom, D. R., & Burnham, N. 1984, ApJ, 280, 202
- Stauffer & Hartmann (1987) Stauffer, J. R., & Hartmann, L. W. 1987, ApJ, 318, 337
- Stauffer et al. (1985) Stauffer, J. R., Hartmann, L. W., Burnham, J. N., & Jones, B. F. 1985, ApJ, 289, 247
- Stauffer et al. (1989) Stauffer, J. R., Hartmann, L. W., & Jones, B. F. 1989, ApJ, 346, 160
- Steinhauer (2010) Steinhauer, A. 2010, priv. comm.
- Sung & Bessell (1999) Sung, H., & Bessell, M. S. 1999, MNRAS, 306, 361
- Terndrup et al. (2002) Terndrup, D. M., Pinsonneault, M., Jeffries, R. D., Ford, A., Stauffer, J. R., & Sills, A. 2002, ApJ, 576, 950
- Terndrup et al. (2000) Terndrup, D. M., Stauffer, J. R., Pinsonneault, M. H., Sills, A., Yuan, Y., Jones, B. F., Fischer, D., & Krishnamurthi, A. 2000, AJ, 119, 1303
- Tinker et al. (2002) Tinker, J., Pinsonneault, M., & Terndrup, D. 2002, ApJ, 564, 877
- Vasilevskis et al. (1958) Vasilevskis, S., Klemola, A., & Preston, G. 1958, AJ, 63, 387
- Weber & Davis (1967) Weber, E. J., & Davis, Jr., L. 1967, ApJ, 148, 217
- Yi et al. (2003) Yi, S. K., Kim, Y., & Demarque, P. 2003, ApJS, 144, 259