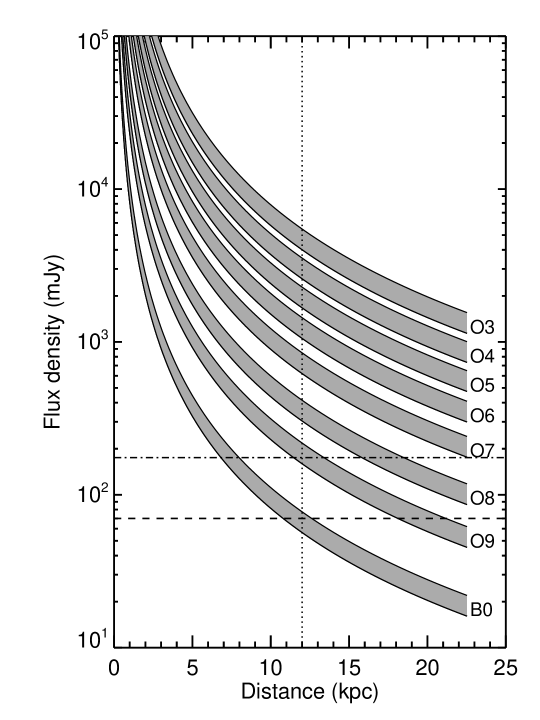
The Green Bank Telescope H II Region Discovery Survey
II. The Source Catalog
Abstract
The Green Bank Telescope H II Region Discovery Survey has doubled the number of known H II regions in the Galactic zone with . We detected 603 discrete hydrogen radio recombination line (RRL) components at 9 (3) from 448 targets. Our targets were selected based on spatially coincident mid-infrared and 20 cm radio continuum emission. Such sources are almost invariably H II regions; we detected hydrogen RRL emission from 95% of our target sample. The sensitivity of the Green Bank Telescope and the power of its spectrometer together made this survey possible. Here we provide a catalog of the measured properties of the RRL and continuum emission from the survey nebulae. The derived survey completeness limit, 180 mJy at 9, is sufficient to detect all H II regions ionized by single O-stars to a distance of 12 kpc. These recently discovered nebulae share the same distribution on the sky as does the previously known census of Galactic H II regions. On average, however, the new nebulae have fainter continuum fluxes, smaller continuum angular sizes, fainter RRL intensities and smaller RRL line widths. Though small in angular size, many of our new nebulae show little spatial correlation with tracers associated with extremely young H II regions, implying that our sample spans a range of evolutionary states. We discovered 34 first quadrant negative-velocity H II regions, which lie at extreme distances from the Sun and appear to be part of the Outer Arm. We found RRL emission from 207 Spitzer GLIMPSE 8.0 µm “bubble” sources, 65 of which have been cataloged previously. It thus appears that nearly all GLIMPSE bubbles are H II regions and that of all Galactic H II regions have a bubble morphology at 8.0 µm.
1 Introduction
H II regions are zones of plasma surrounding massive O- and B-type stars that are kept ionized by the stellar far ultraviolet (FUV) radiation. Stars capable of creating H II regions have lifetimes of million years. These nebulae are zero age objects compared to the age of the Milky Way and are therefore located at sites of recent massive star formation. H II regions are the most luminous objects in the Milky Way at mid-infrared (MIR) to radio wavelengths and can be seen across the entire Galactic disk. Because of their luminosity, they are the clearest indicators of the active sites of massive star formation. They are the archetypical tracers of Galactic spiral structure. Their chemical abundances, moreover, indicate the present state of the interstellar medium (ISM) and reveal the elemental enrichment caused by the nuclear processing of many stellar generations. They provide unique and important probes of billions of years of Galactic chemical evolution (GCE).
Knowing the Galactic distribution, kinematics, and physical properties of star cluster/H II region/PDR/molecular cloud complexes informs a host of research areas, including the merger history of the Milky Way, the structure of the Galaxy, the physics of star formation, and the evolution of the ISM. At the most basic level, a census locates new sites of massive star formation and paves the way for future studies at different wavelengths. Individual Galactic H II regions are astrophysically important objects that reveal details of the impact of the star formation process on the ISM.
H II region RRL spectra yield the velocity of the nebulae, which can then be used to derive their kinematic distances. The distances place H II regions onto a Galactic map that traces Galactic structure (e.g. Downes et al., 1980; Anderson & Bania, 2009). The RRL line width measures a combination of the turbulent and thermal energies in the H II region plasma and is a parameter needed to derive the electron temperature of H II regions. The electron temperature is a proxy for nebular metallicity and hence is key to understanding the Milky Way metallicity gradient, which provides an important constraint on models for GCE (Wink et al., 1983; Shaver et al., 1983; Quireza et al., 2006b).
Radio continuum observations of H II regions measure the free-free thermal emission and give the radio flux and angular size. When combined with a distance estimate, these parameters give a luminosity and a physical size. The former constrains the spectral type of the ionizing star and the latter is related to the evolutionary stage of the H II region. Finally, with a large volume-limited sample, we may better estimate the number of H II regions in the Galaxy and derive their luminosity function. Studies of external galaxies have found that the shape of the H II region luminosity distribution is related to the morphology of the host Galaxy (see Oey & Clarke, 1998, and references therein). By deriving the slope of the luminosity distribution of Galactic H II regions, we may get a better understanding of the morphology of the Milky Way.
Modern Galactic H II region surveys began with studies of the Palomar Sky Survey optical plates (Sharpless, 1953, 1959). Gum (1955) found 85 nebulae visible from the Southern hemisphere. The Sharpless and Gum surveys were soon augmented by Rodgers et al. (1960), who cataloged 182 optical H II regions in the Southern sky. (Some of these are also Sharpless nebulae.) Extinction within the Galactic plane, however, limits the detection of optical nebulae to within a few kpc of the Sun. At visible wavelengths the Galactic census of H II regions thus ends at the local Solar neighborhood. Only a census based on observations at longer wavelengths, where the ISM is optically thin, can locate H II regions on a Galactic scale.
H II regions emit at radio wavelengths because of their thermal free-free continuum (Bremsstrahlung) and radio recombination line emission. Radio continuum observations of the Milky Way began in the 1950s (see Westerhout, 1958a; Piddington, 1951; Hanbury Brown & Hazard, 1953; Scheuer & Ryle, 1953; Haddock et al., 1954). Optically visible H II regions were also bright at radio wavelengths. Moreover, most of the bright, discrete radio continuum sources in the Galactic plane turned out to be thermally emitting H II regions. For example, of the 74 continuum sources in the Westerhout (1958b) catalog (not counting W82, the Moon, and W24, the Galactic center), 55 (75%) are thermally emitting H II regions, 11 are non-thermally emitting supernova remnants (SNRs), and 7 are non-thermally emitting extra-galactic active galactic nuclei (AGN). Of the 55 Westerhout H II region sources, 30 are found in the catalogs of optical nebulae (Sharpless, 1953, 1959; Rodgers et al., 1960).
Radio recombination lines from Galactic H II regions were discovered by Hoglund & Mezger (1965) who detected emission from M 17 and Orion A. Because the Galactic ISM is optically thin at centimeter wavelengths, RRL surveys were able to discover large numbers of H II regions distributed throughout the entire Galactic disk. These pioneering surveys were done in the 1960s, 1970s, and 1980s by Mezger & Hoglund (1967, the latter hereafter referred to as L89); Wilson et al. (1970, the latter hereafter referred to as L89); Reifenstein et al. (1970, the latter hereafter referred to as L89); Downes et al. (1980, the latter hereafter referred to as L89); Caswell & Haynes (1987, the latter hereafter referred to as L89); Lockman (1989, the latter hereafter referred to as L89). These surveys gave important insights into Galactic structure and the spatial distribution of massive star formation. Particularly noteworthy was the discovery of a metallicity gradient across the Galactic disk, made apparent by RRL measurements of H II region electron temperatures (Wink et al., 1983; Shaver et al., 1983; Quireza et al., 2006b). By the time of the L89 survey, however, almost all of the reasonably strong radio continuum sources had been observed; the Lockman et al. (1996) study of “diffuse” H II regions was the last large angular scale survey for discrete H II regions made using -wavelength RRLs as tracers.
Most recent work on Galactic H II regions has focused on the ultra-compact (UC) class of nebulae, which nominally are in an early phase of H II region evolution. Wood & Churchwell (1989a) and Hughes & MacLeod (1989) used the colors (flux ratios) of sources from the Infrared Astronomical Satellite (IRAS) point source catalog (Beichman et al., 1988) to identify candidate UC H II regions. H II regions are bright at infrared (IR) wavelengths largely because radiation from the central star (or stars) is absorbed by local dust, which thermally re-emits at IR wavelengths. Later surveys of the radio continuum (Wood & Churchwell, 1989b; Kurtz et al., 1994) and RRL emission (Araya et al., 2002; Watson et al., 2003; Sewilo et al., 2004) of these targets showed that IRAS color criteria can be used to identify UC H II regions.
Despite these efforts, the census of Galactic H II regions was clearly incomplete. The advent of modern high-resolution, Galactic-scale infrared and radio surveys (see §2), coupled with the unprecedented spectral sensitivity of the NRAO Green Bank Telescope (GBT), has made the GBT H II Region Discovery Survey (HRDS) possible (Bania et al., 2010). The new radio and IR surveys have greatly increased our ability to identify Galactic H II region candidates (Giveon et al., 2005, 2008). The increases in sensitivity due to advances in instrumentation and telescope construction allow us to detect H II region candidates in radio continuum and RRL emission. In particular, the GBT’s unblocked aperture, active surface, and AutoCorrelation Spectrometer give it unprecedented spectral sensitivity at centimeter-wavelengths.
The GBT HRDS extends over 168 square degrees, covering the zone from with . It detected 603 discrete hydrogen RRL components at 9 (3; “X-band”) from 448 targets (Bania et al., 2010). Here we provide a catalog of the measured properties of the RRL and continuum emission from the GBT HRDS nebulae, compare these properties to the previously known census of Galactic H II regions, and identify astrophysically important classes of sources discovered by the HRDS. These include populations of H II regions that lie at extreme distances from the Sun in the Outer Arm and that are associated with Spitzer GLIMPSE 8.0 µm “bubble” sources.
2 The HRDS Target Sample
We assembled our target list from the following multi-frequency, large solid angle Galactic surveys: the NRAO VLA Galactic Plane Survey at 21 H I and continuum (VGPS: Stil et al., 2006), the NRAO VLA Sky Survey at 20 continuum (NVSS: Condon et al., 1998), the Southern Galactic Plane Survey at 21 H I and continuum (SGPS: Haverkorn et al., 2006), the VLA MAGPIS at 20 continuum (Helfand et al., 2006), and the Spitzer 24µm MIPSGAL survey (Carey et al., 2009).
The HRDS candidate H II regions are targets that: (1) have spatially coincident 24 µm MIR and 20 radio continuum emission of a similar morphology and angular extent, (2) have an extrapolated 9 GHz flux density of at least 70 mJy, (3) are not known to be an H II region because of a previous RRL detection, and (4) are not known to be a planetary nebula (PN), supernova remnant (SNR), pulsar wind nebula (PWN), Active Galactic Nucleus (AGN), or a luminous blue variable star (LBV). Sources having both MIR and radio continuum emission are likely emitting thermally (Haslam & Osborne, 1987; Broadbent et al., 1989), and are therefore probably either H II regions or planetary nebulae. The plasma ionized by the FUV radiation from the exciting star(s) gives rise to free-free thermal emission at -wavelengths. Warm dust in the nebula absorbs the stellar radiation as well and re-emits in the MIR. Furthermore, small dust grains, which are stochastically heated by the stellar flux, also emit in the MIR.
For the radio continuum we primarily use data from the VGPS. This survey measured 21 cm H I line emission, but produced 21 cm continuum maps from spectral channels with no line emission. The VGPS extends from with latitude coverage varying between and in and it has an angular resolution of . The VGPS combines data from the GBT to fill in the zero-spacing information and is therefore sensitive to both small and large-scale emission features. For the longitude range , we use the NRAO NVSS 20 cm continuum data. The NVSS has an angular resolution of and covers the entire sky north of Declination. It does not include zero-spacing information and therefore some larger, diffuse emission regions are not detected. For , we use the continuum data from the SGPS, which is the southern counterpart to the VGPS. The data were obtained in a similar manner using ATCA for the 21 cm interferometry measurements and the Parkes telescope for the zero-spacing information. The resolution of the SGPS is and it extends from with . Finally, to get the best positions for targets in regions of complex continuum emission, we use the MAGPIS 20 cm data. MAGPIS was made with the VLA and extends from with at an angular resolution of . Although MAGPIS has the zero-spacing information from the Effelsberg 100 telescope, visual inspection shows that diffuse emission detected with the VGPS is often not seen by MAGPIS. We prefer to use the VGPS, NVSS, and SGPS since their resolutions are more comparable to that of the GBT at X-band, and only use MAGPIS to disentangle complex emission regions.
For the MIR emission we use MIPSGAL 24 µm data, which were obtained with the Multiband Imaging Photometer for Spitzer (MIPS: Rieke et al., 2004) on the Spitzer Space Telescope. MIPSGAL covers with at a resolution of at 24 µm. Due to the low 24 µm optical depth of the intervening ISM, MIPSGAL can detect H II regions on the far side of the Galaxy. H II regions are bright in the 24 µm MIPSGAL band for two reasons. First, there is thermal emission from dust grains spatially coincident with the GLIMPSE 8.0 µm emission (see below) produced by the H II region photo-dissociation region (PDR). There is also emission that is spatially coincident with the ionized gas. This emission is most likely produced by small dust grains that are stochastically heated by absorbing ultraviolet photons from the exciting star(s). The grains have a temperature of and they are not in thermal equilibrium. At 24 µm the flux of both components is roughly equal for H II regions surrounded by 8.0 µm bubbles (Deharveng et al., 2010).
Our analysis here also uses 8.0 µm data from the Galactic Legacy Infrared Mid-Plane Survey Extraordinaire (GLIMPSE: Benjamin et al., 2003), which were obtained with the Infrared Array Camera (IRAC: Fazio et al., 2004) on the Spitzer Space Telescope. GLIMPSE has the same Galactic coverage as MIPSGAL, but with a resolution of at 8.0 µm. In addition to the re-radiated emission from heated dust grains, the IRAC 8.0 µm band contains emission from polycyclic aromatic hydrocarbons (PAHs). These molecules fluoresce when they absorb ultraviolet radiation, and are thus an excellent tracer of H II region PDRs.
Criterion 1: Spatially Coincident 20 cm and 24 µm Emission To find H II region candidate targets we seek sources with matching 20 and 24 µm emission. The MIR flux associated with H II regions is orders of magnitude greater than the radio continuum flux (e.g. Wood & Churchwell, 1989b). Since the MIPSGAL sensitivity is 1.7 mJy (Carey et al., 2008), we expect that all H II regions with 9 GHz fluxes mJy (see Criterion 2 below) should be easily detected by MIPSGAL.
To find our H II region candidates we visually compare the 20 radio continuum emission at a particular target location with the 24 µm emission at the corresponding position, searching for sources with spatially coincident radio and MIR emission that also have a similar angular extent. We did not automate our method because of the wide range of H II region morphologies, together with the complex environments in which H II regions are found. Automated detection methods would be extremely difficult to implement, and would likely fail in complex regions. Visual inspection ensures that the target catalog includes both small, compact sources as well as larger, diffuse regions that automated detection might confuse with the background. To search for H II regions, we use the DS9 software111http://hea-www.harvard.edu/RD/ds9/ (Joye & Mandel, 2003) to align the radio and MIR images so that their astrometry matches. We then repeatedly blink between these images in order to find the nominal position of the target, which is the visually determined peak of the radio emission. In order to find all possible targets, we made this analysis for each field at least three times. Each pass through the data added new targets. By the third pass only a small number were added. These were mostly faint sources, but some came from complex fields. After the list was complete, we made a final pass to refine the nominal target positions. In addition to this “blind” search, we also inspected by blinking the positions of sources found in molecular CS () (Bronfman et al., 1996) and IR “bubble” (Churchwell et al., 2006, 2007) catalogs. These objects are prime H II region candidates.
Criterion 2: Flux Density The candidate targets must have an extrapolated 9 flux density greater than 70. This is the flux of the thermal continuum radiation from H II regions ionized by a single O-9 star at a distance of 20 (see §5.6.1). There is no extant continuum survey at 9 with the sky coverage of the HRDS so we must get the fluxes of target H II regions by extrapolating source fluxes from radio continuum surveys made at other wavelengths. We assume that the sources are optically thin at 20 wavelength, so . We use our Kang software222http://www.bu.edu/iar/kang/ to estimate the 9 continuum flux of each candidate. Our Kang photometry places a circular aperture on the source and an annulus around that zone for the background. To be detectable in our survey, optically thin 20 H II region candidates must then have VGPS or NVSS flux densities . We delete all sources not meeting this flux threshold from the target list.
Criteria 3 & 4: Removing Previously Known H II Regions and Other Objects Our H II region candidate criteria can be met by a number of astrophysical objects other than H II regions. Active galactic nuclei (AGN), supernova remnants (SNRs), pulsar wind nebulae (PWNe), luminous blue variables (LBVs), and planetary nebulae (PNe) can all contaminate the target sample. Using the SIMBAD database333http://simbad.u-strasbg.fr/simbad/. we remove such contaminating sources by searching for previously known objects that are located within of the nominal position of all the HRDS targets. By correlating the candidate sources with the SIMBAD database in this way, we also remove known H II regions with measured RRL emission.
It is certainly true that the radio continuum can result from a mixture of free-free (thermal) and synchrotron (non-thermal) emission. Non-thermal emitters such as AGNs, SNRs, and PWNe, however, cannot contribute many contaminating sources to the sample. Fuerst et al. (1987) showed that one can discriminate thermally from non-thermally emitting objects by using the ratio of the infrared to radio fluxes. The IR/radio flux ratio for H II regions is typically 100 times larger than that for non-thermally emitting SNRs, so it is easy to differentiate between the two by eye. Our visual inspection of the MIR and radio images should eliminate all the SNRs from our target sample. Furthermore, since non-thermal emitting sources do not emit RRLs, even if they were on the target list they would not appear in the HRDS catalog of detections (see §4.1). Sources showing coincident MIR and -wave continuum emission almost invariably are thermally emitting: 95% of our sample targets show hydrogen RRL emission with line to continuum ratios of which together suggests that our targets are emitting thermally.
Since PNe emit thermally, they are by far the largest source of contamination. Correlation with SIMBAD helps remove previously known PNe, but there might be many uncataloged PNe that do not appear in SIMBAD. PNe do, however, have broader lines than H II regions because of their expansion (see Garay et al., 1989; Balser et al., 1997), which in principle allows the two populations to be separated ex post facto. Based on their line widths and compact IR emission, a small number of the HRDS sources are probably uncataloged PNe (see §4.4).
Because of the emission from their ejected material, LBV and other evolved stars with ejected nebulae may also appear bright at MIR and radio wavelengths (see Stephenson, 1992; Clark et al., 2003; Mizuno et al., 2010, for their MIR emission characteristics). Most LBVs are removed by correlation with the SIMBAD database using the nominal HRDS target positions. We also identify, and then remove, LBVs by visual examination, since they appear as nearly circular objects in MIPSGAL with very thin emission rings, whereas H II regions generally show less symmetry and broader PDRs.
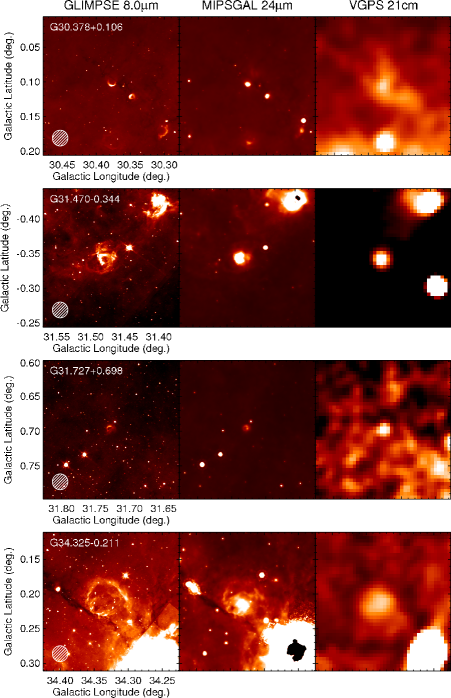
In the HRDS survey zone we find over 1,000 H II region candidates that have spatially coincident MIR and radio continuum emission with a similar morphology and angular extent, criterion (1). The flux cutoff of 70 mJy at 9 GHz, criterion (2), reduces this number to sources, and removing known H II regions and contaminating sources, criteria (3) and (4), gives a final H II region candidate list of 470 targets. Images of the MIR and radio continuum emission for four typical HRDS targets are shown in Figure 1. These images are on a side and show GLIMPSE 8.0 µm (left column), MIPSGAL 24 µm (middle column), and VGPS 21 cm (right column) emission for each target. Evident is the similar angular extent of these targets. The environment surrounding the targets can be quite complex. The “bubble” morphology seen in the GLIMPSE images is a common feature of our targets (see §4.3).
3 Observations and Data Reduction
Our observations were made with the GBT 100 m telescope from June 2008 through October 2010. For each candidate H II region, we interleaved spectral line (using the AutoCorrelation Spectrometer [ACS]) and continuum (using the Digital Continuum Receiver [DCR]) observations. Interleaving observations in this way gives a RRL line-to-continuum ratio that is nearly independent of calibration uncertainties and weather conditions. We focused the telescope and established local pointing corrections every few hours using standard X-band pointing sources.
The calibration of the intensity scale was measured to be within 10% for the RRL and continuum data. The intensity scale was determined by injecting noise of a known magnitude into the signal path at a rate of Hz and Hz for the RRL and continuum observations, respectively, with a duty cycle of 50%. The antenna temperature for the line and continuum data was set using the measured calibration intensity, , of the noise source. The value of varies with frequency and was measured in the lab at 50 intervals using hot and cold loads. We confirmed that the values are accurate with an uncertainty of less than 10% by periodically observing the flux density calibration sources 3C 147 and 3C 286 under good weather conditions near transit. The flux densities for these calibrators are from Peng et al. (2000) and we assume a telescope gain of K Jy-1 (Ghigo et al., 2001). We did not make any corrections for atmospheric opacity or telescope gain as a function of elevation. Under most weather conditions opacity corrections are typically a few percent and at 10 any elevation gain corrections are less than 5% (Ghigo et al., 2001). Overall, the intensity scale in each ACS band is consistent at the level.
To maximize the power and flexibility of our analysis we wrote a large suite of IDL procedures rather than use any of the standard single-dish radio astronomy software packages. We use our own TMBIDL software package 444See http://www.bu.edu/iar/tmbidl to analyze both the line and continuum GBT data. Written in IDL, TMBIDL inspired NRAO to develop their GBTIDL software555See http://gbtidl.sourceforge.net/, which is now the main data analysis tool for the GBT. We find, however, that TMBIDL is much more flexible for our needs. We wrote extensive IDL code to analyze ACS and DCR data both in real time and also for post data acquisition. This HRDS software led to the latest V6.1 version of the TMBIDL package (Bania 2010, private communication).
3.1 Radio Recombination Lines
The sensitivity of the GBT and the power of its ACS together made the HRDS possible. To achieve high spectral sensitivity, we used techniques pioneered by Balser (2006), who realized that there are 8 RRL transitions, to , that fall within the instantaneous bandwidth of the GBT X-band receiver. They can all be measured simultaneously by the GBT with the ACS. The transition, however, is spectrally compromised by the H 108 line at nearly the same frequency so it cannot be used for the HRDS. We thus get 14 independent spectra per OffOn total power observation pair (7 transitions 2 orthogonal polarizations each). We identify the strongest spectral feature in each band as an transition because there are no other strong atomic, molecular, or unidentified lines known in these frequency bands. For sources with strong continuum emission we may also detect the helium and carbon RRLs.
The RRL spectra were gotten by using the ACS in total-power, position switching mode with On– and Off–source integrations of six minutes each (hereafter a “pair”). The Off–source position observation tracked the same azimuth and zenith angle path as the On–source scan. The ACS was configured as 16 independent 50 MHz wide spectral bands. Each was 9-level sampled by 4096 channels. The typical velocity resolution of any band is per channel. Because the target RRL velocities were unknown, all ACS bands were tuned to a center LSR 555The RRL velocities here are in the kinematic local standard of rest (LSR) frame using the radio definition of the Doppler shift. The kinematic LSR is defined by the solar motion of 20.0 toward = [1900.0] (Gordon, 1976). velocity of 42.5 for targets in the range from to . For targets in the = to range the center velocity was 0.0 . The 50 MHz ACS bands span at X-band, which greatly exceeds the LSR velocity range of objects gravitationally bound to the Milky Way. We can thus, in principle, detect RRL emission from any Galactic H II region.
Balser (2006) showed that all these transitions can be averaged together to improve the RRL signal-to-noise ratio, thus giving an extremely sensitive X-band composite nebular spectrum. Because the energy level spacings between adjacent RRLs for are similar relative to the ground state, the line parameters — intensity, line width, and velocity — are nearly identical. For example, the classical oscillator strengths for the and RRLs differ by only 2%, so these lines should have comparable intensities (Menzel 1968). Thus at the high energy levels of our observations, to first order all transitions have the same intensity.
We can thus average all the 14 independent spectra together and get an extremely sensitive composite RRL spectrum for a source. Three steps are required to average the individual RRLs into a source composite spectrum: (1) the velocity scale must be re-gridded to a common resolution; (2) the RRL spectra must be shifted to match the Doppler tracked RRL; and (3) the spectra must be aligned in velocity and averaged together. The first step is required because the velocity resolution is a function of sky frequency, which varies with the different RRL transition frequencies. We therefore re-grid the to RRL spectra to the velocity scale of the spectrum, which has the poorest spectral resolution. The second step is necessary since in the GBT system only the spectral band is properly Doppler tracked. For the third step, we align the velocities and the average spectra in the standard way with a weighting factor of , where is the integration time and is the total system temperature.
We smooth the spectrum with a normalized Gaussian over 5 channels to give a spectrum with a velocity resolution of 1.86 , which compares favorably with the FWHM line widths that are typical for RRLs from Galactic H II regions. We then remove a polynomial baseline, which is usually a second order fit. Finally, we fit Gaussians to this final composite spectrum, which gives us the LSR velocity, line intensity and line width for each emission component. The baseline removal and Gaussian fitting procedures are not automated, but rather are done individually for each source.
This observing technique, coupled with the sensitivity afforded by the GBT’s aperture, gave us unprecedented spectral sensitivity per unit observing time advantage compared with all previous -wavelength RRL surveys of Galactic H II regions. The vast majority of our targets took only a single OffOn total power pair to detect RRL emission and establish an accurate source LSR velocity. Typically, the r.m.s. noise for observations consisting of a single pair is mJy. For some of the weaker sources, and for sources for which we wanted to measure the H/He line ratio more accurately, we made additional observations.
Over the frequency span of the to RRLs, the GBT HPBW beam size varies by 20%. We therefore expect that source structure will make the various transition intensities differ by more than what is theoretically expected. We observed this effect for bright, compact H II regions that we used as calibrators, such as W3, where the RRL intensities approximately scale with the beam area, as is expected for a point source. For the HRDS catalog, we did not scale to a common beam size; the intensities are averages over the beam size range of to .
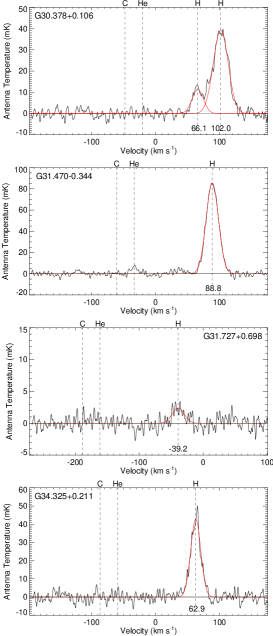
We show in Figure 2 spectra for the Figure 1 H II regions. These are typical HRDS spectra. The G 31.727+0.698 nebula, however, is one of our weakest detections. Both hydrogen and helium RRLs can be seen in the G 31.4700.344 spectrum. We detect two RRL components along the line of sight to G 30.378+0.106, one likely due to W43 (see §4.2).
3.2 Radio Continuum
We used the DCR to measure the continuum flux for our HRDS targets by slewing the telescope across the sky while sampling the total power every 100 ms. We made cross scans centered on the nominal source position consisting of four total-power integrations: forward and backward in Right Ascension, RA, and forward and backward in Declination, Dec. Each scan was in length and we slewed at per second. The DCR was centered at 8665 MHz with a 320 MHz bandwidth.
The continuum data can be considerably more complex than the RRL data due to a combination of source confusion and sky noise. A typical observation of an HRDS target starts with a continuum measurement followed by a spectral line pair. For some sources, however, we have many such continuum scans. We thus average all the forward and backward scans (after first flipping the backwards scans). This average usually blends different observing epochs and weather conditions so it tends to minimize the effects of sky noise. We remove a polynomial baseline, usually a second order fit, from the RA and Dec average scans and then fit Gaussians to them. This analysis cannot be automated and was done on a source by source basis.
The inner Galaxy has a high density of sources that are not always well-separated by the GBT beam. We attempt to resolve this confusion by visually examining VGPS, NVSS, or SGPS images. These data helped us to separate the target’s emission from that of other contaminating sources and sky noise. Each source was analyzed individually and the polynomial baseline was removed based on what we judged was the baseline zero intensity level of the scan. Some sources showed multiple Gaussian components. Sometimes all components can be associated with emission from the HRDS target. In other cases one or more Gaussian components are due to other, unassociated radio continuum sources. The auxiliary radio continuum data from the various sky surveys provided vital extra information that we used to decide which components are due to the HRDS target.
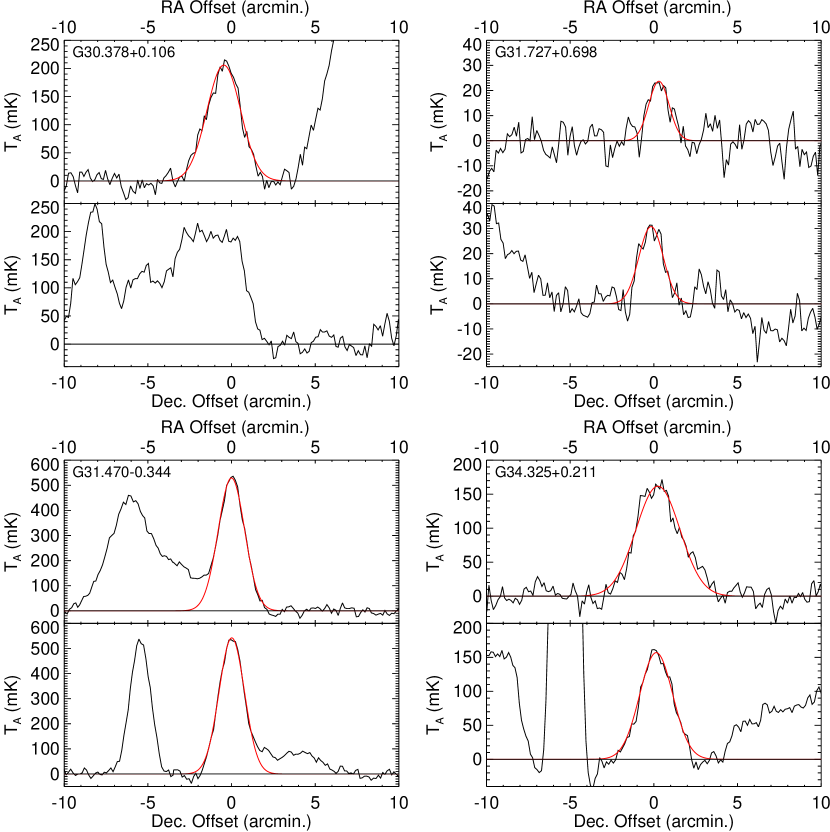
Clearly the resolution of source confusion is a subjective process. Despite our care, the fits to the radio continuum data are, especially for weak sources, uncertain and in some cases no fit is possible. Figure 3, which shows the continuum scans for the four Figure 1 nebulae, illustrates the complex nature of these data. The thick lines show the Gaussian fit to the HRDS component of each scan. For sources with simple emission structure which is also well-centered in the GBT beam, we expect the fitted heights in the RA and Dec scans to be of equal intensity. Additionally, all sources should have fitted sizes at least as large as the GBT beam. When these conditions are not met, it can be a sign of an inaccurate position or poor data quality. Continuum parameters for such sources should be used with extreme caution.
For each source we analyze the RA and Dec continuum emission scans independently. For targets with simple structure we fit a single Gaussian component, which gives a peak intensity (in ) and full width at half maximum (FWHM) angular size (in arcsec) for each RA and Dec scan. For many of the HRDS sources, however, the continuum emission is too complex to be modeled by a single Gaussian. For these cases, we fit the continuum scan with multiple Gaussian components, each with its own peak intensity and FWHM angular size. The sum of these components gives an estimate for the total source integrated intensity (units are [ arcsec]). We then crudely approximate this complex emission with a single Gaussian model whose peak intensity and FWHM angular size together produce the same integrated intensity as the sum of the multiple components. The FWHM angular size of this fictitious single component is set by the maximum separation of the FWHM position extrema of the multiple components with respect to the nominal target position. This angular size, together with the integrated intensity determined by the multiple components, defines the peak intensity of the fictitious single component.
We use the Gaussian components to estimate the source integrated flux density at 8665 . We take the arithmetic average of the RA and Dec intensities to define an average peak intensity and use the 2 K per Jy GBT X-band gain to convert this into the peak flux. Assuming the source continuum emission is a two-dimensional Gaussian in RA and Dec, the integrated source flux, , is:
| (1) |
where is the peak flux, is the GBT beam size at X-band, and , are the FWHM angular sizes derived from the RA and Dec scans (see Kuchar & Clark, 1997).
4 The H II Region Discovery Survey Catalog
We detect radio recombination line and continuum emission from 448 of our 470 targets, over 95% of our sample of H II region candidates. The HRDS targets with detected hydrogen RRLs are listed in Table The Green Bank Telescope H II Region Discovery Survey II. The Source Catalog, which gives their Galactic and Equatorial (J2000) coordinates. For brevity, we provide here only data for the first 10 sources in the HRDS catalog. These stubs show the information given in each catalog table; the complete HRDS catalog data are provided in the electronic version of this paper. Table The Green Bank Telescope H II Region Discovery Survey II. The Source Catalog also provides information about a source’s association with methanol masers (e.g., Pestalozzi et al., 2005) and with CS emission (Bronfman et al., 1996), together with a characterization of the source morphology as seen in Spitzer GLIMPSE 8.0 µm images. Methanol maser and CS emission are both produced in dense gas regions. They are associated with the earliest phases of massive star formation; these data therefore give some indication of the evolutionary state of HRDS targets. The method we use to associate the maser and CS positions with the HRDS targets, as well as the implications of these associations for the HRDS targets are discussed in §4.5. Sources observed but not detected in CS are listed as “ND”. The Table The Green Bank Telescope H II Region Discovery Survey II. The Source Catalog maser velocity is that of the emission component with the highest intensity.
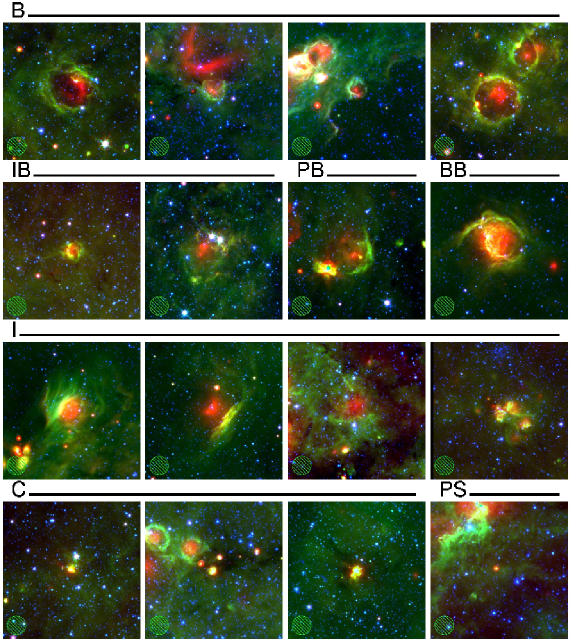
Images of some example HRDS targets are shown in Figure 4. They are made from Spitzer survey data: MIPSGAL 24 µm (red), GLIMPSE 8.0 µm (green), and GLIMPSE 3.6 µm (blue). HRDS targets are often found in complex IR environments and they have a wide range of sizes and morphologies. Figure 4 shows examples of all the different morphological classifications found in Table The Green Bank Telescope H II Region Discovery Survey II. The Source Catalog. For nearly all the angularly resolved HRDS H II regions, the 24 µm emission lies interior to the 8.0 µm emission. This appears to be the MIR signature of Galactic H II regions. Three-color Spitzer images such as Figure 4 can thus be used to find H II region candidates with high reliability. The most striking examples of this phenomenon are the GLIMPSE “bubbles” (see §4.3).
We detected 603 discrete hydrogen RRL components from the 448 HRDS targets. The RRL data are given in the Table 2 GBT HRDS Hydrogen Recombination Line Parameters stub, which lists the source name, the Galactic longitude and latitude, the line intensity, the FWHM line width, the LSR velocity, and the r.m.s. noise in the spectrum. The errors given in Table 2 GBT HRDS Hydrogen Recombination Line Parameters for the fitted line parameters are the uncertainties from the Gaussian fitting. For sources with multiple velocity components detected along the line of sight, the source names are given additional letters, “a”, “b”, “c”, or “d”, in order of decreasing peak line intensity.
A stub of the HRDS radio continuum catalog data is given in Table The Green Bank Telescope H II Region Discovery Survey II. The Source Catalog, which lists the source name, the Galactic longitude and latitude, the peak intensity in the RA and Dec scan directions, the FWHM angular size in the RA and Dec directions, and the integrated flux density derived using Equation 1. For sources better approximated by multiple Gaussians, the angular size listed is the maximum extent of the multi-component composite source and the intensity is that for a single Gaussian component, which is determined by this width and the integrated flux density (see § 3.2). Such “complex” objects are identified by a “C” label in the Notes column of Table The Green Bank Telescope H II Region Discovery Survey II. The Source Catalog. The errors given for the continuum parameters are the uncertainties in the Gaussian fits, propagated as necessary for derived quantities using Equation 1.
The main goal of the HRDS was to detect new Galactic H II regions. To maximize the number of observed objects we therefore used standard observing procedures throughout the survey and did not customize the observing for specific sources. For example, the peak continuum emission observed with the GBT was typically offset relative to the nominal target position, but we did not refine these coordinates, i.e., we did not peak-up on the source relative to the GBT’s beam. Moreover, for some targets it was difficult to establish the continuum zero-level given the complexity of the continuum emission structure on the sky and time variable sky noise. Source confusion or cases where a very weak target is quite near to a strong source can compromise the accuracy of the continuum measurement. In some sources longer continuum cross scans might have yielded more accurate baselines, but our goal was to produce a new catalog of Galactic H II regions not to provide the highest quality continuum data. Much of the continuum data in the HRDS catalog is therefore not suitable for deriving very accurate physical properties of these H II regions, such as the electron density and temperature, the excitation, etc. A subset of sources, however, have single component continuum peaks that lie within 10 of the nominal target position. These nebulae, which are flagged with a “P” label in the Notes column of Table The Green Bank Telescope H II Region Discovery Survey II. The Source Catalog, are our highest quality continuum data. They are suitable for deriving physical properties.
The HRDS catalog, however, is an excellent resource for Galactic structure studies since the nebular positions and LSR velocities are measured with high accuracy. Each RRL detection yields the nebular source velocity. The nebular velocity, when combined with the location, gives the source Galactocentric position and kinematic distance from the Sun. The continuum measurements of the thermal free-free emission give the nebular total flux, angular size, and, crudely, some knowledge of the source morphology.
4.1 Sources Not Detected
We did not detect RRL emission from 22 of the candidate H II region targets. These are typically upper limits, which is the sensitivity of an composite spectrum made from a single observing pair. These non-detections are listed in Table The Green Bank Telescope H II Region Discovery Survey II. The Source Catalog, which gives the source name, the GLIMPSE 8.0 µm morphology (using the Table The Green Bank Telescope H II Region Discovery Survey II. The Source Catalog classifications), comments on each source, and our best estimate of the object’s type: H II region, PN, AGN, or PWN. Nearly half of these non-detections, 10 of the 22 targets, may be PNe or emission line stars. They are unresolved in the IR and the radio continuum surveys we used to compile our target list.
Five sources, 23% of the sample of non-detections, have spatially coincident MIR and radio emission, with morphologies that are similar to HRDS H II regions. Their extrapolated X-band fluxes made them HRDS candidate targets. Their measured X-band continuum emission is quite weak, however, so they are probably H II regions that fall below our detection threshold. One source, G005.7560.932, is an IR bubble with coincident NVSS emission. It is not included in the Churchwell et al. (2007) catalog. This source is odd since it has the same bubble morphology at 8.0 µm and 24 µm, whereas all the other H II regions in our sample show 8.0 µm emission that surrounds, and extends beyond, the 24 µm emission (Deharveng et al., 2010).
The source G045.7970.347 is probably a region of thermally emitting plasma too faint to be detected by the HRDS. It may be a star-forming region that is unrelated to the compact sources seen nearby in MIR images. The G017.223+0.397 target is near a Lockman et al. (1996) “diffuse” H II region source. It is not, however, a diffuse nebulae: Stephenson (1992) says that it is an evolved star, which is plausible on the basis of our non-detection. Stephenson (1992) also claims that G357.387+0.011 is a distant, luminous star.
Five other sources seem to be non-thermal emitters. We believe four of them are AGN because of the poor alignment of their radio and IR emission. If a source is unresolved at resolution, then the MIR and radio emission should be spatially coincident to within . This is not the case for these sources, which suggests that they are chance alignments of AGNs with Galactic MIR sources. The remaining source, G054.096+0.266, is a PWN; it is the PSR J1930+1852 pulsar wind nebula associated with SNR 54.1+0.3. Bright at 24 µm, this source is faint at 8.0 µm, which suggests that line emission may be causing the 24 µm brightness. We observed it by mistake.
4.2 Multiple Velocity Component Sources
Of the 448 HRDS H II regions, 129 (nearly 30%) have multiple RRL components in their spectra at different velocities. We find 105 sources with two components and 23 with three components. One source has four velocity components. With the GBT beam at X-band, it is unlikely that we would detect multiple, physically distinct H II regions along any given line of sight. One of the components must surely come from the HRDS target H II region. The other component may stem from more diffuse ionized gas along the line of sight. This diffuse component may originate from ionizing photons leaking into the extended PDRs produced by nearby, large star-forming regions.
Even H II regions with well-defined PDRs leak radiation beyond the ionization front (Zavagno et al., 2007; Anderson et al., 2010). Moreover, Oey & Kennicutt (1997) compared the observed H luminosity with that predicted from stellar models and concluded that up to 50% of the ionizing flux was escaping from H II regions. The complex morphology of a typical HRDS nebula, e.g. Figure 4, suggests that within any nebula some zones are ionization bounded and others are density bounded.
If we are to derive the kinematic distances and physical properties of HDRS nebulae, we must unambiguously identify their velocities in these multi-component spectra. The resolution of this problem is beyond the scope of this paper. Nonetheless, here we make a preliminary analysis of HRDS sources located near the W43 star forming H II region complex.
Over 30% of the HRDS multiple velocity component sources are located within of the large, massive star forming region W43. This is a mere of the survey area; it represents a significant overabundance of multiple velocity component sources in a very small zone of sky. The RRL LSR velocity of W43, measured from a single resolution pointing, is 91.6 (L89). This velocity corresponds to a kinematic distance of 5.7 kpc (Anderson & Bania, 2009), which places W43 at the end of the Galactic bar (Benjamin et al., 2005). From studies of external Galaxies, we know that the end of galactic bars can have significant star formation (e.g. Martin & Friedli, 1997). The entire W43 complex has velocities ranging from to , when mapped at high angular resolution with the VLA (Balser et al., 2001).
Of the 23 HRDS sources within of W43, 21 have multiple velocity components. The two single component sources are compact H II regions that share the same velocity as W43. All the other sources have one velocity component in the RRL velocity range found by Balser et al. (2001). The other component is from the HRDS target source. The origin of the multiple-velocity components for the sources in the direction of W43 appears to be low density ionized gas along the line of sight. It is at present unclear if this low-density plasma is from FUV photons leaking into the extended PDR surrounding W43, from plasma not necessarily associated with W43 at the end of the Galactic bar, or from both.
If the origin of the multiple-velocity components is leaked plasma from W43 itself, we would expect the intensity of a source’s W43 RRL component to decrease, on average, with its distance from the nominal center of W43, = (30 78, 0 03). Here we are assuming that the intensity of the RRL emission decreases from the center of W43 outwards, just as the continuum emission does. In Figure 5, we plot the intensity of an HRDS source’s W43 RRL component as a function of its distance from the nominal center of W43. Shown is the intensity of the RRL component whose velocity is nearest to the 91.6 velocity of W43. Figure 5 shows that these components are on average stronger for sources near W43. This is consistent with the hypothesis that these spectral lines are caused by an extended, partially ionized PDR surrounding W43.
This interpretation, however, is far from secure. Given the distance to W43, an area in diameter would be pc across. This is extremely large, although not unheard of, for a star forming complex. From thermal radio sources such as W43, when RRL emission is detected we should also be able to detect radio continuum emission. The lack of extended faint continuum emission associated with W43 in the direction of these multiple-velocity RRL sources is therefore also a problem for this interpretation. Perhaps we are detecting a combination of diffuse emission leaked from W43 and plasma at the end of the Galactic bar.
It is similarly unclear what is causing the multiple-velocity components for nearly all other multiple-velocity HRDS sources. These lines of sight must be individually analyzed in order to determine which RRL velocity component is associated with the HRDS compact MIR target. This topic will be addressed in future papers.
4.3 Infrared “Bubble” Sources
Many Spitzer GLIMPSE “bubble” sources seem to be associated with H II regions (Bania et al., 2010; Deharveng et al., 2010). We detected RRLs from the ionized gas in 65 GLIMPSE “bubble” sources cataloged by Churchwell et al. (2006, 2007). By visually examining GLIMPSE images for the entire HRDS zone, with , we find that 170 of the 420 cataloged GLIMPSE bubbles, of the sample, are associated with previously known H II regions. When these are combined with the 65 HRDS detections, more than half of all cataloged MIR bubbles turn out to be H II regions with measured RRL emission.
Altogether there are 207 HRDS sources with a bubble morphology; these are targets classified as “B,” “BB,” “PB,” or “IB” in Table The Green Bank Telescope H II Region Discovery Survey II. The Source Catalog. These additional 142 HRDS nebulae with a bubble morphology that are not in Churchwell et al. (2006, 2007) imply that there is a large population of undiscovered bubbles. Within the HRDS zone there are in fact hundreds more cataloged and uncataloged GLIMPSE bubbles that have spatially coincident radio continuum and MIPSGAL 24 µm emission. They are all H II region candidate targets. They are, however, also very weak continuum sources; all are weaker than the HRDS target flux threshold at 9 .
We speculate that nearly all GLIMPSE bubbles are caused by H II regions (Bania et al., 2010). In the HRDS zone, the combined sample of HRDS and previously known H II regions with measured RRL emission contains nebulae (see § 5). More than 40% have a bubble morphology at 8.0 µm. For longitudes , where source confusion is not as great as toward the Galactic center, the percentage is . The bubble morphology is obviously common for Galactic H II regions.
It appears that H II regions with a bubble morphology do not represent any particular evolutionary state. Some bubble sources are associated with masers and CS emission, which suggests that they are young (see Table The Green Bank Telescope H II Region Discovery Survey II. The Source Catalog and § 4.5). For others, their radio continuum emission is faint and diffuse, implying an evolved state. The bubble morphology is probably a consequence of the density structure of the surrounding ISM. In a turbulent medium, a complete bubble would be difficult to form because a density gradient would favor expansion in the direction of decreased density.
On the basis of CO observations, Beaumont & Williams (2010) argue that the “bubble” sources are in fact physically two-dimensional rings, rather than limb brightened projections on the sky of optically thin three dimensional bubble structures. In this scenario, the rings are produced by the bipolar flows that occur during star formation. To make a complete ring, a bipolar flow source must be oriented at nearly zero inclination angle with respect to the line of sight, so the flows of ionized gas are pointing directly toward and away from the observer. At other inclination angles these flows make incomplete, bipolar rings on the sky.
The ring scenario thus predicts two observational consequences that can be tested with the HRDS data. First, there should be many more bipolar bubbles than complete bubbles, since the latter would be seen only for particular, and rare, inclination angles. Secondly, the RRL line widths for bubbles should be larger than those of the H II region sample at large, since both the red- and blue-shifted ionized gas from the bipolar flow contribute to the bubble line width.
The HRDS catalog strongly suggests that bubble sources are three-dimensional objects. There are far more nearly complete bubbles, 117 morphological class “B” sources, than bipolar nebulae: the HRDS has only 8 morphological class “BB” bipolar bubbles. Bipolar bubbles are quite rare. Furthermore, the average RRL line width of bubble sources is 22 (see § 5.3), which is identical to the average for the entire HRDS sample. Both ring scenario predictions are contradicted by the HRDS catalog nebular statistics. We therefore conclude that the majority of bubble sources are three-dimensional structures.
4.4 Notes on Individual Sources
4.4.1 Possible Planetary Nebulae
Because PNe are physically small compared to H II regions, unresolved
emission seen in GLIMPSE with no nebulosity may be a hallmark of PNe
that might be confused with H II regions. Nearly all of the
8.0 µm images of HRDS sources show nebulosity. There are,
however, 13 HRDS RRL sources that appear point-like in the GLIMPSE
data. These objects may be PNe; they are noted in Table
The Green Bank Telescope H II Region Discovery Survey II. The Source Catalog as being PN candidates, “PN?”. These sources are:
G009.741+0.842, G012.116+0.076,
G012.1990.034, G016.4040.575,
G017.364+0.519, G018.7080.126,
G022.1540.153, G029.8740.819,
G030.2340.139, G030.5320.259,
G030.6630.334, G046.017+0.264,
and G050.556+0.045.
Four of these sources were detected as part of the RMS survey
(Urquhart et al., 2009) and these authors classify them as PNe. Since all
targets classified as point sources (“PS” in
Table The Green Bank Telescope H II Region Discovery Survey II. The Source Catalog) are similar in this regard, it seems likely
that most of them are also PNe.
Based on their 8.0 µm morphology, four additional sources are also likely to be PNe: G003.4490.647, G016.2280.368, G017.414+0.377, and G026.3170.01. Two of these sources, G017.414+0.377 and G026.3170.012, are observed as faint rings at 8.0 µm. Their low 8.0 µm intensity and morphology separate them from the other HRDS 8.0 µm rings. For G026.3170.012, a central point source is detected within the ring. The two other sources, G003.4490.647 and G016.2280.368, are not detected at 8.0 µm. They have a “ring” morphology at 24 µm and are listed in the Mizuno et al. (2010) catalog of MIPSGAL ring sources. These authors suggest that a large percentage of sources observed as rings at 24 µm are PNe or evolved stars.
The HRDS source G031.727+0.698 is also listed in the Mizuno et al. (2010) catalog. This source has a negative LSR velocity of and it is therefore located in the outer Galactic disk. Its large distance gives it a high intrinsic luminosity and a large physical size, which means that it cannot be a PN. The minimal overlap between the HRDS, which contains 207 8.0 µm rings (bubbles), and the Mizuno et al. (2010) catalog of 24 µm rings implies that while 8.0 µm rings nearly always surround H II regions, the rings detected at 24 µm are associated with different objects.
Due to their expansion and higher electron temperature, the line widths of PNe are generally greater than that of H II regions (see Garay et al., 1989; Balser et al., 1997). Balser et al. (1997), for example, find an average hydrogen recombination line width of for a sample of six PNe. The 17 HRDS sources identified here as being possible PNe have an average line width of 25 , which is near the mean of the entire HRDS sample, 22 . Three sources, however, do have broad RRLs: G026.3170.012, G029.8740.819, and G050.556+0.045 have line widths of 38.0, 40.6, and 48.8 , respectively. Surprisingly, six HRDS sources listed as possible PNe have narrow line widths, : G009.741+0.842, G016.4040.575, G017.364+0.519, G017.414+0.377, G018.7080.126, and G022.1540.153. More observations are needed to better understand the nature of these sources.
4.4.2 Non-detections at 8.0 µm
Eight sources have 24 µm emission but no detectable
8.0 µm emission: G003.4490.647,
G011.573+0.340, G016.2280.368,
G019.786+0.285, G023.5130.244,
G023.8490.196,
G029.019+0.170, and
G049.5070.520. These objects are listed in Table
The Green Bank Telescope H II Region Discovery Survey II. The Source Catalog as a non-detection, “ND”. That we detect RRL
emission from these targets points to a thermal origin. Two of these
sources, G003.4490.647 and G016.2280.368,
are identified above as being PNe candidates.
Finally, G049.5070.520 has no associated GLIMPSE or
MIPSGAL emission but is likely associated with W51 (see below). The
four remaining sources all have an extended, curved morphology at
24 µm and are thus unlikely to be PNe.
4.4.3 Nuclear Disk
We found nine sources whose velocity and Galactic location of place them in the nuclear disk of the Milky Way: G358.530+0.056, G358.5520.025, G358.6160.076, G358.6520.078, G358.6800.087, G358.6940.075, G358.720+0.011, G358.827+0.085, and G359.159-0.038. Before the HRDS, only three H II regions were known to share this location and velocity range: G358.6230.066 at , G358.797+0.058 at , and G358.9740.021, which has two RRL components at and (Caswell & Haynes, 1987; Lockman et al., 1996). The location observed by Caswell & Haynes (1987), -, lies in between the two HRDS sources G358.6520.078 and G358.6160.076; it is not a distinct H II region. These HRDS sources are distributed within a Galactic zone in diameter, or pc assuming a distance of 8.5 kpc. Most of these nebulae have a similar compact morphology (we classify five of them as “Compact” in Table The Green Bank Telescope H II Region Discovery Survey II. The Source Catalog) suggestive of relatively early evolutionary stages.
4.4.4 G036.914+0.489
We re-observed G036.914+0.489 in order to resolve confusion about its velocity. L89 found two RRL velocities for his G036.914+0.489 target: and . There are in fact two distinct radio and IR peaks associated with this region: G036.870+0.462 and G036.914+0.485. The velocities of both HRDS sources are near , implying a large distance from the Sun of kpc (Anderson et al., 2011b, in preparation). We do not detect a second emission component from either source.
4.4.5 Coincidence with Infrared Dark Clouds
Some HRDS nebulae coincide with the locations of IR dark clouds (IRDCs). IRDCs are associated with the earliest phases of star formation (Chambers et al., 2009; Rathborne et al., 2010). If the nebulae and IRDCs are truly spatially co-incident, then these regions are candidates for the youngest sources in the HRDS. The best examples of this phenomenon are G009.8750.749, G016.3610.209, G018.8320.300, G027.3660.164, G028.394+0.076, G029.770+0.219, G030.345+0.092, and G030.378+0.106, although this is not a complete list. These HRDS sources generally have a small angular size and are frequently classified as “compact.” This suggests a small physical size and an early evolutionary state. The physical association between these HRDS nebulae and IRDCs, however, is not always clear. For example, G028.394+0.076 is entirely surrounded by a very large IRDC. We detect two velocities for this source: 42.8 and 86.2 . The 86.2 velocity is similar to that of the IRDC, which is 75.8 (Simon et al., 2006). The more than 10 difference is surprising, however, if the two are indeed associated. The nature of the relationship between this H II region and the IRDC remains unclear.
4.4.6 Strange Line Profiles
Two sources have double velocity component line profiles that are different from all other HRDS targets. G028.764+0.281 has hydrogen RRLs at 104.5 and 87.2; G038.1200.227 has its RRLs at 54.7 and 89.3. Both sources have line profiles with a narrow component of line width and a broader component. For G028.764+0.281, the narrow component is at 104.5 and has a FWHM line width of 12.5 . For G038.1200.227, the narrow component has a velocity of 54.7 with a FWHM line width of 12.6 . Bronfman et al. (1996) measured a CS velocity of 83.5 for G038.1200.227, which implies that the narrow 54.7 line is from another source along the line of sight. In both cases it is not obvious what additional source along the line of sight is producing such a narrow recombination line. Adler et al. (1996) argue, however, that the narrow RRL lines that they see in W 3 are caused by partially ionized hydrogen.
4.4.7 Unusual Morphology
One source, G349.5790.680, has a morphology that is not seen in any other HRDS target. Its compact GLIMPSE 8.0 µm emission has the appearance of a bright-rimmed cloud, whereas its MIPSGAL 24 µm emission is more extended and diffuse. G349.5790.680 is near the center of a large (nearly in diameter) 8.0 µm bubble located at = (349 5, 0 6). There is no published RRL velocity for the large bubble although it appears to be an H II region based on the mid-IR morphology. The 19.4 velocity we measure for G349.5790.680 may be that of the large bubble.
4.4.8 Confusion with Other HII Regions
In three cases an HRDS target may be part of a larger, more evolved H II region. For example, G347.536+0.084 is part of the ionization front of the large H II region centered at = (347 5, +0 2). Caswell & Haynes (1987) found RRL emission in two locations along the ionization front at velocities of and . We measure a velocity of for G347.536+0.084. One region, G049.5070.520, has no GLIMPSE or MIPSGAL counterpart; it is a region of radio continuum emission near W51 = (49 5,0 4). Its 63.6 RRL velocity is near that of W51, for which L89 measured a velocity of 58.2 . Finally, G006.0140.364 may be a second ionization front for G005.8990.427, for which L89 measured a velocity of 10.1 . We measure a velocity for G006.0140.364 of 14.2 .
4.5 Astrophysical Context
Many of the HRDS sources appear in catalogs made from existing Galactic surveys, but not as H II regions. The 448 nebulae detected here in RRL emission for the first time, when correlated with previous catalogs made at multiple wavelengths, can provide insight into the properties of star forming regions. Here we focus on the astrophysical implications of HRDS associations with methanol masers and dense molecular clouds traced by CS emission.
4.5.1 Methanol Masers
H II regions are expected to be associated with methanol masers in the earliest phases of high mass star formation (Ellingsen, 2006). Although many of our HRDS nebulae have been observed in methanol maser transitions, there are relatively few detections. Using the Pestalozzi et al. (2005) compilation of 14 methanol maser studies, we find that only 10% (46/448) of the HRDS sources have detected methanol maser emission within of their position. Table The Green Bank Telescope H II Region Discovery Survey II. The Source Catalog lists the velocity for the strongest maser component. This low correlation with methanol masers suggests that either our sample of H II regions is on average not extremely young or that the maser emission is too weak to be detectable. For comparison, Walsh et al. (1998) found that 38% (201/535) of the sources in their UC H II region sample have methanol maser emission. This suggests that the HRDS nebulae are not as young as their UC sample. We defer a more detailed study of the evolutionary state of the HRDS nebulae to a future publication.
4.5.2 Dense Gas
Tracers of dense molecular gas, such as CS, are hallmark characteristics of young H II regions (e.g., Churchwell et al., 1990). The Bronfman et al. (1996) CS () sample contains 110 of our HRDS targets. Bronfman et al. (1996) observed all IRAS point sources satisfying the Wood & Churchwell (1989a) IRAS color criteria for UC H II regions. Roughly half (57/110) of these HRDS sources were detected in CS. Overall, the velocities are in good agreement; the mean difference between the CS and RRL velocity is . There are, however, four sources with velocities that differ by more than : G023.585+0.029, G028.3040.390, G349.437+1.058, and G000.382+0.017 . Furthermore, there are two double-velocity RRL sources whose CS velocity lies in between the RRL velocities: G352.5210.144 and G049.9980.125 . Excluding these sources, the average velocity difference is . Thus, with some exceptions, the CS and RRL velocities are in very good agreement.
The CS non-detections are equally interesting since they imply that the H II region is evolved and has displaced or dissociated its dense molecular gas. IRAS point sources satisfying the color criteria employed by Bronfman et al. (1996) have generally been assumed to be UC H II regions; in many cases this assumption has been proven valid (e.g. Wood & Churchwell, 1989b). That half of the HRDS sources targeted were not detected in CS, however, implies instead that many of the HRDS nebulae are distant and evolved. The CS sensitivity limit may have precluded the detection of faint CS emission from distant nebulae.
5 Properties of the HRDS Nebulae
We derive here the statistical properties of the HRDS sources. Although the HRDS found 448 H II regions, the number of physically distinct nebulae represented by the 603 discrete hydrogen RRL components is not well known. Thermal radio sources can often be resolved into several apparently physically distinct emission regions, each having a somewhat different position and RRL velocity. Furthermore, the most massive star-forming complexes, W43 for example, are extended and fragmented into many sub-clumps of localized star formation, which together can ionize a very large zone. Many of our multiple velocity component targets may be detecting such low density ionized gas in addition to RRL emission from another, physically distinct nebula (see § 4.2). Nonetheless, here we follow the convention established by L89 and assume that each of the HRDS 603 RRLs is produced by a distinct object.
We also wish to compare the properties of the newly discovered HDRS nebulae with those of the previously known H II region census. There is, however, no extant H II region catalog that is suitable for this purpose. We have therefore compiled a catalog of previously known H II regions from existing RRL surveys (Reifenstein et al., 1970; Downes et al., 1980; Caswell & Haynes, 1987; Lockman, 1989; Lockman et al., 1996; Araya et al., 2002; Watson et al., 2003; Sewilo et al., 2004). This catalog improves upon previous efforts not only because it uses the most recent observations but also because it accounts for duplicate sources.
Many H II regions appear in multiple catalogs, so extreme care must be taken when combining them into a single compilation. We visually inspect the radio continuum and MIR emission from all previous RRL observations of HII regions to help identify sources that were observed by multiple authors. If observed positions are part of the same contiguous radio continuum and MIR zone of emission and have RRL velocities within 5 of one another, we deem them to be observations of the same object. For such matches we only keep the source data from the most recent catalog, because the newest recombination line data are almost invariably the most accurate. We have also removed known SNRs, LBVs, and PNe from the sample through correlation with the SIMBAD database using the nominal HRDS target positions and a 5 ′ search radius.
We refer hereafter to this catalog of H II regions previously known to reside within the HRDS longitude and latitude range as the “Known” sample. For each source, the Known sample catalog contains the Galactic longitude and latitude, the RRL LSR velocity, and the FWHM line width. The Known sample data can be found online as an ASCII text file 666http://go.nrao.edu/hrds. This catalog is as yet a work in progress. It still is likely to contain some residual contamination and duplicate entries.; Anderson et al. (2011a, in preparation) give the full details. There are 456 unique H II regions in the Known sample, although there is likely some residual contamination. With its 448 unique positions, the HRDS has thus doubled the sample of H II regions in the survey zone.
5.1 Galactic Distribution
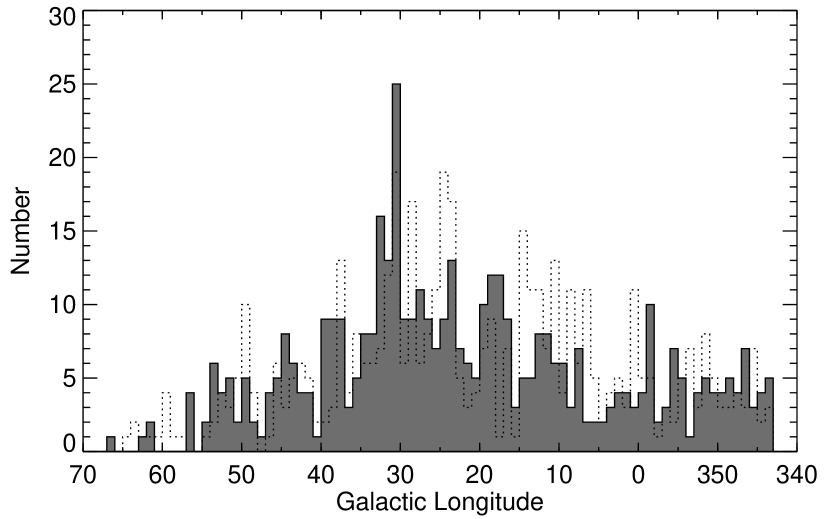
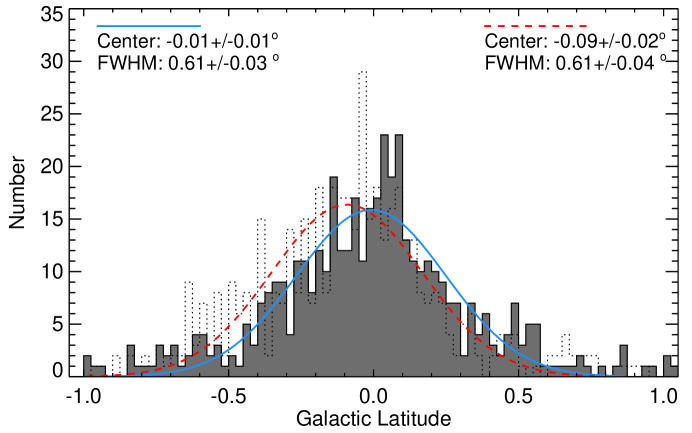
The Galactic longitude distribution of the HRDS and Known samples, shown in Figure 6, are very similar. In Figure 6, the HRDS sample is shown as dark gray and the Known sample is shown as a dotted outline. A Kolmogorov-Smirnov (K-S) test shows that the distributions are not statistically distinct. The HRDS Galactic latitude distribution, shown in Figure 7, peaks closer to the Galactic mid-plane compared with the Known sample. A Gaussian fit to the two distributions shows that both the HRDS and the Known sample have essentially the same FWHM scale-height of . A K-S test of the two samples, however, reveals significant statistical differences, entirely due to the difference in peak latitude. It is not clear why the two distributions peak at different latitudes. Anderson (2010) found that the nebulae in our pilot study for the HRDS were on average more distant than the Known sample H II regions. The HRDS may simply be sampling a different area of the Galaxy.
5.2 Galactic Structure
The fundamental result of any RRL survey is the LSR velocity of a nebula. Thus the fundamental map of the observed data is its diagram. The HRDS and the previously known H II regions together give a census of the Inner Galaxy, the zone within of the direction to the Galactic center, that shows clear evidence for an ordered pattern of Galactic structure in space (Bania et al., 2010). This was asserted by previous researchers, but our new census, which has a factor of two more objects, now unambiguously shows the kinematic signatures of the spatial distribution of H II regions, a concentration of nebulae at the end of the Galactic bar, and nebulae located on the kinematic locus of the 3 kpc Arm. The HII region Galactocentric radial distribution shows very narrow () concentrations of star formation at Galactic radii of 4.25 and 6.00 . This was known before but the HRDS sharpens the contrast and now makes this structure very robust (Bania et al., 2010). More detailed Galactic structure studies that use kinematic distances for HRDS nebulae determined by Anderson et al. (2011b, in preparation) are underway (Bania et al. 2011, in preparation).
The HRDS has 34 negative-velocity H II regions in the first Galactic quadrant at . This represents 7% of all HRDS nebulae in this zone. First-quadrant sources with negative velocities are unaffected by the kinematic distance ambiguity; assuming circular rotation about the Galactic center, a negative RRL velocity implies that a nebula is beyond the Solar orbit at a Galactocentric radius of more than 8.5 . Before this survey, there were only seven known H II regions with negative-velocities in this region. We have therefore increased the sample of negative-velocity H II regions thought to lie beyond the Solar orbit in this Galactic zone by almost 500%. The negative-velocity sources are fainter on average when compared with the HRDS sample as a whole. Their average continuum intensity is mK, whereas the HRDS average is mK. One negative-velocity source, G032.928+0.607, has a continuum intensity of mK, making it one of the brightest HRDS nebulae. Because of their extreme distances, these sources are quite luminous. They lie along the locus of the Milky Way’s “Outer Arm” (Bania et al., 2010). These regions of massive star formation in the outer Galaxy can provide important constraints on Galactic chemical evolution.
The HRDS has nine sources in the Galactic center direction with RRL velocities smaller than . This suggests that they lie in the “Nuclear Disk,” the region of high velocity gas in the inner of the Milky Way. These sources all lie between and Lockman et al. (1996) found two “diffuse” nebulae in this part of the sky, which are the only previously known nebulae with similar velocities. We find only one source, G000.7290.103, with a velocity, 105.3 , that could place it in the red-shifted side of the nuclear disk. Although these ten sources show that star formation is ongoing in the nuclear disk, Caswell et al. (2010) find no methanol masers with nuclear disk velocities.
5.3 Radio Recombination Line Widths
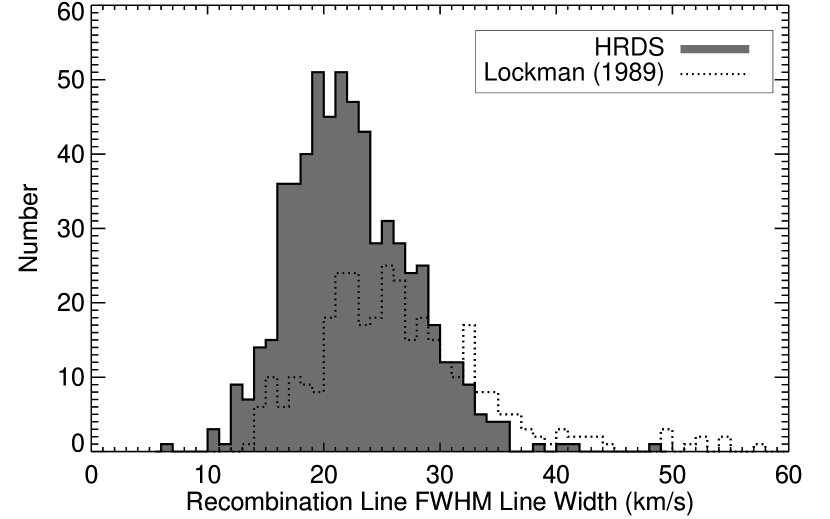
The line widths of H II region RRLs are set by a combination of thermal, turbulent, and ordered motions (e.g., flows). This line width greatly exceeds the thermal width expected from the temperature that is typical of H II region plasmas. H II region RRLs are thus significantly broadened by turbulent and ordered motions. In Figure 8, we show the RRL full width at half maximum (FWHM) line width distribution for the HRDS sample (dark gray) and the subset of the L89 sample from the HRDS Galactic longitude and latitude range (dotted outline). We compare the HRDS with a single sample, that of L89, rather than the Known sample in order to minimize any possible systematic effects stemming from different observing and data analysis techniques.
The typical FWHM line widths for the HRDS nebulae are narrower than those of the L89 H II regions. The distribution for the HRDS sample peaks at , whereas the L89 sample is noticeably broader and shows peaks at 23 and 26 . The formal means and standard deviations are for the HRDS compared with for L89. A KS test of the HRDS line widths (603 sources) and the L89 line widths (462 sources) shows that the two distributions are statistically distinct to a high degree of certainty. Some of the difference between the two distributions may be due to the different spectral resolutions, which are 1.86 and 4 , respectively, for the HRDS and L89 surveys. The L89 line widths could also be broader because the 140 Foot telescope’s bigger beam (195 ″ compared with the GBT’s 82 ″ ) sampled a much larger volume of gas.
The HRDS has 35 nebulae with extremely narrow, , line widths. These line widths can be used to estimate the maximum electron temperature of the H II region plasma. Since turbulence and ordered motions only broaden the RRLs, interpreting the line width as being purely thermal sets a robust upper limit on the nebular electron temperature. Extremely narrow line widths, , imply “cool” nebulae with electron temperatures K. Such nebulae were discovered by Shaver et al. (1979). They were first detected in appreciable numbers by L89, who speculated that cool nebulae may be common and that few were known because of the sensitivity limits of the existing RRL surveys. The HRDS, however, shows that cool nebulae are indeed rare in the Galaxy: only of HRDS sources have line widths smaller than . This fraction is, however, three times higher than that found for the L89 sample.
We detect only three nebulae with large, , line widths. Ignoring any contribution from ordered motions and assuming that the thermal and turbulent components add in quadrature, lines broader than imply turbulent motions of order 35 for a typical H II region plasma. Some broad line width sources, however, may in fact be PNe (see §4.4).
As the spectral signal-to-noise decreases, the line width derived from Gaussian fitting becomes increasingly uncertain. Furthermore, with low signal-to-noise, double-velocity components may be not be well-separated and an erroneously large line width might be derived. In Figure 9, we plot the line width as a function of the line intensity for the HRDS (left panel) and the L89 samples (right panel). Figure 9 shows that the line width distribution for low intensity HRDS sources is similar to that of the entire distribution. This is not the case for the L89 sample — many broad line sources are of low intensity. We conclude that at centimeter-wavelengths Galactic H II regions have line widths . The HRDS has only eight lines (1%) broader than , and only four lines broader than . Line widths greater than 35 should be regarded with suspicion because they may be the result of a low signal-to-noise detection, represent blended velocity components, or a sign that the source is a PN and not an H II region.
5.4 Continuum Angular Size
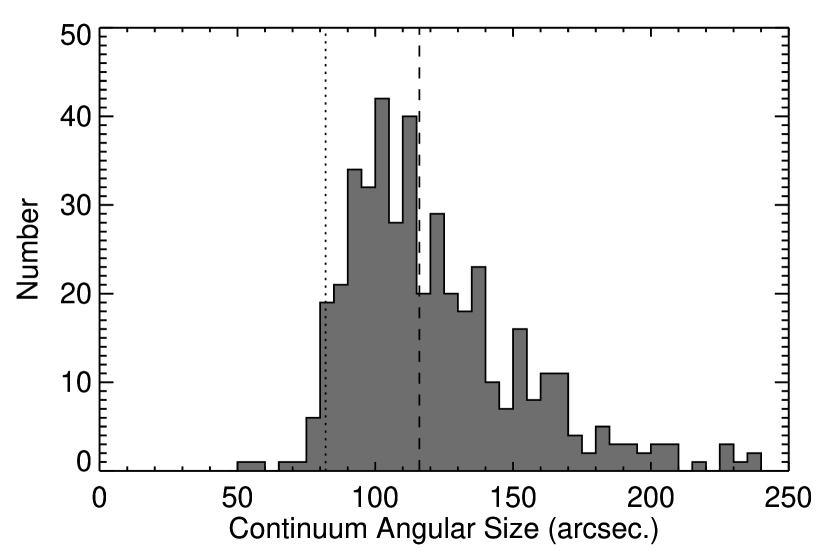
The distribution of the continuum angular sizes for HRDS nebulae is shown in Figure 10 which plots the geometric mean of Gaussian fits to the RA and Dec continuum scans. Altogether, we have a useable continuum measurement in either RA or Dec. for 441 HRDS nebulae. Here we use the fitted FWHM angular sizes uncorrected for the GBT beam. Typical errors for the fits are 5 to 10 . Assuming Gaussian source and beam shapes, the observed and true angular sizes are related by the expression: , where is the observed size (shown in Figure 10), is the true source size, and is the beam size. The vertical dashed line in Figure 10 flags the 116 ″ size that would be measured by the GBT for a source that just fills its X-band beam. After correcting for the beam size, the majority of the HRDS nebulae, 235 of 441 (53%), are unresolved by the GBT beam. Eleven sources () have angular sizes larger than ; these are not shown in Figure 10.
Although small in angular size, many HRDS nebulae lie at extreme distances from the Sun (Anderson, 2010, Anderson et al., 2011b, in preparation). Thus many of these angularly small nebulae are actually large in physical size. If the HRDS nebulae have on average large physical sizes, this would imply an evolved state and would explain why the HRDS targets are in general not correlated with methanol masers and CS emission (see 4.5).
5.5 Planetary Nebula Contamination
There is likely some contamination from PNe in the HRDS sample because our selection criteria locate thermally emitting sources and not just H II regions. We have, however, identified only 17 HRDS sources that might be PNe (see § 4.4.1). Thus fewer than 4% (17/448) of the HRDS sources are potential PNe candidates, which confirms Bania et al. (2010) who argued that the level of contamination in the HRDS by PNe must be quite small. This conclusion was based on considerations of Galactic structure, scale height, RRL line widths, and the RRL line-to-continuum ratios (i.e. nebulae electron temperatures). In particular, the clear evidence for Galactic structure seen in the and Galactic radial distributions of HRDS nebulae implies that the level of PNe contamination in the HRDS sample must be minimal. Because PNe are an old stellar population their Galactic orbits are well-mixed. PNe show, therefore, no structure in their Galactocentric radial distribution and their Galactic distribution is a scatter plot constrained only by velocities permitted by Galactic rotation. Any PNe contamination of the HRDS sample must therefore be very small, otherwise these interlopers would suppress the unambiguous signal of Galactic structure seen in the HRDS Galactocentric radial and distributions.
5.6 Survey Completeness
By assuming a flux distribution, one can assess the completeness of a flux-limited survey. There are good reasons to expect a power law for the HRDS fluxes. For example, power law flux distributions have been found for the MSX, GLIMPSE, and IRAS point source catalogs. A power law distribution of fluxes reflects an underlying power law for source luminosities together with a relatively structureless pattern of source locations across the Galaxy. For H II regions, it is well-known that a power law is a good approximation to the luminosity function (e.g., Smith & Kennicutt, 1989; McKee & Williams, 1997) and that they are relatively smoothly located across the Galaxy. While there are strong peaks in the H II region Galactocentric distance distribution (cf. Anderson & Bania, 2009; Bania et al., 2010), their heliocentric pattern shows no structure.
We attempt to assess the completeness of the HRDS by evaluating the integrated continuum flux distribution calculated using Equation 1 and assuming a power-law distribution of fluxes.
Because the radio continuum data suffer from confusion and possible zero point uncertainties, we also use the RRL data to estimate the continuum flux of the HRDS nebulae. To do this we assume an X-band line-to-continuum ratio of 0.09. This ratio is the average value of the Quireza et al. (2006a) sample of Galactic H II regions, derived using their 28 highest quality measurements (their quality factor values of “A” or “B” for both the line and the continuum data). We then use Equation 1 and the fitted RA and Dec continuum scan widths to get the integrated continuum fluxes. In both cases we are assuming that the sources are Gaussian in both RA and Dec and well-characterized by the cross scans. We are also implicitly assuming that the HRDS nebulae do not suffer greatly from optical depth effects (see §5.6.2).
Histograms of the integrated source flux distribution for HRDS nebulae are plotted in Figure 11, where the bottom panel shows the fluxes derived using the continuum data and the top panel shows continuum fluxes estimated from the RRL data. Solid lines are power-law fits to a panel’s data for the range 200 to 1,000 mJy. The dashed line shows the fit to the other panel’s data. We estimate the completeness limit using the histogram bin where the fit deviates significantly from the fitted power law; these limits are shown as vertical dotted lines. The fit to the continuum flux distribution has a slope of and shows a completeness limit of mJy. This fit is, however, rather poor (reduced =15). The fit quality of the RRL estimated continuum flux is much better (reduced =3). It is best-fit with a slope of and shows a completeness limit of mJy. The HRDS completeness limit of 120 mJy cited by Bania et al. (2010) was based on an early analysis of sources from to . It appears that the completeness limit is lower in this region of the Galaxy, possibly because these candidate targets were identified using the more-sensitive VGPS data.
There is a large difference between the two distributions shown in Figure 11. Some of the discrepancy is caused by assuming a single line-to-continuum ratio for the entire sample. In reality the line-to-continuum ratio varies between H II regions. Perhaps a larger issue, however, is that many of our targets are in locations with significant continuum emission structure. It is often difficult to separate the target’s emission from that of other sources and/or noise due to sky fluctuations. In many cases it is also difficult to establish a reliable zero point for the continuum intensity. Because of these concerns, even though we must assume a line-to-continuum ratio, using the line intensity as a proxy may in fact be a better estimate of the actual continuum flux of faint sources.
The completeness limit derived here is over twice that expected from our HRDS target list. This discrepancy almost certainly stems from the uncertainty in the extrapolation of 20 cm radio continuum fluxes to predicted 3 cm (X-band) GBT fluxes. We found empirically that the flux density actually measured at X-band can differ by a factor of two from the extrapolated flux density.
5.6.1 Spectral Type Completeness
At X-Band, RRL emission propagates on average through an optically thin medium and thus we can detect H II regions on the far side of the Galaxy. Here we estimate the distance to which we can detect H II regions ionized by stars of various spectral types given the derived HRDS completeness limit of 180 mJy. To do this we first must calculate the luminosity dependence of H II regions for a range of ionizing spectral types.
The spectral type of the exciting star of an H II region, assuming ionization by a single star, can be estimated from its radio flux (Rubin, 1968):
| (2) |
where is the ionization rate, the number of Lyman Continuum ionizing photons emitted per second, is the nebular radio flux density, and is the electron temperature. This equation is almost unaffected by source geometry and variations in electron density within the source, but does assume that the continuum emission is optically thin.
Using the Lyman continuum photon emission rates for stars of spectral type O3 through B0.5 calculated by Sternberg et al. (2003), we convert the Equation 2 values into ionizing star spectral types. We plot in Figure 12 the expected flux density of H II regions ionized by single stars of spectral type O3 to B0 as a function of the distance to the H II region. The gray curves in Figure 12 show the estimated flux for the range of electron temperatures found in H II regions, to K. The dashed line shows the 70 extrapolated 9 GHz flux limit of the HRDS target list. The dash-dot line shows the actual HRDS 180 flux limit derived in §5.6. The HRDS is complete for all H II regions surrounding single O-stars within 12 of the Sun (dotted line). Being flux-limited, however, the HRDS is complete to different distances for each spectral type. The HRDS can detect H II regions ionized by single O7 stars across the entire Galactic disk. Since the ionizing flux decreases rapidly for later spectral types, however, we can only detect H II regions ionized by B1 stars at a distance of only a few .
5.6.2 Optical Depth Effects and Confusion
Young H II regions may be optically thick at 20 , an effect which could affect our completeness. We use the 20 VGPS and NVSS data to estimate the X-band flux. If a nebula is optically thick at 20 then its extrapolated X-band flux would be underestimated. The source might then fall below our flux threshold and so not make it onto the HRDS target list. The flux density of an H II region rises as until it peaks at a frequency, , called the “turnover frequency.” At frequencies less than the nebula is optically thick whereas at frequencies greater than it is optically thin. In the optically thin regime, the flux density has a very weak dependence on frequency, . The turnover frequency is:
| (3) |
where EM is the emission measure and is the electron temperature. For compact H II regions with K and , the turnover frequency is near 1 GHz. Some UC and hyper-compact H II regions may have emission measures in excess of (Keto et al., 2008), which leads to turnover frequencies near 15 GHz. Thus, optical depth effects become important for young UC H II regions with high emission measures and for observations at low frequencies. Our survey therefore is less complete for the youngest UC and hyper-compact H II regions that are optically thick at 1.4 GHz because we have not targeted these nebulae in our observations.
While we make no attempt to prove empirically that our target location method finds all possible H II region candidates, it does not seem to be severely affected by non-detections in the radio and IR surveys or by source confusion. In the HRDS survey zone we find over 1,000 H II region candidate targets that have spatially coincident MIR and radio continuum emission with a similar morphology and angular extent. About 40% of these objects have 20 cm flux densities below the 85 mJy HRDS 20 cm flux density cutoff. Our method thus easily finds a large number of sources fainter than the flux threshold we used for the HRDS. We conclude that the apparent brightness of sources in the radio and IR data does not severely impact our completeness.
Confusion may also limit the completeness of this survey. Because of the large number of sources found near W43 at -, which is the most complicated emission region within the survey zone, we do not believe confusion significantly affects our ability to visually identify H II region candidates. In large part this is because that radio emission is relatively unconfused compared to the IR emission. The most significant problem affecting our completeness is likely the errors in the X-band fluxes extrapolated from the 20 radio continuum data because this has a strong impact on which sources were observed.
6 Summary
The Green Bank Telescope H II region discovery survey at 9 GHz has doubled the number of known H II regions in the Galactic zone with . The HRDS targets were selected based on spatially coincident 24 µm and 20 cm emission of a similar angular extent. Our RRL detection rate of 95% proves that this criterion is extremely effective in identifying H II regions. The derived survey completeness limit, 180 mJy at X-band, is sufficient to detect all optically thin H II regions ionized by single O-stars at a distance of 12 from the Sun. These recently discovered nebulae share the same distribution on the sky as does the previously known census of Galactic H II regions. On average, however, the new nebulae have fainter continuum fluxes, smaller continuum angular sizes, fainter RRL intensities, and smaller RRL line widths.
Nearly 30% of the HRDS H II regions (129 nebulae) have multiple hydrogen RRLs in their spectra at different velocities. Moreover, over 30% of these multiple velocity component sources are located with 2°of the large, massive star forming region W43. Low density ionized gas produced by FUV photons leaking into the extended PDR surrounding W43 appears to be responsible for nearly all the multiple velocity components detected in this region of sky. We speculate that the majority of the HRDS multiple velocity component RRL spectra stem from similar low density PDR plasmas distributed over a large region of star formation. These zones are so large in angle that they overlap the lines of sight to our HRDS targets.
The HRDS has 207 H II regions with a bubble morphology at 8.0 µm in the GLIMPSE survey, 65 of which have been cataloged previously. By comparing the positions of bubbles detected in GLIMPSE with the Known sample of H II regions, we find that about half of all Galactic H II regions have a bubble morphology in the infrared. We speculate that nearly all GLIMPSE bubbles are caused by H II regions (Bania et al., 2010). The bubble morphology is probably not associated with any particular evolutionary stage, but is rather an indication of the homogeneity of the ambient environments of these H II regions. The HRDS statistics on the distribution of different morphologies and the line widths of bubble sources strongly suggest that these objects are limb brightened projections on the sky of optically thin three dimensional structures, rather than two-dimensional rings produced by bipolar flows.
The HRDS has 34 H II regions with negative LSR velocities. These first Galactic quadrant nebulae lie beyond the Solar orbit at 12 in the outer Galactic disk, 9, placing them in the high-z, warped Outer Arm. Previously there was only a single H II region known in this zone. This new sample of outer Galactic disk H II regions paves the way for future studies. Because metals are the main coolants in the photo-ionized gas, the H II region heavy element abundance can be derived by proxy using the nebular electron temperature, . The electron temperature of H II regions is directly related to the amount of processing of the gas and dust from which it formed, and thus to Galactic chemical evolution (GCE). There are relatively few H II regions with accurately derived values, especially for the 10 region which is critical for constraining models of GCE (Fu et al., 2009). Determining electron temperatures for these Outer Arm and other HRDS nebulae will be of great importance for future GCE studies.
The HRDS also has ten H II regions whose position and velocity place them in the nuclear disk. Previously there were only two H II regions known to lie in this part of the Galaxy. These HRDS nebulae show conclusively that active star formation is occurring in the innermost part of the Milky Way.
The distribution of HRDS nebular line widths peaks at , which is smaller than the line widths found for the previously known H II region sample. The combined census distribution shows that Galactic H II regions at 9 GHz have line widths smaller than 35. Line widths greater than this may be the result of multiple components along the line of sight, a low signal-to-noise detection, or misidentification of a planetary nebula as an H II region. The HRDS has 35 nebulae with extremely narrow, , line widths. These narrow line widths imply “cool” nebulae with electron temperatures . Such nebulae were first detected in appreciable numbers by Lockman (1989), who speculated that cool nebulae may be common and few were known because of survey sensitivity limits. The HRDS shows, however, that cool nebulae are indeed rare in the Galaxy: only 6% of HRDS H II regions have line widths smaller than 15.
Finally, the majority of the HRDS H II regions are unresolved with the GBT beam at X-band. Despite their small angular size, however, it would be wrong to assume that these nebulae are in an early stage of their evolution. The HRDS sample shows a poor correlation with dense gas and methanol masers, which are usually associated with young H II regions. Instead, the HRDS nebulae probably span a wide range of evolutionary stages. Their small angular sizes result from their being located on average at large distances from the Sun.
Appendix A The HRDS Web Site
We have constructed a web site to give others access to the HRDS data777http://go.nrao.edu/hrds. On this site one can download all the data from Tables The Green Bank Telescope H II Region Discovery Survey II. The Source Catalog, 2 GBT HRDS Hydrogen Recombination Line Parameters, and The Green Bank Telescope H II Region Discovery Survey II. The Source Catalog, in addition to the spectra shown in Figure 2, the continuum scans shown in Figure 3, and the three-color MIR images shown in Figure 4. We will continue to extend this site as more data are taken on the HRDS sources.
References
- Adler et al. (1996) Adler, D. S., Wood, D. O. S., & Goss, W. M. 1996, ApJ, 471, 871
- Anderson (2010) Anderson, L. D. 2010, PhD thesis, Boston University
- Anderson & Bania (2009) Anderson, L. D., & Bania, T. M. 2009, ApJ, 690, 706
- Anderson et al. (2010) Anderson, L. D., et al. 2010, A&A, 518, L99+
- Araya et al. (2002) Araya, E., Hofner, P., Churchwell, E., & Kurtz, S. 2002, ApJS, 138, 63
- Balser (2006) Balser, D. S. 2006, AJ, 132, 2326
- Balser et al. (1997) Balser, D. S., Bania, T. M., Rood, R. T., & Wilson, T. L. 1997, ApJ, 483, 320
- Balser et al. (2001) Balser, D. S., Goss, W. M., & De Pree, C. G. 2001, AJ, 121, 371
- Bania et al. (2010) Bania, T. M., Anderson, L. D., Balser, D. S., & Rood, R. T. 2010, ApJ, 718, L106
- Beaumont & Williams (2010) Beaumont, C. N., & Williams, J. P. 2010, ApJ, 709, 791
- Beichman et al. (1988) Beichman, C. A., Neugebauer, G., Habing, H. J., Clegg, P. E., & Chester, T. J., eds. 1988, Infrared astronomical satellite (IRAS) catalogs and atlases. Volume 1: Explanatory supplement, Vol. 1
- Benjamin et al. (2003) Benjamin, R. A., et al. 2003, PASP, 115, 953
- Benjamin et al. (2005) —. 2005, ApJ, 630, L149
- Broadbent et al. (1989) Broadbent, A., Osborne, J. L., & Haslam, C. G. T. 1989, MNRAS, 237, 381
- Bronfman et al. (1996) Bronfman, L., Nyman, L.-A., & May, J. 1996, A&AS, 115, 81
- Carey et al. (2008) Carey, S. J., Mizuno, D. R., Kraemer, K. E., Shenoy, S., Noriega-Crespo, A., Price, S. D., Paladini, R., & Kuchar, T. 2008, MIPSGAL v3.0 Data Delivery Description Document (29 August 2008)
- Carey et al. (2009) Carey, S. J., et al. 2009, PASP, 121, 76
- Caswell & Haynes (1987) Caswell, J. L., & Haynes, R. F. 1987, A&A, 171, 261
- Caswell et al. (1995) Caswell, J. L., Vaile, R. A., Ellingsen, S. P., Whiteoak, J. B., & Norris, R. P. 1995, MNRAS, 272, 96
- Caswell et al. (2010) Caswell, J. L., et al. 2010, MNRAS, 404, 1029
- Chambers et al. (2009) Chambers, E. T., Jackson, J. M., Rathborne, J. M., & Simon, R. 2009, ApJS, 181, 360
- Churchwell et al. (1990) Churchwell, E., Walmsley, C. M., & Cesaroni, R. 1990, A&AS, 83, 119
- Churchwell et al. (2006) Churchwell, E., et al. 2006, ApJ, 649, 759
- Churchwell et al. (2007) —. 2007, ApJ, 670, 428
- Clark et al. (2003) Clark, J. S., Egan, M. P., Crowther, P. A., Mizuno, D. R., Larionov, V. M., & Arkharov, A. 2003, A&A, 412, 185
- Condon et al. (1998) Condon, J. J., Cotton, W. D., Greisen, E. W., Yin, Q. F., Perley, R. A., Taylor, G. B., & Broderick, J. J. 1998, AJ, 115, 1693
- Deharveng et al. (2010) Deharveng, L., et al. 2010, A&A, 523, A6+
- Downes et al. (1980) Downes, D., Wilson, T. L., Bieging, J., & Wink, J. 1980, A&AS, 40, 379
- Ellingsen (2006) Ellingsen, S. P. 2006, ApJ, 638, 241
- Ellingsen et al. (1996) Ellingsen, S. P., von Bibra, M. L., McCulloch, P. M., Norris, R. P., Deshpande, A. A., & Phillips, C. J. 1996, MNRAS, 280, 378
- Fazio et al. (2004) Fazio, G. G., et al. 2004, ApJS, 154, 10
- Fu et al. (2009) Fu, J., Hou, J. L., Yin, J., & Chang, R. X. 2009, ApJ, 696, 668
- Fuerst et al. (1987) Fuerst, E., Reich, W., & Sofue, Y. 1987, A&AS, 71, 63
- Garay et al. (1989) Garay, G., Gathier, R., & Rodriguez, L. F. 1989, A&A, 215, 101
- Gaylard & MacLeod (1993) Gaylard, M. J., & MacLeod, G. C. 1993, MNRAS, 262, 43
- Ghigo et al. (2001) Ghigo, F., Maddalena, R., Balser, D., & Langston, G. 2001
- Giveon et al. (2005) Giveon, U., Becker, R. H., Helfand, D. J., & White, R. L. 2005, AJ, 130, 156
- Giveon et al. (2008) Giveon, U., Becker, R. H., & White, R. L. 2008, AJ, 135, 1697
- Gordon (1976) Gordon, M. A. 1976, in Methods of Experimental Physics: Volume 12: Astrophysics, Part C: Radio Observations, ed. M. L. Meeks (Academic Press), 277–283
- Gum (1955) Gum, C. S. 1955, MmRAS, 67, 155
- Haddock et al. (1954) Haddock, F. T., Mayer, C. H., & Sloanaker, R. M. 1954, ApJ, 119, 456
- Hanbury Brown & Hazard (1953) Hanbury Brown, R., & Hazard, C. 1953, MNRAS, 113, 123
- Haslam & Osborne (1987) Haslam, C. G. T., & Osborne, J. L. 1987, Nature, 327, 211
- Haverkorn et al. (2006) Haverkorn, M., Gaensler, B. M., McClure-Griffiths, N. M., Dickey, J. M., & Green, A. J. 2006, ApJS, 167, 230
- Helfand et al. (2006) Helfand, D. J., Becker, R. H., White, R. L., Fallon, A., & Tuttle, S. 2006, AJ, 131, 2525
- Hoglund & Mezger (1965) Hoglund, B., & Mezger, P. G. 1965, Science, 150, 339
- Hughes & MacLeod (1989) Hughes, V. A., & MacLeod, G. C. 1989, AJ, 97, 786
- Joye & Mandel (2003) Joye, W. A., & Mandel, E. 2003, in Astronomical Society of the Pacific Conference Series, Vol. 295, Astronomical Data Analysis Software and Systems XII, ed. H. E. Payne, R. I. Jedrzejewski, & R. N. Hook, 489
- Keto et al. (2008) Keto, E., Zhang, Q., & Kurtz, S. 2008, ApJ, 672, 423
- Kuchar & Clark (1997) Kuchar, T. A., & Clark, F. O. 1997, ApJ, 488, 224
- Kurtz et al. (1994) Kurtz, S., Churchwell, E., & Wood, D. O. S. 1994, ApJS, 91, 659
- Lockman (1989) Lockman, F. J. 1989, ApJS, 71, 469
- Lockman et al. (1996) Lockman, F. J., Pisano, D. J., & Howard, G. J. 1996, ApJ, 472, 173
- MacLeod & Gaylard (1992) MacLeod, G. C., & Gaylard, M. J. 1992, MNRAS, 256, 519
- Martin & Friedli (1997) Martin, P., & Friedli, D. 1997, A&A, 326, 449
- McKee & Williams (1997) McKee, C. F., & Williams, J. P. 1997, ApJ, 476, 144
- Menten (1991) Menten, K. M. 1991, ApJ, 380, L75
- Mezger & Hoglund (1967) Mezger, P. G., & Hoglund, B. 1967, ApJ, 147, 490
- Mizuno et al. (2010) Mizuno, D. R., et al. 2010, AJ, 139, 1542
- Oey & Clarke (1998) Oey, M. S., & Clarke, C. J. 1998, AJ, 115, 1543
- Oey & Kennicutt (1997) Oey, M. S., & Kennicutt, Jr., R. C. 1997, MNRAS, 291, 827
- Peng et al. (2000) Peng, B., Kraus, A., Krichbaum, T. P., & Witzel, A. 2000, A&AS, 145, 1
- Pestalozzi et al. (2005) Pestalozzi, M. R., Minier, V., & Booth, R. S. 2005, A&A, 432, 737
- Piddington (1951) Piddington, J. H. 1951, MNRAS, 111, 45
- Quireza et al. (2006a) Quireza, C., Rood, R. T., Balser, D. S., & Bania, T. M. 2006a, ApJS, 165, 338
- Quireza et al. (2006b) Quireza, C., Rood, R. T., Bania, T. M., Balser, D. S., & Maciel, W. J. 2006b, ApJ, 653, 1226
- Rathborne et al. (2010) Rathborne, J. M., Jackson, J. M., Chambers, E. T., Stojimirovic, I., Simon, R., Shipman, R., & Frieswijk, W. 2010, ApJ, 715, 310
- Reifenstein et al. (1970) Reifenstein, E. C., Wilson, T. L., Burke, B. F., Mezger, P. G., & Altenhoff, W. J. 1970, A&A, 4, 357
- Rieke et al. (2004) Rieke, G. H., et al. 2004, ApJS, 154, 25
- Rodgers et al. (1960) Rodgers, A. W., Campbell, C. T., & Whiteoak, J. B. 1960, MNRAS, 121, 103
- Rubin (1968) Rubin, R. H. 1968, ApJ, 154, 391
- Scheuer & Ryle (1953) Scheuer, P. A. G., & Ryle, M. 1953, MNRAS, 113, 3
- Schutte et al. (1993) Schutte, A. J., van der Walt, D. J., Gaylard, M. J., & MacLeod, G. C. 1993, MNRAS, 261, 783
- Sewilo et al. (2004) Sewilo, M., Churchwell, E., Kurtz, S., Goss, W. M., & Hofner, P. 2004, ApJ, 605, 285
- Sharpless (1953) Sharpless, S. 1953, ApJ, 118, 362
- Sharpless (1959) —. 1959, ApJS, 4, 257
- Shaver et al. (1983) Shaver, P. A., McGee, R. X., Newton, L. M., Danks, A. C., & Pottasch, S. R. 1983, MNRAS, 204, 53
- Shaver et al. (1979) Shaver, P. A., McGee, R. X., & Pottasch, S. R. 1979, Nature, 280, 476
- Simon et al. (2006) Simon, R., Rathborne, J. M., Shah, R. Y., Jackson, J. M., & Chambers, E. T. 2006, ApJ, 653, 1325
- Slysh et al. (1999) Slysh, V. I., Val’tts, I. E., Kalenskii, S. V., Voronkov, M. A., Palagi, F., Tofani, G., & Catarzi, M. 1999, A&AS, 134, 115
- Smith & Kennicutt (1989) Smith, T. R., & Kennicutt, Jr., R. C. 1989, PASP, 101, 649
- Stephenson (1992) Stephenson, C. B. 1992, AJ, 103, 263
- Sternberg et al. (2003) Sternberg, A., Hoffmann, T. L., & Pauldrach, A. W. A. 2003, ApJ, 599, 1333
- Stil et al. (2006) Stil, J. M., et al. 2006, AJ, 132, 1158
- Szymczak et al. (2000) Szymczak, M., Hrynek, G., & Kus, A. J. 2000, A&AS, 143, 269
- Szymczak et al. (2002) Szymczak, M., Kus, A. J., Hrynek, G., Kěpa, A., & Pazderski, E. 2002, A&A, 392, 277
- Urquhart et al. (2009) Urquhart, J. S., et al. 2009, A&A, 501, 539
- van der Walt et al. (1995) van der Walt, D. J., Gaylard, M. J., & MacLeod, G. C. 1995, A&AS, 110, 81
- Walsh et al. (1998) Walsh, A. J., Burton, M. G., Hyland, A. R., & Robinson, G. 1998, MNRAS, 301, 640
- Walsh et al. (1997) Walsh, A. J., Hyland, A. R., Robinson, G., & Burton, M. G. 1997, MNRAS, 291, 261
- Watson et al. (2003) Watson, C., Araya, E., Sewilo, M., Churchwell, E., Hofner, P., & Kurtz, S. 2003, ApJ, 587, 714
- Westerhout (1958a) Westerhout, G. 1958a, Bull. Astron. Inst. Netherlands, 14, 215
- Westerhout (1958b) —. 1958b, Bull. Astron. Inst. Netherlands, 14, 215
- Wilson et al. (1970) Wilson, T. L., Mezger, P. G., Gardner, F. F., & Milne, D. K. 1970, A&A, 6, 364
- Wink et al. (1983) Wink, J. E., Wilson, T. L., & Bieging, J. H. 1983, A&A, 127, 211
- Wood & Churchwell (1989a) Wood, D. O. S., & Churchwell, E. 1989a, ApJ, 340, 265
- Wood & Churchwell (1989b) —. 1989b, ApJS, 69, 831
- Zavagno et al. (2007) Zavagno, A., Pomarès, M., Deharveng, L., Hosokawa, T., Russeil, D., & Caplan, J. 2007, A&A, 472, 835
| Name | RA(J2000) | Dec.(J2000) | CH3OHaaMethanol maser velocities are from: Caswell et al. (1995); Ellingsen et al. (1996); Gaylard & MacLeod (1993); MacLeod & Gaylard (1992); Menten (1991); Schutte et al. (1993); Slysh et al. (1999); Szymczak et al. (2000, 2002); van der Walt et al. (1995) and Walsh et al. (1997, 1998). | CS | MorphologybbClassification of source structure as seen in Spitzer GLIMPSE 8µm emission: B – Bubble: 8 µm emission surrounding 24 µm and radio continuum emission BB – Bipolar Bubble: two bubbles connected by a region of strong IR and radio continuum emission PB – Partial Bubble: similar to “B” but not complete IB – Irregular Bubble: similar to “B” but with less well-defined structure C – Compact: resolved 8 µm emission with no hole in the center PS – Point Source: unresolved 8 µm emission I – Irregular: complex morphology not easily classified ND – Not Detected: source has no 8 µm emission We list in parenthesis the bubble identification name for sources in the Churchwell et al. (2006, 2007) IR bubble catalogs (see §4.5). | NoteccNotes on individual sources (see § 4.4). PN? – Possible Planetary Nebula (see also § 5.5). | ||
|---|---|---|---|---|---|---|---|---|
| deg. | deg. | hh:mm:ss.s | dd:mm:ss | |||||
| G000.3820.017 | 17:46:27.6 | 28:36:04 | C | |||||
| G000.7290.103 | 17:47:45.0 | 28:22:00 | I | |||||
| G000.8380.189 | 17:46:52.1 | 28:07:20 | PB | |||||
| G001.3240.104 | 17:48:20.2 | 27:45:02 | PB | |||||
| G001.3300.088 | 17:48:24.9 | 27:45:12 | B | |||||
| G001.3300.150 | 17:48:10.2 | 27:43:18 | IB (CN25) | |||||
| G001.4880.199 | 17:49:53.6 | 27:45:54 | C | |||||
| G002.0090.680 | 17:52:57.8 | 27:33:49 | B (CN28) | |||||
| G002.4040.068 | 17:50:58.5 | 26:50:32 | C | |||||
| G002.4180.611 | 17:53:37.8 | 27:10:34 | I |
Note. — Table The Green Bank Telescope H II Region Discovery Survey II. The Source Catalog is available in its entirety in the electronic edition of the Astrophysical Journal Supplement Series. A portion is shown here for guidance regarding its form and content.
Note. — Table 2 GBT HRDS Hydrogen Recombination Line Parameters is available in its entirety in the electronic edition of the Astrophysical Journal Supplement Series. A portion is shown here for guidance regarding its form and content.
Note. — Table The Green Bank Telescope H II Region Discovery Survey II. The Source Catalog is available in its entirety in the electronic edition of the Astrophysical Journal Supplement Series. A portion is shown here for guidance regarding its form and content.