SEJONG OPEN CLUSTER SURVEY. I. NGC 2353
Abstract
CCD photometry of NGC 2353 is obtained as part of the “Sejong Open cluster Survey” (SOS). Using the photometric membership criteria we selelct probable members of the cluster. We derive the reddening and distance to the cluster, i.e. mag and kpc, respectively. We find that the projected distribution of the probable members on the sky is elliptical in shape rather than circular. The age of the cluster is estimated to be log(age)=8.1 0.1, older than what was found in previous studies. The minimum value of binary fraction is estimated to be about 48 5 percent from a Gaussian function fit to the distribution of the distance moduli of the photometric members. Finally, we also obtain the luminosity function and the initial mass function (IMF). The slope of the IMF is .
1 INTRODUCTION
NGC 2353, known as a young open cluster, is located in the easthern edge of the Canis Majoris OB1 association (hereafter CMa OB1). In spite of its proximity only a few studies were devoted to the cluster, because most of the research up to date focused on the star-forming regions in the CMa OB1.
Hoag et al. (1961) observed 70 galactic clusters in the system. NGC 2353 is one of their targets. Hoag et al. (1965) derived the distance moduli of open clusters using the zero-age main sequence (ZAMS) relation, the photometric equivalent width, and spectral classifications. They estimated the distance modulus of NGC 2353 to be 10.4 mag. FitzGerald et al. (1990) (hereafter FHR90) studied NGC 2353 using their photoelectric photometry of 46 stars. They derived the distance modulus (), the foreground reddening (), and the binary fraction () of the cluster.
An interesting aspect of NGC 2353 is whether or not it is physically connected with CMa OB1. Ambartsumian (1949) firstly suggested this hypothesis. Subsequently Ruprecht (1966) proposed that NGC 2353 may be the nucleus of the CMa OB1, because of their similar distance ( = 1.3 kpc; Becker 1963). Later, Clariá (1974) compared the age of CMa OB1 (3 Myr) with that of NGC 2353 (12.6 Myr – Hoag et al. 1961) and suggested that the first star formation in the region was ignited at NGC 2353, and then propagated to the present center of CMa OB1. On the other hand, FHR90 argued that they could not find any physical relationship between NGC 2353 and CMa OB1 from the derived age of the cluster (76 Myr). Finally, Eggen (1978) suggested that NGC 2353 may not be a physical group, by analyzing the and H photometry of each group.
We are running an open cluster survey program, i.e. the “Sejong Open cluster Survey” (SOS). The main aim of the project is to provide homogeneous photometric data (see Mermilliod & Paunzen 2003) in the Johnson-Cousins’ system, which is tightly matched to the SAAO standard system (Menzies et al. 1989,1991; Kilkenny et al. 1998; see also Lim et al. 2009). The collected homogeneous data will be used to revise and update the spiral arm structure of the Galaxy as well as the star formation history in the Galaxy. The data can also be used to test observationally the stellar evolution theory. The project overview and calibrations for data analysis purposes will be presented elsewhere (Lim et al. 2011). In this paper we describe the first results from the SOS.
NGC 2353 is chosen as a target of the SOS because the cluster is relatively close and rich. However, no CCD photometry has been performed so far. In addition, there is a problem related with its age – the age of NGC 2353 in the open cluster data base WEBDA* * * http://www.univie.ac.at/webda/ is about yrs, but an evolved O type star HD 55879 (Sp: O9.5 II-III) is located near the center of the cluster. The relationship between NGC 2353 and CMa OB1 is also still an open issue, to be clarified from this study. In Section 2, we present the observations and comparison with previous photometry. We provide CCD photometry for the stars in the cluster up to mag. In Section 3, we present photometric diagrams and several fundamental parameters derived from them. Luminosity and mass functions are presented in Section 4. Finally, we discuss the binary fraction and background population in Section 5. We highlight our conclusions are in Section 6.

2 OBSERVATIONS
The observation of NGC 2353 was made on 2007 January 25 with the AZT-22 1.5m telescope (f/7.74) at Maidanak Astronomical Observatory in Uzbekistan. All the images were taken with a Fairchild CCD (Im et al. 2010) and standard Bessell filters (Bessell 1990). The pixel scale is , and therefore a side of the CCD corresponds to . Two sets of exposure times for each band for a total of 8 frames were taken in the observation – 60s and 3s in , 180s and 5s in , 300s and 7s in , 600s and 15s in . We present the finding chart for the stars brighter than mag in Fig. 1. Photometric data for five stars saturated in our images are taken from WEBDA, and averaged.
The removal of instrumental artifacts is performed with the IRAF/CCDRED package, as described in Lim et al. (2008). PSF photometry was performed for all the stars, using IRAF/DAOPHOT. Many equatorial standard stars in Menzies et al. (1991) were observed on the same night in a wide range of air masses to derive the atmospheric extinction coefficients and the photometric zero points. We present the coefficients and the photometric zero points in Table 2. The instrumental magnitudes were converted into the standard system following the procedure described in Lim et al. (2009).
| ID | ||||
|---|---|---|---|---|
| HD 55879 | 6.012 | -0.171 | -0.991 | 7 |
| HD 55930 | 9.159 | -0.014 | -0.291 | 3 |
| HD 56009 | 9.450 | 0.977 | 0.698 | 3 |
| HD 55901 | 8.826 | -0.036 | -0.530 | 3 |
| BD-10 1935 | 9.380 | 0.005 | -0.330 | 2 |
| Filter | Color | |||
|---|---|---|---|---|
| - | ||||
| - | ||||
| - | ||||
In order to check the consistency of our photometry with results from previous studies, we present the differences and the standard deviation in Table 3. Since the published photoelectric data contain mostly bright stars, only a small number of stars are used in the calculation. We use the symbol to denote the difference between previous photometry and our data; represents the number of stars included in the computation, while denotes the number of stars excluded above the level. Our photometry shows good agreement with previous photometry in and . Although there is a slight systematic difference of mag between FHR90 and our photometry in , the difference is not signigicant. It is hard to compare with Hoag et al. (1961), because of the small number of stars in common. However, the difference is also acceptable since the standard deviation indicates that the dispersion is not systematic, and our data follow rather well the intrinsic color relation (see Fig. 3 or Sung & Bessell 1999, hereafter SB99). Photometric data are available at http://arcsec.sejong.ac.kr/ sungh/paper.html.
3 PHOTOMETRIC DIAGRAMS AND FUNDAMENTAL PARAMETERS
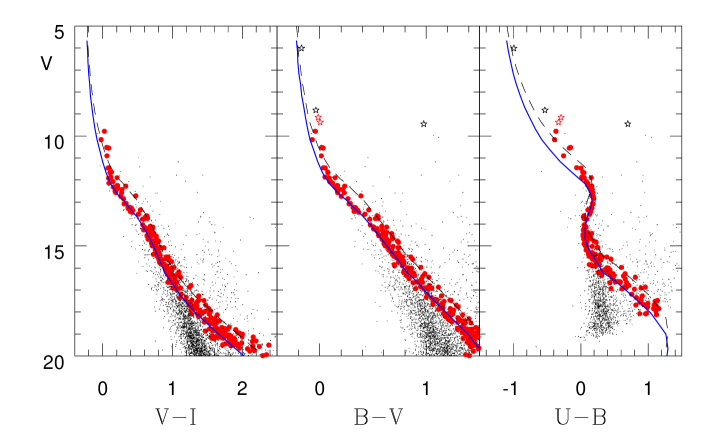
We present three color-magnitude diagrams (CMDs) in Fig. 2. The well-defined main sequence can be clearly recognized, although a number of background stars in the line of sight are superimposed. Some of them are main sequence (MS) turn-off stars in the Perseus arm, passing through the MS band of NGC 2353. Several foreground stars, and probable members of CMa OB1, seem to populate the brighter part of the CMD.
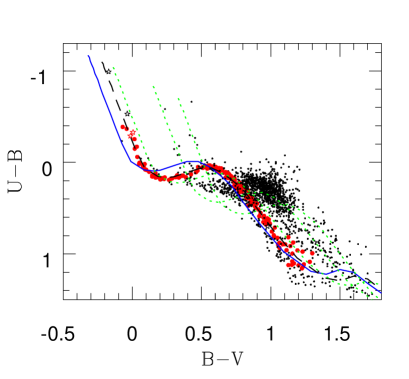
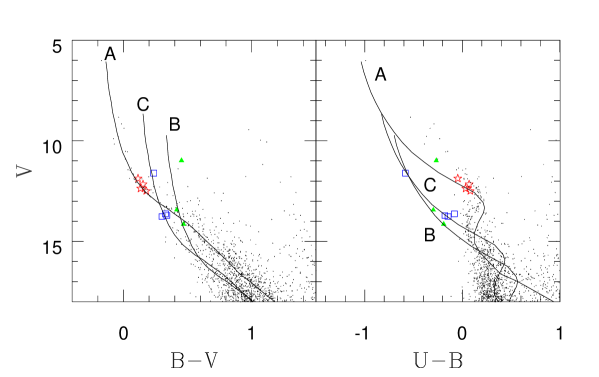
In the color-color diagram of Fig. 3, there are 4 groups of early-type stars with different reddening. This fact indicates that several young populations exist in the line of sight. FHR90 already reported two groups, i.e. Group A and B. According to their study, stars which belong to Group A are more reddened than those of NGC 2353 and may be related to CMa OB1. On the opposite, highly reddened Group B stars may be early-type stars distributed along the line of sight to the outer disks of the Galaxy. We will discuss these background populations in detail in Section 5.
3.1 REDDENING LAW
In general, the interstellar reddening is determined by comparing the observed and colors with the intrinsic color relation of early-type stars. We use those of SB99 in the reddening determination. The reddening slope is assumed to be . In order to select early-type members used for determining of the reddening, we adopt the following criteria; (1) , (2) , (3) mag. We estimate the mean interstellar reddening to be (s.d.), using 13 late B type members selected with the previous criteria. Our result is in good agreement with Johnson et al. (1961) and FHR90 (i.e. within the standard deviation). If we adopt the ratio of the total to selective extinction to be , the total extinction in is about mag.
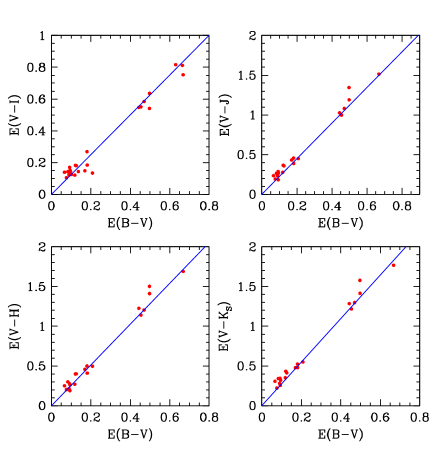
In order to check the reddening law, we plot the color excess ratios in Fig. 4 using both our photometric data and the 2MASS near-IR data (Skrutski et al. 2006). The normal values of the color excess ratio from Guetter & Vrba (1989) are , , , . We transform CCD coordinates () into the celestial coordinates (, ) for the stars matched with the object in the 2MASS catalogue within . The symbol is used to indicate the relative position from the adopted cluster center. The early type stars in the observed region show a wide range of reddening. All groups follow the standard reddening law in (upper left panel). Hence, our photometry is well tied to the standard system and therefore the values of are well determined. The color excess ratio of (lower left panel) also shows a good agreement with the standard relation. The small systematic deviation in and might be caused by an error of about 0.03 mag in the photometric zero points in the 2MASS and bands. From Fig. 4 we conclude that the reddening law in the direction of NGC 2353 is normal ().
3.2 MEMBERSHIP SELECTION AND DISTANCE MODULUS
Membership selection is crucial in the study of open clusters. Most of the open clusters are located in the Galactic plane, therefore we expect significant foreground and background field contamination. Proper motion study is essential for membership selection, and provides a valuable independent information. Unfortunately membership selection from proper motion study is inaccurate, because many photographic plates taken at different epochs spread over a few decades or up to a century are required to achieve good accuracy. In addition, these photographic plates are very rare and the photometric depth is very shallow due to low sensitivity and small dynamic range of the old photographic plates.
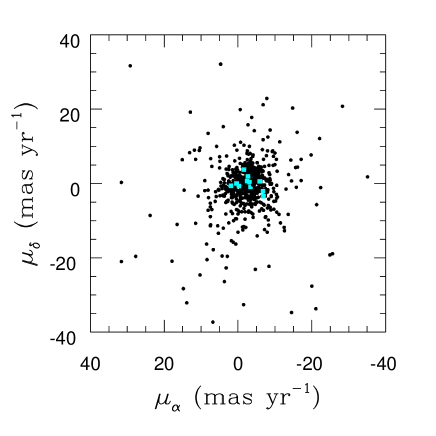
We select proper motion members of NGC 2353 using proper motion data from the Tycho 2 catalogue (Hg et al. 2000). The proper motion of stars in the field of NGC 2353 is shown in Fig. 5. Unfortunately, the mean proper motion of the suspected members is very similar to that of the field stars at almost the same distance (members of the CMa OB1 association). Therefore, it is not feasible to select proper motion members from the Tycho catalogue. If we used the proper motion data from UCAC3 (Zacharias et al. 2010), the result would be very similar.
SB99 devised photometric membership criteria which use multicolor photometry (see also Kook et al. 2010). The distance moduli of the stars in a cluster derived from different color indices should be consistent. However the difference in abundance (SB99) or in the level of chromospheric activity (Sung et al. 2002 – SBLL02) makes the MS band bluer, especially in the () relation. For these cases, we should modify the ZAMS relation before applying the membership criteria.
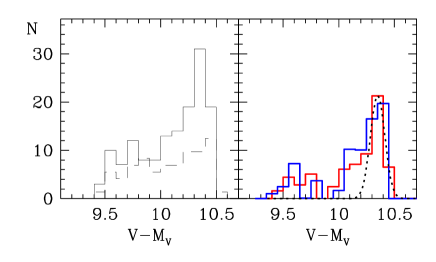
Luckily, for the case of NGC 2353 we do not find signatures of non-solar abundance. We calculate the average value and the difference of the distance moduli for individual stars. We select members of NGC 2353 if (1) the average value of the distance modulus is between and , and (2) if the difference in distance moduli is less than where is the width of the Gaussian fit. We plot the distance modulus distribution of the photometric members in Fig. 6. The bin size is 0.1 mag. Stars with 13 – 18 are used in the histrogram to avoid the effects of evolution.
We statistically subtract the expected number of field stars within the cluster area which meet the photometric membership criteria (see the left panel of Fig. 6). The residual histogram (red) is plotted in the right panel. We also superimposed an histogram (blue) shifted by 0.5 mag to minimize binning effects. A distance modulus of mag is derived from a Gaussian function fit to the distribution. This value is in good agreement with the distance modulus determined by FHR90 or Hoag et al. (1961).
The criteria (1) and (2) are not applied to several evolved stars (). Although the photometric membership criteria constrain well the members, many field stars may also be included if the differences in reddening and distance are very similar to those of the cluster members. In order to eliminate these interlopers, we use another criterion - the () diagram in Fig. 3. We only select the stars within from the reddened color-color relation shown in Fig. 3. The quantity = represents the total error in the calculation.

FHR90 counted the number of stars within a given ring by assuming NGC 2353 to have circular shape, and then determined the diameter of the core ( ) and of the halo (). They confirmed that the number of members derived from the photometric criteria and that from the statistical method is consistent. Fig. 7 shows the distribution of bright photometric members ( mag). Clearly their distribution is elongated like an ellipse. The elliptical shape can be used to constrain the member distribution of NGC 2353. Several stars outside the ellipse also meet the photometric membership criteria. However, it is very difficult to discriminate between members and field stars from the photometry alone, if the photometric characteristics of the field stars are very similar to those of the cluster stars.
Three bright stars (HD 55879, 56009 and 55901) are excluded from the member list. Since HD 55879 (its spectral type is O9.5II-III, – Walborn 1972) is about 4 magnitude brighter in than the MS turn-off ( mag) of NGC 2353, the star may be a member of CMa OB1 association. The star HD 55901 is not only slightly brighter than the MS turn-off, but also bluer in . Although the star may be a blue straggler, we cannot exclude the possibility that it may be a member of the CMa OB1 association. A giant star HD 56009 is slightly fainter than the brightness predicted from the Padua theoretical stellar evolution models in the observational H-R diagrams in Fig. 8. The membership of HD 56009 and HD 55901 should be checked by other independent methods, such as radial velocity measurements.

3.3 AGE
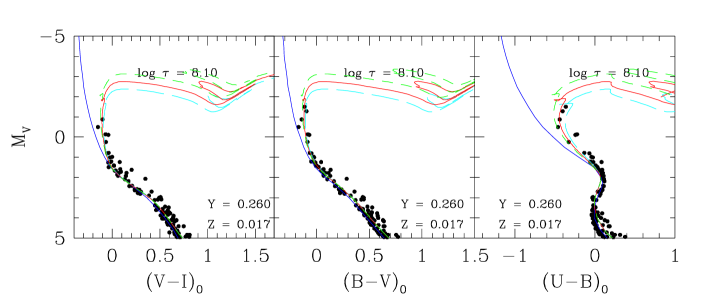
The age of a stellar system is generally estimated from the comparison between the observed CMDs and the theoretical isochrones. Fig. 8 shows the observational H-R diagrams of NGC 2353. Solid lines are isochrones from the Padua group (Bertelli et al. 2008, 2009) with solar abundance () and the convective overshooting parameter 0.5. Despite a few giants are found in the observed field, those are too faint to be members of NGC 2353. The absence of giants makes it difficult to constrain the age accurately in the (), or in the () plane. Fortunately, unlike NGC 2516 (SBLL02) and NGC 2168 (SB99) the MS turn-off of NGC 2353 is clearly seen in (). The isochrone of age log fits well to the observed sequence in NGC 2353. Although NGC 2353 is slightly younger than NGC 2516, NGC 2353, NGC 2168 and NGC 2516 can be treated as the same age group.
A physical connection between NGC 2353 and the CMa OB1 has been debated by several authors, as mentioned in Section 1. FHR90 provided a clue for the large difference in age between both groups, and suggested that NGC 2353 is not originated from the same cloud. According to Leisawitz et al. (1989), the natal cloud begins to undergo gas depletion when the age of the cluster is about 10 Myr. The hypothesis that NGC 2353 is associated with the cloud surrounding the CMa OB1 (Ambartsumian 1949;Clariá 1974; Ruprecht 1966) cannot explain the large difference in age. In this respect, our result supports the claim of FHR90.
4 LUMINOSITY AND MASS FUNCTIONS
We derive the luminosity function (LF) of NGC 2353 using the photometric members. The fainter limit in the LF strongly depends on the completeness in a given range of magnitude. In the region around NGC 2353 crowding effect is not too severe to miss a number of faint stars. Although several faint stars are affected by the wing or the spike of bright stars, the number of those stars is not significant. In order to estimate the completeness limit of our photometry, we check the turnover points in the distribution of magnitude for a given filter. The completeness limit in and is 19.5 mag, 18.5 mag, and 17.5 mag, respectively. Our photometry is nearly complete down to 18.5 mag in , or equivalently 7.8 mag in .
The number of stars in each magnitude bin is counted, and then divided by the area of NGC 2353. The bin size is 1 mag. We compare the LF of NGC 2353 with that of NGC 2168 and NGC 2516 in Fig. 9. Since the LFs of NGC 2168 and NGC 2516 are also normalized by their area, the LF represents the surface number density, i.e. Fig. 9 represents the surface density of the member stars for a given magnitude interval. The number of stars in NGC 2168 per unit area is the highest in the whole range of magnitude, while that of NGC 2353 is the lowest. This is simply due to the spatial coverage of the observed region. For NGC 2168, SB99 observed only the central of the cluster (diameter ). For NGC 2353, our observed region covers nearly the whole area of the cluster. There is a dip near in the LF of NGC 2353 (i.e. there are two bumps in the LF at = 1.5 and at 4). The same trend can also be seen in Fig. 8, for stars near or , and , which corresponds to late A or early F stars, are obviously underpopulated. FHR90 found a similar gap at slightly fainter absolute magnitude, and suggested that the paucity of A-F type stars may be related to the spectral peculiarities found from spectra of several stars in the cluster.
The LF of NGC 2353 can be transformed into the mass function (MF) using the relation between LF and MF, i.e. (log ) dlog d. In the calculation of MF, the mass-luminosity relation from the appropriate isochrone (log – Bertelli et al. 2008, 2009) is required. In deriving the slope of the MF, the last two bins are excluded because of incompleteness of the photometry. The slope is determined with the linear least square method. This value is in good agreement with that of NGC 2516 ( – SBLL02), the solar neighborhood ( – Salpeter 1955), and Pleiades and Praecepe ( – Rabound & Mermilliod 1998a, 1998b), but it is slightly steeper than that of NGC 2168 ( – SB99). Sung et al. (1999) found a steep slope for the MF of M11 (). The slopes of MF for the same age group seem to be similar, within errors. However, there may be differences between the central outer regions due to the effect of mass segregation (Sung et al. 1999; Rabound & Mermilliod 1998a,1998b).
5 Discussion
5.1 Binary fraction
The binary fraction and the mass ratio distribution among stars in a cluster are crucial for understanding the star formation processes. In addition, binaries play an important role in the dynamical evolution of a cluster. In order to estimate the minimum value of binary fraction in NGC 2353, we follow the same procedure as in SB99. Among 66.4 statistically corrected cluster stars ( 13–18 mag) in Fig. 6, the number of stars encompassed by the Gaussian fit is 34.5. The number of binary stars which cannot be considered for a Gaussian function fit is thus 31.9. The error of binary fraction can be estimated from the standard deviation of the residuals in the last four bins. We found a minimum binary fraction of 48 in NGC 2353. The binary fraction obtained is larger than that of FHR90 (33%) for the cluster. SB99 found a minimum binary fraction of 35 for NGC 2168, and SBLL02 found for NGC 2516. Our result for NGC 2353 is larger than that of other clusters, while it is rather similar to the values of 48% and 43% in the center of the Pleiades and Praecepe (Rabound & Mermilliod 1998a,1998b)
According to Mermilliod et al. (1992) and Perryman et al. (1998), a number of spectroscopic binaries can exist near the ZAMS without a brightening effect, and therefore our estimate may be a minimum value. Despite of a relatively low surface density, the binary fraction in this study is too high to be an intrinsic feature, if compared with that of other clusters. Foreground stars which cannot be excluded by the photometric membership criteria may be the source of high value of binary fraction. However, as mentioned in Section 3.2, it is impossible to exclude all the field interlopers from the photometry alone, and therefore the binary fraction obtained here cannot be a definite value.
5.2 BACKGROUND GROUPS
The identification of foreground and background groups of young blue stars is important in order to recognize the radial distribution of stars in the Galaxy. However, these studies are limited due to the small number of early-type stars and to the difficulties in the reddening estimate of faint stars. As shown in Section 3, three background groups except members of NGC 2353 are found in the (, ) diagram. Using the reddening of each group is determined, and then the distance moduli are estimated by shifting the reddened ZAMS to the postion of each group in the CMDs. We present the results in Table 4 and in Fig. 10.
The distance to the less reddened group is very similar to that of NGC 2353. This group corresponds to Group A of FHR90, although there is a slight difference in the reddening and distance obtained here. Therefore stars belonging to Group A are the members of the CMa OB1 association. Two highly reddened groups may be related to B type stars distributed in the outer disks in and beyond the Perseus arm as mentioned by FHR90. Since the B-type stars in disks can exist during a couple of crossing times at almost the same place where the stars were formed, their current location indicates that the star forming region in the disks and these early type stars can also be an important tracer of the spiral arm structure of the Galaxy.
| FHR90 | |||
|---|---|---|---|
| Group A | (1.2 kpc) | A | |
| Group B | (3.5 kpc) | B | |
| Group C | (2.7 kpc) |
6 Conclusion
We have performed CCD photometry of NGC 2353 for the first time, and presented in the first paper of the SOS project. We estimated a reddening of , the cluster distance of kpc, and the cluster age of 120 million year. Both reddening and distance are in good agreement with previous studies, while the estimated age is slightly older than that of FHR90. From our estimate of the age of NGC 2353, we support the idea that there is no physical connection between NGC 2353 and the CMa OB1. We derived the mass and luminosity functions of the cluster. We also estimated the binary fraction of and found three background groups by identifying the bright B stars along the line of sight.
ACKNOWLEDGMENTS We express deep thanks to the anonymous referee for many useful comments and suggestions. This work is supported by the Astrophysical Research Center for the Structure and Evolution for the Cosmos (ARCSEC′′) at Sejong University.
References
- Ambartsumian (1949) Ambartsumian, V. A. 1949, Preliminary Data on O-Associations in the Galaxy, Dokl. Akad. Nauk, URSS, 68, 21
- Becker (1963) Becker, W. 1963, Die räumliche Verteilung von 156 galaktischen Sternhaufen in Abhängigkeit von ihrem Alter. Mit 7 Textabbildungen, Z. Astrophys. 57, 117
- Bertelli et al. (2008) Bertelli, G., Girardi, L., Marigo, P., & Nasi, E. 2008, Scaled solar tracks and isochrones in a large region of the Z-Y plane. I. From the ZAMS to the TP-AGB end for – M⊙ stars, A&A, 484, 815
- Bertelli et al. (2009) Bertelli, G., Nasi, E., Girardi, L., & Marigo, P. 2009, Scaled solar tracks and isochrones in a large region of the Z-Y plane. II. From to M⊙ stars, A&A, 508, 355
- Bessell (1990) Bessell, M. S. 1990, passbands, PASP, 102,1181
- Clariá (1974) Claria J. J. 1974, A Study of the Stellar Association Canis Major OB 1, A&A, 37, 229
- Skrutski et al. (2006) Skrutski et al. 2006, The Two Micron All Sky Survey (2MASS), AJ, 131, 1163
- Eggen (1978) Eggen, O. J., 1978, Canis Major OB1, Canis Major R1, NGC 2353, and W Canis Majoris, PASP, 90, 436
- FitzGerald et al. (1990) Fitzgelard, M. P., Harris, G. L., & Reed, B. C. 1990, The Moderately Young Open Cluster NGC 2353* PASP, 102, 865
- Guetter & Vrba (1989) Guetter, H. H., & Vrba, F. J. 1989, Reddening and polarimetric studies toward IC 1805, AJ, 98, 611
- Hoag et al. (1961) Hoag, A. A., Johnson, H. L., Iriarte, B., Hartmann, R. I., Hallam, K. L., & Sharpless, S. 1961, Photometry of Stars in Galactic Cluster Fields, Publ. US Naval Obs., 17, 345
- Hoag et al. (1965) Hoag, A. A., & Applequist, N. L. 1965, Distance Moduli of Open Clusters, ApJS, 12, 215 1961, Photometry of Stars in Galactic Cluster Fields, Publ. US Naval Obs., 17, 345
- Hg et al. (2000) Hg, E., Fabricius, C., Makarov, V. V., Urban, S., Corbin, T., Wycoff, G., Bastian, U., Schwekendiek, P., & Wicenec, A. 2000, The Tycho-2 Catalogue of the 2.5 million brightest stars, A&A, 355, 27,
- Im et al. (2010) Im, M., Ko, J., Cho, Y., Choi, C., Jeon, Y., Lee, I., & Ibrahimov, M. 2010, Seoul National University 4k 4k Camera (SNUCAM) for Maidanak Observatory, JKAS, 43, 75
- Johnson & Morgan (1953) Johnson, H. L., & Morgan, W. W. 1953, Fundermental Stellar Photometry for Standards of Spectral Type on the Revised System of the Yerkes Spectral ATLAS*, ApJ, 117, 313
- Johnson et al. (1961) Johnson, H. L., Hoag, A. A., Iriarte, B., Mitchell, R. I., & Hallam, K. L. 1961, Galactic Clusters as Indicators of Stellar Evolution and Galactic Structure, Lowell, Obs. Bull., 5, 133
- Kilkenny et al. (1998) Kilkenny, D., Van Wyk, F., Roberts, G., Marang, F., & Cooper, D. 1998, Supplementary southern standards for photometry, MNRAS, 294, 93
- King (1978) King, D.S. 1978, Proper Motions in the Region of the Galactic Cluster NGC 2516, J. Proc. R. Soc. New South Wales, 111, 61k
- Kook et al. (2010) Kook, S.-H., Sung, H., & Bessell, M. S. 2010, CCD Photometry of the Open Clusters NGC 4609 and HOGG 15, JKAS, 43, 141
- Leisawitz et al. (1989) Leisawitz, D., Bash, F. N., & Thaddeus, P. 1989, A CO Survey of Regions Around 34 Open Clusters, ApJS, 70, 731
- Lim et al. (2008) Lim, B., Sung, H., Karimov, R., & Ibrahimov, M. 2008, Characteristics of The Fairchild 486 CCD at Maidanak Astronomical Observatory in Uzbekistan, PKAS, 23, 1
- Lim et al. (2009) Lim, B., Sung, H., Bessell, M. S., Karimov, R., & Ibrahimov, M. 2009, CCD Photometry of Standard Stars at Maidanak Astronomical Observatory in Uzbekistan: Transformations and Comparisons, JKAS, 42, 161
- Lim et al. (2011) Lim, B. et al. 2011, in preparation
- McNamara & Sekiguchi (1986a) McNamara, B., & Sekiguchi, K. 1986a, A proper-motion analysis of the cluster M35, AJ, 91, 557
- Menzies et al. (1989) Menzies, J. W., Cousins, A. W., Banfield, R. M., & Laing, J. D. 1989, standard stars in the E- and F-regions and in the Magellanic Cloud - a reviced catalogue, SAAOC, 13, 1
- Menzies et al. (1991) Menzies, J. W., Marang, F., Laing, J. D., Coulson, I. M., & Engelbrecht, C. A. 1991, photometry of equatorial standard stars. A direct comparison between the northern and southern systems, MNRAS, 248, 642
- Mermilliod et al. (1992) Mermilliod, J.-C., Rosvick, J. M., Duquennoy, A., & Mayor, M. 1992, Investigation of the Pleiades cluster II. Binary stars in the F5-K0 spectral region, A&A, 265, 513M
- Mermilliod & Paunzen (2003) Mermilliod, J.-C., & Paunzen, E. 2003, Analysing the database for stars in open clusters I. General methods and description of the data, A&A, 410, 511
- Perryman et al. (1998) Perryman, M. A. C. et al. 1998, The Hyades: distance, structure, dynamics, and age, A&A, 331, 81
- Rabound & Mermilliod (1998a) Rabound, D., & Mermilliod, J.-C. 1998, Investigation of the Pleiades cluster IV. The radial sturcture, A&A, 329, 101
- Rabound & Mermilliod (1998b) Rabound, D., & Mermilliod, J.-C. 1998, Evolution of mass segregation in open clusters: some observational evidences, A&A, 333, 897
- Salpeter (1955) Salpeter, E. E. 1955,The Luminosity Function and Stellar Evolution, ApJ, 121, 161
- Sung et al. (1999) Sung, H., Bessell, M. S. Lee, H.-W., Kang, Y. H., & Lee, S.-W. 1999, CCD photometry of M11 - II. New photometry and surface density profiles, MNRAS, 310, 982S
- Sung & Bessell (1999) Sung, H., & Bessell, M. S. 1999, CCD photometry of M35 (NGC 2168), MNRAS, 306, 361
- Sung et al. (2002) Sung, H., Bessell, M. S., Lee, B. W., & Lee S. G. 2002, The Open Cluster NGC 2516. I. Optical Photometry, AJ, 123, 290
- Walborn (1972) Walborn, N. R. 1972, Spectral classification of OB stars in both hemisphere and the absolute-magnitude calibration, AJ, 77, 312
- Ruprecht (1966) Ruprecht, J. 1966, IAU trans. 12 B, 348
- Zacharias et al. (2010) Zacharias, T. et al. 2010, The Third US Naval Observatory CCD Astrograph Catalog (UCAC3), AJ, 139, 2184