11email: rcbruens@astro.uni-bonn.de, pavel@astro.uni-bonn.de 22institutetext: Departamento de Astronomía, Universidad de Concepción, Casilla 160-C, Concepción, Chile
22email: mfellhauer@astro-udec.cl, passmann@astro-udec.cl 33institutetext: Deutsches Zentrum für Luft- und Raumfahrt, Königswinterer Str. 522-524, D-53227 Bonn, Germany
33email: manuel.metz@dlr.de
A parametric study on the formation of extended star clusters and ultra-compact dwarf galaxies
Abstract
Context. In the last decade, very extended old stellar clusters with masses in the range from a few to M☉ have been found in various types of galaxies in different environments. Objects with masses comparable to normal globular clusters (GCs) are called extended clusters (ECs), while objects with masses in the dwarf galaxy regime are called ultra-compact dwarf galaxies (UCDs). In heavily interacting galaxies star clusters tend to form in larger conglomerations called star cluster complexes (CCs). The individual star clusters in a CC can merge and form a variety of spheroidal stellar objects.
Aims. The parametric study aims to analyze how the structural parameters of the final merger objects correlate with the underlying CC parameter space.
Methods. In this work we systematically scan a suitable parameter space for CCs and perform numerical simulations to study their further fate. The varied sizes and masses of the CCs cover a matrix of 5x6 values with CC Plummer radii between 10 - 160 pc and CC masses between - M☉, which are consistent with observed CC parameters. The CCs of the parametric study are on orbits with galactocentric distances between 20 kpc and 60 kpc. In addition, we studied also the evolution of CCs on a circular orbit at a galactocentric distance of 60 kpc to verify that also extremely extended ECs and UCDs can be explained by our formation scenario.
Results. All 54 simulations end up with stable merger objects, wherein 26 to 97% of the initial CC mass is bound. The objects show a general trend of increasing effective radii with increasing mass. Despite the large range of input Plummer radii of the CCs (10 to 160 pc) the effective radii of the merger objects are constrained to values between 10 and 20 pc at the low mass end and to values between 15 and 55 pc at the high mass end. The structural parameters of the models are comparable to those of the observed ECs and UCDs. The results of the circular orbits demonstrate that even very extended objects like the M31 ECs found by Huxor in 2005 and the very extended ( 80 pc), high-mass UCDs can be explained by merged cluster complexes in regions with low gravitational fields at large galactocentric radii.
Conclusions. We conclude that the observed ECs and UCDs can be well explained as evolved star cluster complexes.
Key Words.:
Galaxies: star clusters: general – Methods: numerical1 Introduction
Globular clusters (GCs) are very old stellar objects with typical masses between M☉ and M☉ (corresponding roughly to total luminosities between to ), having in general compact sizes with half-light radii of a few pc. This morphology makes them easily observable also in external galaxies with modern telescopes (see Brodie & Strader 2006, and references therein).
The Milky Way has a rich GC system containing 150 GCs (Harris 1996). Most of them are compact with sizes of a few pc. Only 13 GCs (or 9%) have an effective radius larger than 10 pc. Most of these extended clusters (ECs) are fainter than about , only NGC 2419, having a half-light radius of about 20 pc, has a high luminosity of about mag. Further ECs in the vicinity of the Milky Way have been found in the LMC and the Fornax dwarf galaxy (Mackey & Gilmore 2004; van den Bergh & Mackey 2004; McLaughlin & van der Marel 2005).
Comparable objects have also been detected around other galaxies. Huxor et al. (2005) found three ECs around M31, which have very large radii above 30 pc. These clusters were detected by chance as the automatic detection algorithms of the MegaCam Survey discarded such extended objects as likely background contaminations. Follow-up observations by Mackey et al. (2006), using the ACS camera of the Hubble Space Telescope (HST), resolved the ECs into stars proving their nature as M31 clusters. They also detected a fourth EC around M31. The M31 ECs have masses of the order of M☉. Further observations increased the number of ECs in M31 to 13 (Huxor et al. 2008). However, Huxor et al. (2011) showed that the previous estimates of the effective radii were considerably too large. The new size estimate are well below 30 pc. Chandar et al. (2004) observed a part of the disks of the nearby galaxies M81, M83, NGC6946, M101, and M51 using HST and found ECs with effective radii larger than 10 pc in four of them. M51 showed a very high fraction of ECs in the observed area: 8 of 34 GCs (24%). ECs are now detected in all types of galaxies from dwarfs to ellipticals (e.g. Larsen & Brodie 2000; Harris et al. 2002; Lee et al. 2005; Peng et al. 2006; Chies-Santos et al. 2007; Stonkutė et al. 2008; Georgiev et al. 2009; Da Costa et al. 2009).
Hilker et al. (1999) and Drinkwater et al. (2000) discovered in the Fornax Cluster compact objects with luminosities above the brightest known GCs and which were not resolved by ground-based observations. These objects have masses between a few M☉ and M☉ and effective radii between and 100 pc. Drinkwater et al. (2000) interpreted these objects as a new type of galaxy and reflected this interpretation in the name “ultra-compact dwarf galaxy” (UCD). Bekki et al. (2001) suggested that UCDs are the remnants of dwarf galaxies which lost their dark matter halo and all stars except their nucleus. Next to the interpretation as a galaxy, UCDs were also considered as high-mass versions of normal GCs (Mieske et al. 2002), or as merged massive complexes of star clusters (Kroupa 1998; Fellhauer & Kroupa 2002a).
Many UCDs have been found now. Next to the Fornax Cluster, they have been observed in the galaxy cluster Abell~1689 (Mieske et al. 2004), around M87 in the Virgo Cluster (Haşegan et al. 2005; Evstigneeva et al. 2007), the Centaurus Cluster (Mieske et al. 2007), the Coma Cluster (Madrid et al. 2010), and Abell S0740 (Blakeslee & Barber 2008). While most known UCDs belong to galaxy clusters, they have also been observed in rather isolated environments, e.g. in the Sombrero galaxy (M104) by Hau et al. (2009).
Forbes et al. (2008) and Mieske et al. (2008) analyzed larger samples of UCDs. They find that normal and extended star clusters and UCDs form a coherent data set where size and mass-to-light ratio increase continuously with their total mass and concluded that UCDs are more likely bright extended clusters than naked cores of stripped dwarf galaxies. The marginally enhanced mass-to-light ratios of UCDs can be explained by slightly modified initial stellar mass functions (Mieske & Kroupa 2008; Dabringhausen et al. 2009).
High-resolution HST imaging of gas-rich galaxies experiencing major interactions has resolved very intense star formation bursts. The bursting regions are typically located within the severely perturbed disks or tidal tails and are constrained to small complexes that contain a few to hundreds of young massive star clusters. Examples of such systems are the knots in the Antennae galaxies (Whitmore & Schweizer 1995; Whitmore et al. 1999), the complexes in the NGC 7673 star-burst (Homeier et al. 2002), M82 (Konstantopoulos et al. 2009), Arp24 (Cao & Wu 2007), the “bird’s head galaxy” NGC 6745 (de Grijs et al. 2003), NGC 6946 (Larsen et al. 2002), Stephan's Quintet (Gallagher et al. 2001), and NGC 922 (Pellerin et al. 2010).
The masses of such complexes vary from about M☉ up to a few M☉. Bastian et al. (2006) observed star cluster complexes (CCs) in the Antennae with masses of the order M☉ and diameters of the order 100 to 200 pc. Pellerin et al. (2010) found young massive CCs with masses between M☉ and M☉ and diameters between 600 pc and 1200 pc in the collisional ring galaxy NGC 922. One of the most extended CCs has been observed by Tran et al. (2003) in the tail of the “Tadpole galaxy” UGC 10214. This CC, which has a mass of the order M☉, has an effective radius of 160 pc and a diameter of about 1500 pc.
Mengel et al. (2008) observed individual young (10 Myr) star clusters associated with CCs in the Antennae and NGC 1487. They compared dynamical mass estimates with derived photometric masses and found them in excellent agreement, implying that most of them survived the gas removal phase and are bound stellar objects. These young clusters are sufficiently stable to be used as building blocks for numerical simulations. Bastian et al. (2009) found three 200 to 500 Myr old, apparently stable clusters in the Antennae with very high radial velocities relative to the galactic disk, indicating that these star clusters will most likely become future halo objects. One cluster is surrounded by so far unmerged stellar features in its vicinity.
Since galaxy-galaxy mergers are anticipated to have been more common during early cosmological times it is expected that star formation in CCs has been a significant star formation mode during this epoch. Indeed, the preponderance of clumpy galaxies (Elmegreen 2007, and references therein) indicates that early gas-rich galaxies went through an epoch of profuse CC formation. We propose a formation scenario for ECs and UCDs where massive complexes of star clusters were formed during a heavy interaction between gas-rich galaxies, which lead to the formation of various kinds of objects via merging of its constituent star clusters. It has already been shown in previous papers that CCs can merge to form a variety of spheroidal stellar objects, such as UCDs, ECs, faint fuzzies and possibly dwarf spheroidal galaxies (Kroupa 1998; Fellhauer & Kroupa 2002a, b; Bekki et al. 2004; Brüns et al. 2009; Brüns & Kroupa 2011). In particular, the young UCD W3 is most naturally understood to be a merged massive CC (Fellhauer & Kroupa 2005).
In the present paper, we broaden the scope to analyze how the structural parameters of the final merger objects correlate with the underlying CC parameter space. We systematically scan a suitable parameter space for CCs, covering a large range of CC masses and sizes. In Section 2 we summarize the status quo of available observational data on ECs and UCDs used as input for this parametric study. In Section 3, we describe the method and the parameters used for the calculations. The results are presented in Section 4 and discussed in Section 5.
2 Observations
As already indicated in the previous section, GC-like objects with effective radii above 10 pc have been found in various environments covering a large mass range. To allow for an overview of their parameters, we compiled a list of effective radii and mass estimates of GCs, ECs, and UCDs. The respective publications used to compile the data-base are summarized in the following subsections.
2.1 GC systems and ECs
For the Milky Way and its satellites, we use the catalog of resolved massive star clusters of McLaughlin & van der Marel (2005).
The Milky Way data were complemented by the GC tables from Chandar et al. (2004) for the spiral galaxies M51 and M81. In addition, the catalog of GCs in the lenticular galaxy NGC 1380 (Chies-Santos et al. 2007) and the faint fuzzy star clusters found in the lenticular galaxy NGC 1023 by Larsen & Brodie (2000) were used. The catalog of GCs in 68 dwarf galaxies (Georgiev et al. 2009) was added to account for GCs and ECs found in dwarf galaxies.
Next to the aforementioned GC catalogs miscellaneous ECs from M31 (Huxor et al. 2011), M33 (Stonkutė et al. 2008), Scl-dE1 (Da Costa et al. 2009), and NGC 6822 (Lee et al. 2005) were added to the sample.
McLaughlin & van der Marel (2005) estimated cluster masses for all objects using population-synthesis models to define a V-band mass-to-light ratio for every cluster. We use a typical mass-to-light ratio of , which is consistent with the results of McLaughlin & van der Marel (2005), to estimate masses for the remaining objects of this section.
2.2 UCDs and massive GCs
Rejkuba et al. (2007) and Taylor et al. (2010) analyzed a sample of massive GCs in the nearby giant elliptical galaxy NGC 5128 (Centaurus A). Their sample contains 22 massive GCs with masses larger than M☉.
The parameters of UCDs were compiled for the Fornax Cluster (Mieske et al. 2008; Richtler et al. 2005; Evstigneeva et al. 2008), the Virgo Cluster (Haşegan et al. 2005; Evstigneeva et al. 2007, 2008), the Centaurus Cluster (Mieske et al. 2007), and the Coma Cluster (Madrid et al. 2010). In addition, the UCD found in the Sombrero galaxy (M104) by Hau et al. (2009) was considered.
Blakeslee & Barber (2008) identified 15 UCD candidates in the ABELL S0740 cluster, which have rather large effective radii. We added these UCD candidates to our list, but it should be noted that these UCDs are not yet confirmed members of the ABELL S0740 cluster and might therefore be background objects.
A large fraction of UCDs has reliable mass estimates. We used a typical mass-to-light ratio for UCDs of (Mieske et al. 2008) to derive mass estimates for those UCDs, where no mass estimate was published so far.
2.3 Overview of GC, EC, and UCD parameters
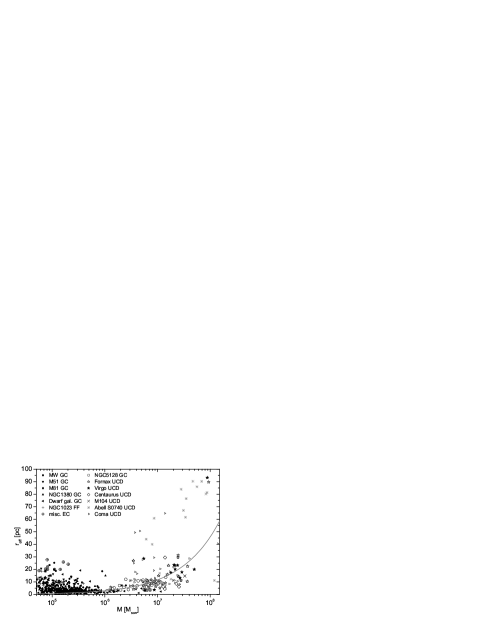
Figure 1 shows the effective radii of the GCs, ECs, and UCDs as a function of their estimated masses. Below masses of M☉, the vast majority of clusters have effective radii of a few pc. Nevertheless, a few dozens of objects have effective radii larger than 10 pc. Most of them have masses of the order M☉. In contrast, only very few ECs are found at masses of the order M☉.
For masses above M☉, there is no clear concentration at low effective radii. The radii are more evenly distributed with a clear trend of increasing with increasing masses. Above M☉ all objects have effective radii above 10 pc. The general trend of increasing , which is added as a grey curve in Fig. 1, was parameterized by Dabringhausen et al. (2008). While this line provides a trend for the majority of massive GCs and UCDs, the scatter is quite large and a number of objects are located far from this line.
Most UCDs show smaller than 35 pc. However, one UCD in the Fornax Cluster and one in the Virgo Cluster have effective radii larger than 90 pc. These two UCDs show a core-halo structure, where the cores have an effective radius of about 10 pc (Evstigneeva et al. 2007). In addition, four UCD candidates in the Coma cluster (Madrid et al. 2010) and the majority of the UCD candidates in Abell S0740 (Blakeslee & Barber 2008) are considerably larger than 35 pc. As most of these objects are not yet confirmed as cluster members, they might also be background galaxies.
3 Numerical method and set-up
3.1 Scenario and model parameters
The formation scenario described in this paper starts with newly born complexes of star clusters covering a large range in masses and sizes. We model the dynamical evolution of various CCs leading to merger objects. We do not, however, consider the galaxy-galaxy interaction, which formed the CCs in the first place.
Individual young massive star clusters were analyzed in detail by Mengel et al. (2008) and Bastian et al. (2009), leading to a combined sample of 25 objects. The median effective radius of these 25 young massive star clusters is 4 pc. We use this value for our individual star clusters, which are the building blocks of the CC models.
All CC models in this paper consist of = 32 star clusters. The individual star clusters are represented by Plummer spheres (Plummer 1911; Kroupa 2008) with = 100 000 particles. The Plummer radius, which corresponds to the effective radius, is chosen to be 4 pc for all models. We select a cutoff radius of pc. For each CC, the 32 star clusters have the same mass, which is 1/32 of the corresponding CC mass. The initial velocity distribution of the star clusters is chosen such that they are in virial equilibrium.
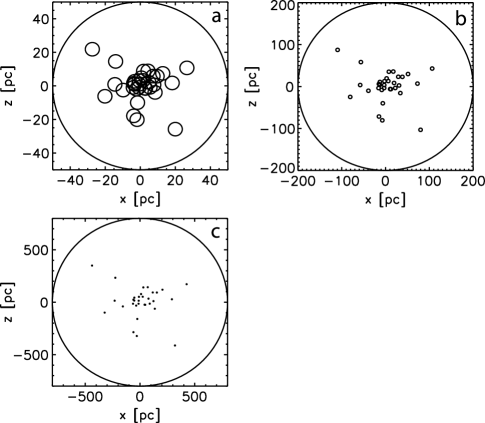
The observed CCs show a clear concentration of star clusters towards their centers (Tran et al. 2003; Bastian et al. 2006; Pellerin et al. 2010). Unfortunately, no detailed observational constraints on the distribution of star clusters in the complex and their dynamical state are available. In the absence of observed density profiles of CCs, we choose a simple model and distribute the star clusters in the CC models according to a Plummer distribution, which is truncated at the cutoff radius . This cutoff radius is large enough to prevent a clear break or edge in the spatial distribution and small enough to avoid single star clusters at very large distances that would be stripped away immediately. If we would increase our cutoff radius from 5 times the Plummer radius to infinity, we would have only one or two star clusters beyond our actual cutoff radius. Hence, the exact value of the cutoff radius will have a negligible impact on the results. Figure 2 shows three exemplary initial distributions of star clusters in the CC. We used the same seeds for the random number generator to generate the same distribution of star clusters scaled to the corresponding Plummer radius of the CC model. In a previous paper on the extended Milky Way cluster NGC 2419 (Brüns & Kroupa 2011), we have demonstrated that the exact initial distribution of star clusters in an extended CC leads to variations in the structural parameters mass and size of the order 10 to 20%. The initial velocity distribution of the CC models is chosen such that each CC is in virial equilibrium. A detailed description of the generation of initial coordinates (space and velocity) for Plummer models is given in the appendix of Aarseth et al. (1974).
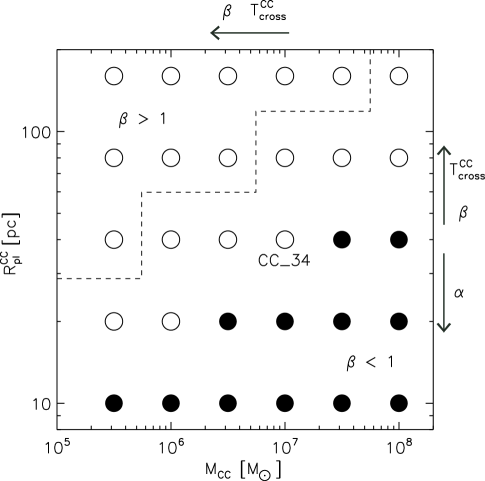
The model parameters constitute a matrix of 5x6 values (Fig. 3) with CC Plummer radii of pc and total CC masses of M☉. The range of sizes and masses are motivated by the observed parameters of ECs and UCDs (see Sect. 2) and they are consistent with observations of CCs (see Sect. 1). For the CC masses and M☉ two additional models with 240 and 360 pc were considered.
3.2 Gravitational potential and orbits
ECs are found near late type disk galaxies, lenticular galaxies, elliptical, and dwarf galaxies, while UCDs are predominantly found close to giant elliptical galaxies. As the gravitational potential has a larger impact on the low-mass objects and as we like to use the same potential for all computations, we chose an analytical Milky-Way-like potential consisting of a disk-, a bulge-, and a halo component. The coordinate system is chosen such that the disk of the host galaxy lies in the xy-plane. The disk is modeled by a Miyamoto-Nagai potential (Miyamoto & Nagai 1975),
| (1) |
with M☉, kpc, and kpc. The bulge is represented by a Hernquist potential (Hernquist 1990),
| (2) |
with M☉, and kpc. The dark matter halo is a logarithmic potential,
| (3) |
with km s-1, and kpc. This set of parameters gives a reasonable Milky-Way-like rotation curve.
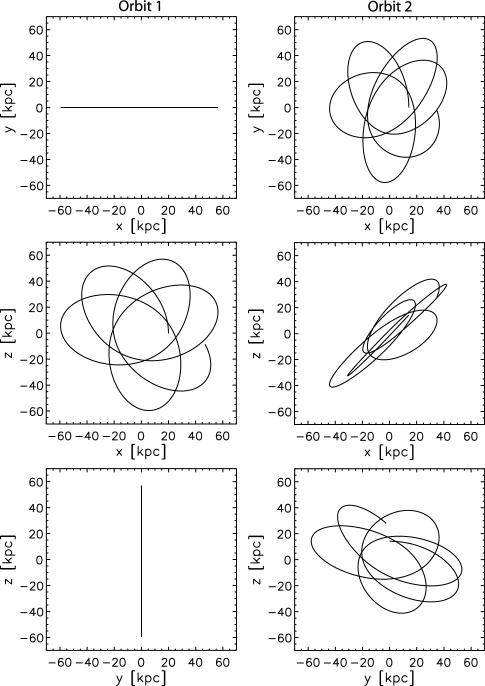
In this paper, we focus on ECs and UCDs located far from the galactic disk in the halo of the respective galaxies. As orbital parameters for such objects are unknown, we chose a polar orbit between galactic radii 20 and 60 kpc for our simulations. These values are motivated by the projected distances to the M31 ECs of 13 to 60 kpc (Mackey et al. 2006) and the projected distances of Fornax UCDs between 8 and 74 kpc (Mieske et al. 2008). Figure 4 illustrates the chosen orbit, which has an orbital period of about 860 Myr.
In our formation scenario, the CCs are most likely formed at the peri-galactic passage of the parent galaxy where the impact of the interaction is strongest. Therefore, we start our calculations at the peri-galactic distance and integrate all models up to 5 Gyr. We stop the integrations at 5 Gyr to save computing time, as the structural parameters change only very slightly afterwards.
To analyze the impact of a polar orbit relative to an inclined orbit, we recalculated a subset of our models also on an inclined orbit (see Fig. 4, Orbit 2). The orbit is expected to have its largest impact on the most extended and lowest mass CC models. The additional computations are indicated by open circles in Fig. 3.
In addition, for the most extended and least massive model ( 160 pc and M☉), where the tidal field has the largest impact, and for the most extended and most massive model ( 160 pc and M☉) complementary calculations on a circular orbit at a galactocentric distance of 60 kpc were performed.
3.3 Numerical method
The numerical modeling was performed with the particle-mesh code Superbox++ developed by Metz (2008). It is a new C++ implementation of the FORTRAN particle-mesh code Superbox (Fellhauer et al. 2000) using object oriented programming techniques. Superbox++ makes particular optimal use of modern multi-core processor technologies. The code solves the Poisson equation on a system of Cartesian grids.
In order to get good resolution of the star clusters two grids with high and medium resolution are focused on each star cluster following their trajectories. The individual high resolution grids have a size of 80 pc and cover an entire star cluster, whereas the medium resolution grid of every star cluster has a size between 800 pc and 1200 pc embedding the whole initial CC. The local universe is covered by a fixed coarse grid with a size of 70 kpc, which contains the orbit of the CC around the center of the galaxy. All grids contain 1283 grid cells.
The galaxy is represented by an analytical potential (see Sect. 3.2). For each particle in the CC the acceleration from the galactic potential is added as an analytical formula to the grid-based acceleration computed by solving the Poisson equation.
3.4 General parameters governing the merging process
The formation process of the merger object depends on the compactness of the initial CC. A measure of how densely a CC is filled with star clusters for an equal number of star clusters is given by the parameter (Fellhauer et al. 2002),
| (4) |
where and are the Plummer radius of a single star cluster and the Plummer radius of the CC, respectively. In general high values of accelerate the merging process because the star clusters already overlap in the center of the CC, whereas low values hamper the merging process. Our models cover -values of 0.4, 0.2, 0.1, 0.05 and 0.025. High values of () correspond to compact CCs with overlapping star clusters in the center (Fig. 2a and b) where the majority of star clusters merge within a few Myr (Fig. 5). Low values of () correspond to extended CCs (Fig. 2c) where the merging process can take up to several hundred Myr. The parameter for the model matrix is shown in Fig. 3 increasing from extended to compact CCs.
Also the tidal field has to be taken into account as it counteracts the merging process. An estimate of the influence of the tidal field on the CC is given by the parameter
| (5) |
(Fellhauer et al. 2002), which is the ratio of the cutoff radius of the CC and its tidal radius . An order of magnitude estimate of the tidal radius is given by King (1962),
| (6) |
where is the mass of the CC, is the galaxy mass within , and are the peri- and apo-galactic distances, and is the eccentricity of the orbit. If the star cluster distribution lies within the tidal radius of the CC () the influence of the tidal field on the merging process is small. Almost all star clusters will merge and only a few are able to escape by chance. However, in case of , a considerable fraction of star clusters can leave the CC before participating in the merging process. The larger the value of , the larger the impact of the tidal field on the formation process of the merger object. The -value distribution of the CC models is displayed in Fig. 3. The low-mass extended CC models have -values . The -values increase with CC size and decrease with CC mass.
For a detailed analysis of merging processes the reader is referred to Fellhauer et al. (2002).
4 Results
We carried out 54 different numerical simulations to study the influence of varying initial CC parameters.
4.1 Time evolution of the merging process
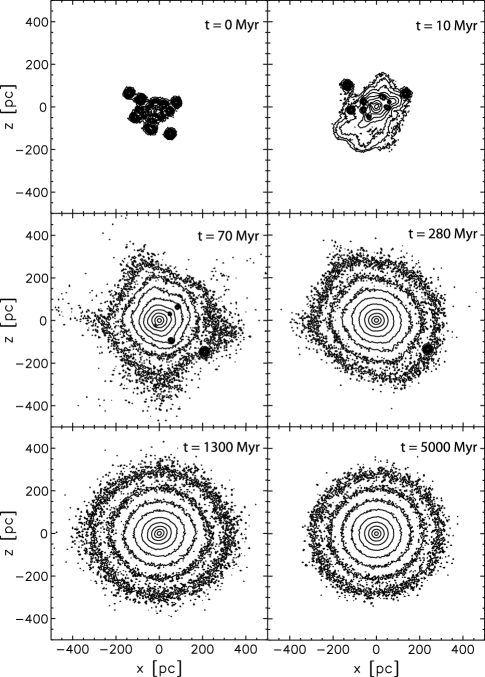
To illustrate the merging process, the evolution of model CC_34 ( 40 pc, M☉) is shown in Fig. 5 as contour plots on the xz-plane. The snapshots were taken at t = 0, 10, 70, 280, 1300 and 5000 Myr. The initial CC has an -value of 0.1. At = 10 Myr (top panel) the merger object is already in the process of formation. In the course of time more and more star clusters are captured by the merger object and the merger object becomes more extended. At = 70 Myr which is about 10 CC-crossing times, the vast majority of star clusters has merged into the merger object. Another 20 CC-crossing-times later the merging process is almost completely terminated and 31 out of 32 star clusters have merged. There is still a close companion star cluster as a satellite of the merger object which eventually (after = 1300 Myr) also falls into the merger object. After the merging process has been completely terminated the merger object becomes slightly smaller and reaches a stable state within a few Gyr. As the structural parameters vary only marginally after a couple of Gyr the simulations are terminated at = 5 Gyr.
The general merging process is very similar for all models, but the corresponding time-scale varies considerably. A typical timescale for a CC is the crossing time of a star cluster through the CC,
| (7) |
The values of the crossing time of the CC cover a range between 0.3 Myr (CC_16) and 340 Myr (CC_51). The general trend of the crossing time is indicated by arrows in Fig. 3. The results of our calculations show that on average half of the individual star clusters have merged after approximately two-and-a-half .
4.2 Number of merged star clusters
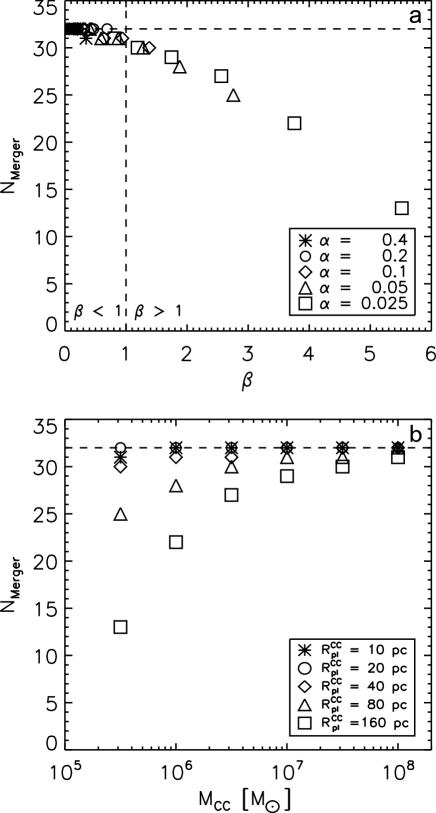
The larger the impact of the tidal field, i.e. the larger the value of , the smaller is the number of merging events. Fig. 6a shows the number of merged star clusters as a function of . For models with , practically all star clusters merge, while for larger values of an increasing number of star clusters are able to escape and align along the orbit.
Figure 6b demonstrates how the number of merged star clusters depends on the mass and size of the initial CC. The number of merged star clusters increases with CC mass and decreases with CC size. The number of merged clusters becomes as low as 13 for the least massive and most extended model ( M☉ and pc). As the unmerged clusters remain compact GCs, the merging of 13 clusters to one merger objects leads to 19 compact GCs originating from the same initial CC.
4.3 Correlation of structural parameters of merger object with CC parameter space
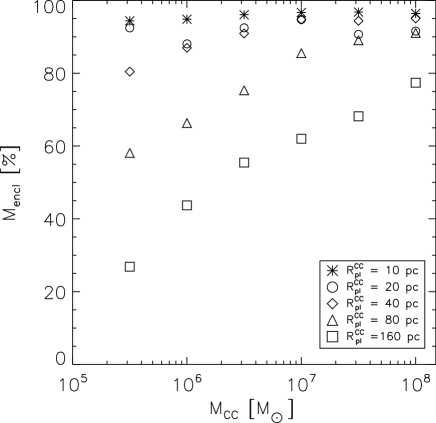
Naturally the number of merged star clusters has a substantial influence on the structural parameters of the merger object. The fraction of the merged mass is compared to the initial CC mass in Fig. 7 for varying CC sizes. For compact models (), where almost every star cluster merges and mass loss is small (less than 20%), the final mass of the merger object is comparable to the initial CC mass. In contrast, the enclosed mass of extended CCs strongly depends on the initial CC mass and size. For the most extended CC models the merger object masses lie between 25 and 80 % of the initial CC mass. The smaller the CC mass and the more extended the CC the larger is the influence of the tidal field. The CC experiences a larger mass-loss and the merging process gets suppressed.
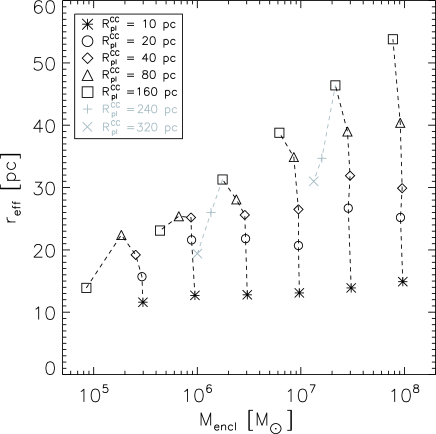
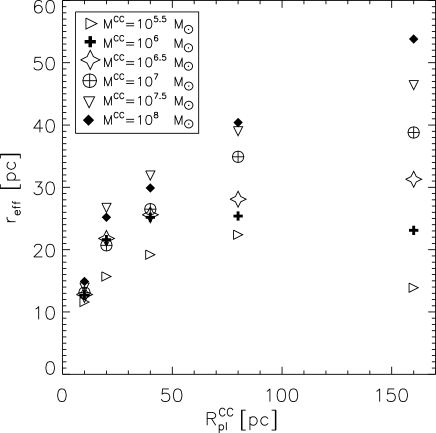
Figure 8 shows the effective radius of the merger object vs. the Plummer radius of the CC, , for different CC-masses, . The effective radius corresponds to the projected half-mass radius, which is the radius within which half of the mass is included when projecting the merger object on the sky. Compact CCs result in merger objects with effective radii comparable to the Plummer radius of the CC, while extended CCs result in merger objects with effective radii that are significantly smaller than the corresponding CC Plummer radius. A CC with a Plummer radius of pc leads to merger objects with sizes between 10 pc and 15 pc while a CC with a Plummer radius of pc yields an effective radius range of about 15 to 55 pc. The more extended the CC becomes the larger is the spread in the effective radii of the merger objects.
For high CC masses of M☉ the effective radii increase with increasing Plummer radii. For the lower mass CCs, the effective radii decrease again for large Plummer radii = 160 pc.
4.4 Trends in the vs. space
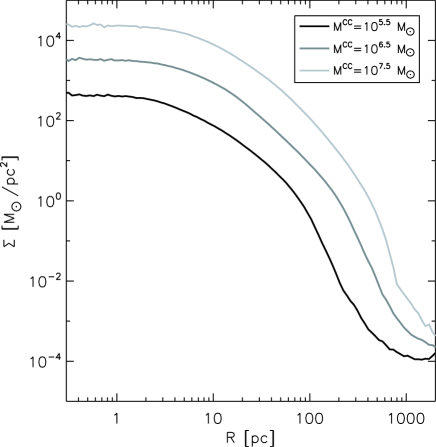
The parameter space of the CC models covers the vs. space uniformly (Fig. 3). The corresponding vs. space of the merger objects is shown in Fig. 9. For the most compact CC models with Plummer radii of pc the effective radii and masses of the merger objects are very similar to the Plummer radii and masses of the CC, while for the most extended models strongly increases with increasing . Figure 10 shows surface density profiles of models with = 80 pc and masses of , and M☉. The surface density profiles are well represented by King profiles. The structural parameters central surface density, core radius, effective radius and tidal radius increase significantly with mass.
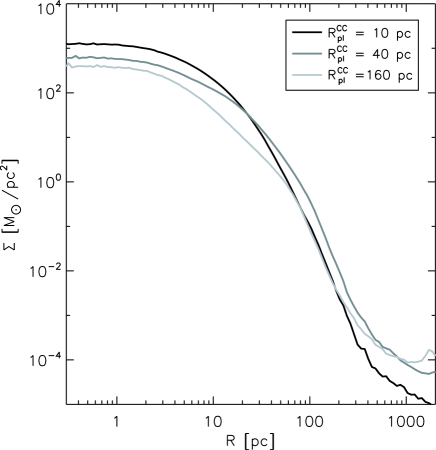
For a given CC mass, increasing the size of the CC results in a larger mass loss and larger effective radii of the resulting merger objects. For the lowest-mass models the effective radii decrease again for the largest . Figure 11 illustrates how the surface density profiles of the merger objects change with the CC Plummer radius ( = 10, 40, and 160 pc) for a CC mass of M☉. The merger objects show King-like profiles. Increasing from 10 pc to 40 pc leads to a lower central surface density and larger values in the outer parts resulting in a larger effective radius. The merger object with = 160 pc suffered a major mass-loss, which leads to considerably lower surface densities especially at intermediate radii (5 to 50 pc) resulting in a lower effective radius.
For the very extended, low-mass models, the parameter is much larger than one, i.e. a considerable number of star clusters of the initial CC is located outside the tidal radius, leading to a rapidly decreasing number of merged star clusters. Brüns & Kroupa (2011) studied such a turnover in detail for the Milky Way EC NGC 2419 and found that the turnover occurs at those , where the parameter is sufficiently large to allow entire star clusters to escape the merging process.
As high mass models have larger tidal radii, their size continuously increases with CC size up to pc. However, increasing the CC size further will eventually result in decreasing also for high-mass models. This is demonstrated for two additional models for CC masses of M☉ and M☉. The CC sizes were extended to pc and pc (grey symbols in Fig. 9). For both CC masses the results show a clear turnover in the effective radii of the merger objects for these large CC sizes.
The turnover leads to degenerate states in the merger-object space, as a relatively compact CC can produce the same merger object as a more massive CC having a significantly larger CC size.
The turnover is a general feature of the merging scenario which occurs when a significant fraction of star clusters is located beyond the tidal radius of the initial CC. Therefore the merging star cluster scenario predicts for each CC mass an upper size limit of the merger objects. The exact CC sizes, where the turnover occurs, will also depend considerably on the initial configuration, i.e. the exact distribution of star clusters in the complex, the number of star clusters constituting the CC, and the orbit.

4.5 Velocity dispersion and dynamical mass
The global line-of-sight velocity dispersion, , is an important observable parameter as it can be used in combination with to estimate the dynamical mass, , of a star cluster. According to Spitzer (1987), can be estimated by
| (8) |
where G is the Gravitational constant. Figure 12 shows the global line-of-sight velocity dispersion, , as a function of the enclosed mass of the merger objects. The turnover, which was discussed in the previous section, is clearly seen also in the velocity dispersion, as and are not independent. For a given mass, an increasing results in a decreasing . The solid and the dotted line in Fig. 12 show the scaling relation of versus mass for objects with an effective radius of 10 pc and 30 pc, respectively.
For our models, the dynamical masses calculated according to Eq. 8 are in very good agreement with the enclosed masses with a scatter of about five percent. The small deviations are due to slight deviations from virial equilibrium and due to the fact that Eq. 8 is only a rough estimate of the dynamical mass.
4.6 Impact of polar orbit
We recalculated 18 CC models on an inclined orbit (see Fig. 4, Orbit 2) to estimate its impact on the structural parameters of the merger objects. In order to save computing time we only recalculated CC models where the inclination of the orbit is expected to have a measurable effect. These are the extended CC models with large CC-crossing-times, large values of , and low values of . These models are indicated by open circles in Fig. 3.
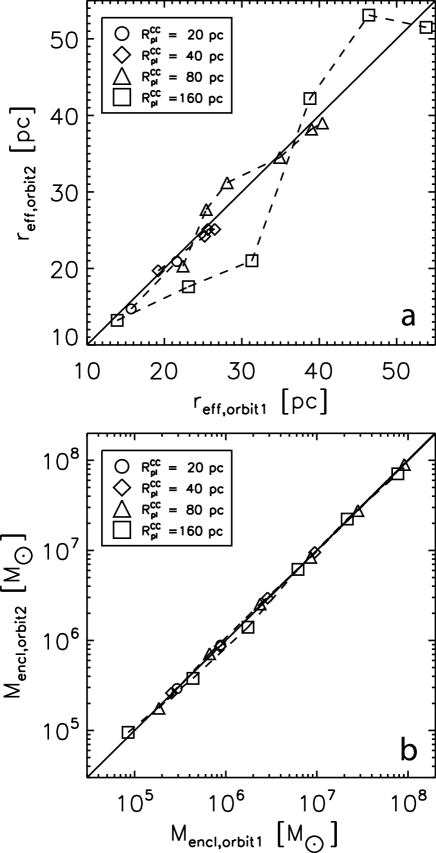
Figure 13a compares the effective radii of the inclined orbit with those of the polar orbit evaluated after 5 Gyr. Both orbits produce merger objects with comparable sizes. Only the most extended models (), which are most sensitive to the tidal field, show significant deviations between both orbits.
Figure 13b compares the enclosed mass of the merger objects of the inclined orbit with those of the polar orbit. While there are some deviations of between the two orbits for the most extended models, the values for both orbits correlate very well.
The results of the inclined orbit as presented in Fig. 13 demonstrate that the inclination of the orbit has no significant influence on the overall results and trends of our parametric study.
5 Discussion and conclusions
We systematically scanned a suitable parameter space for CCs and investigated their future evolution. The varied sizes and masses of the CCs covered a matrix of 5x6 values with CC Plummer radii between 10 - 160 pc and CC masses between - M☉. The results presented in Sect. 4 demonstrate that all simulations end up with stable merger objects, which show a general trend of increasing effective radii with increasing mass. Despite the large range of input Plummer radii of the CCs the effective radii of the merger objects are constrained to values between 10 and 20 pc at the low mass end and to values between 15 and 55 pc at the high mass end. The turnover in the vs. space (see Fig. 9) depends on the mass of the initial CC and occurs at larger sizes for higher masses. The turnover leads to a degeneracy in the vs. space of the merger objects, i.e. very different CC parameters can result in a comparable final merger object. In addition the turnover leads to a higher probability for merger objects to have intermediate effective radii.
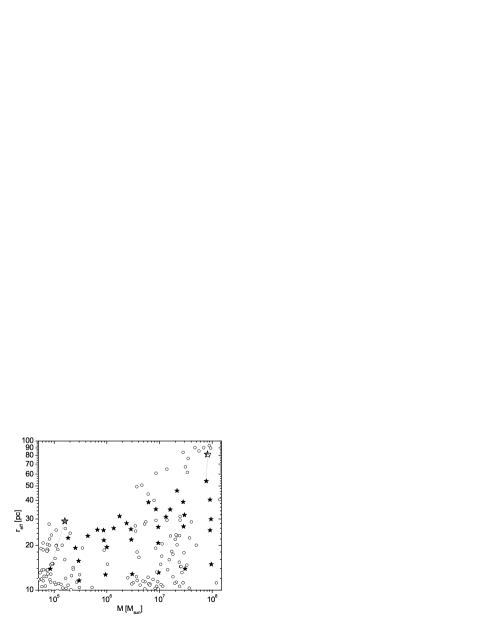
Figure 14 shows as a function of mass of the observed ECs and UCDs (circles) and our models (stars), combining Figs. 1 and 9. The vast majority of the observed ECs and UCDs are located within the parameter space covered by the modeled merger objects. Only the very extended objects at M☉ and the extremely extended UCDs between and M☉ are outside the parameter space covered by this study.
In order to verify that less eccentric orbits would produce more extended objects, we calculated two additional models. For the most extended models with the lowest and the highest mass ( 160 pc, and M☉) we calculated the evolution on a circular orbit at a galactocentric distance of 60 kpc. The corresponding merger objects have considerably larger effective radii of 29 pc and 82 pc (see Fig. 14) than the merger objects on the eccentric orbit, which have effective radii of 14 and 54 pc. Due to the lower gravitational field, the masses of the merger objects on the circular orbits are larger than those of the eccentric orbits. For the lowest mass model the enclosed mass increases from 27% to 50%. These results demonstrate that very extended objects like the M31 ECs found by Huxor et al. (2005) and the very extended, high-mass UCDs can be explained by merged cluster complexes in regions with low gravitational fields at large galactocentric radii.
The evolution of ECs in a weak gravitational environment has also been studied by Hurley & Mackey (2010), who performed direct N-body models of extended low-mass star clusters incorporating a stellar mass function and stellar evolution. They concluded that extended star clusters with an initial mass of 5.8 M☉ are sufficiently stable to survive a Hubble-time in a weak gravitational field environment. Bekki et al. (2004) modeled the first 70 Myr of the merging of high-mass star clusters without an external tidal field. Their finding of triaxial shapes of UCDs is most likely related to the relatively short simulation time. Figure 5 illustrates that the merger objects reach a spherically symmetric shape only after a few Gyr of evolution. Bekki et al. (2004) find a general trend of increasing and velocity dispersions, , with increasing mass. Their effective radii increase from about 8 pc at a mass of 4 M☉ to values of the order of 20 pc at masses of 4 M☉.
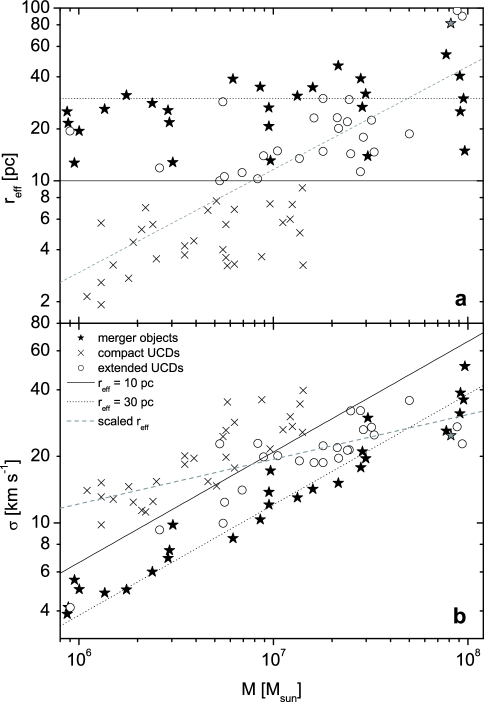
Figure 15 shows only those UCDs and NGC 2419 where observations of the effective radius and the global line-of-sight velocity dispersion are available (Haşegan et al. 2005; Evstigneeva et al. 2007; Mieske et al. 2008; Baumgardt et al. 2009; Hau et al. 2009; Taylor et al. 2010). Figure 15a, which shows versus mass, demonstrates that most of the very extended UCDs with 20 pc shown in Figure 14 have so far no observed velocity dispersions. Figure 15b shows observed global line-of-sight velocity dispersions of NGC 2419 and UCDs and of our merger objects (see Sect. 4.5) as a function of mass. The models have a steeper relation of vs. mass than the observed UCDs. This is due to the fact that we modeled solely extended objects with 10 pc, while UCDs show a general trend of increasing with increasing mass (see Fig. 1). The mean effective radii of the UCDs considered in Figure 15 increase from about 5 pc for masses in the interval to M☉ to about 16 pc for masses between and M☉. The grey dashed line in Figure 15, which combines Eq. 8 with the parameterization of vs. mass from Dabringhausen et al. (2008), is a good representation of the vs. mass relation of the observed UCDs. The results of Bekki et al. (2004) are closer to the observed values as their merger objects have much smaller effective radii than our objects. However, it should be kept in mind that a considerable amount of UCDs with large sizes ( 20 pc) do not have observed velocity dispersions, yet.
The continuous distribution of CC masses used in our parametric study results in a continuous distribution of masses of merger objects. In contrast, the observed masses of ECs and UCDs show clear accumulations near masses M☉ and between and M☉ and a very low number of ECs near M☉ (see Fig. 14). A straightforward interpretation on the basis of the proposed formation scenario would suggest that the mass distribution of ECs and UCDs facilitates direct conclusions on the mass spectrum of the CCs, which produced the ECs and UCDs.
An interpretation of the available data on ECs and UCDs must be done, however, with great care, as the underlying datasets (see Sect. 2) are highly inhomogeneous and incomplete.
Due to the limited field of view of the Hubble Space Telescope, most extragalactic studies on GCs and ECs cover only (a part of) the optical disk of the respective galaxies. The ECs discussed in this paper are, however, halo objects located far from the optical disk of the galaxies. In the Milky Way, 9 out of 13 ECs have galactocentric distances greater than 20 kpc (Harris 1996). The only massive EC ( M☉ and pc) of the Milky Way, NGC2419, is located at a distance of about 92 kpc. A similar trend has been shown for the other two disk galaxies in the Local Group: 12 out of 13 ECs associated with M31 and both ECs found in M33 have projected distances well outside the optical disks of these galaxies (Huxor et al. 2008; Stonkutė et al. 2008; Huxor et al. 2009). While halo ECs might be found by chance in projection to the main body of a galaxy, the probability is relatively low: if a survey covers a projected area of 20 kpc by 20 kpc and a line-of-sight of 100 kpc is considered, the resulting volume, which is covered by the survey, is only about two percent of the volume of a sphere of radius 100 kpc, wherein the ECs would be distributed.
In addition, Larsen & Brodie (2000) and Larsen et al. (2002) have discovered a population of ECs co-rotating with the disk of the lenticular galaxy NGC1023. These so-called faint fuzzies have similar structural parameters as halo ECs and are therefore not easily distinguishable from halo ECs projected onto the disk on the basis of imaging data alone. A fair fraction of ECs found in extragalactic surveys might therefore be associated with the disks and not the halos of these galaxies.Burkert et al. (2005) analyzed the kinematics of the faint fuzzies and concluded that they form a ring-like structure within the galactic disk of NGC 1023 and that this ring was probably formed during a galaxy-galaxy interaction comparable to the Cartwheel galaxy. A detailed discussion of faint fuzzies in the context of merged CCs is given in Brüns et al. (2009), who demonstrated that the observed structural parameters of the faint fuzzies are in excellent agreement with the merged CC scenario.
Another reason for incompleteness is the difficulty of distinguishing ECs from background galaxies. The GC surveys covering 100 galaxies of the Virgo Cluster (Jordán et al. 2005) and 43 galaxies of the Fornax Cluster (Masters et al. 2010) applied a size limit of 10 pc to reduce the contamination of background galaxies. Thereby, they excluded also all ECs from their GC catalogs. Peng et al. (2006) used the same Virgo Cluster survey data as Jordán et al. (2005) to search for diffuse star clusters and found e.g. in the galaxy VCC798 about 30 ECs, where Jordán et al. (2005) found 211 compact GCs. Peng et al. (2006) have demonstrated that hundreds of ECs await detection in galaxy clusters. Without follow-on spectroscopy to determine radial velocities, it cannot be decided whether these ECs are associated with the main body or the halo of the galaxies.
While lower-mass ECs up to M☉ are often overlooked in surveys, much effort has been made to detect and to analyze stellar objects of M☉ since the discovery of UCDs in the Fornax Cluster by Hilker et al. (1999) and Drinkwater et al. (2000). Therefore, the incompleteness for UCDs is expected to be considerably lower.
In conclusion, the rapidly increasing number of detected ECs and UCDs associated with various types of galaxies in different environments offers a new perspective to the process of cluster formation and galaxy evolution. Since galaxy-galaxy mergers are anticipated to have been more common during early cosmological times it is expected that star-formation in cluster complexes has been a significant star-formation mode during this epoch. Our work provides a unification of the compact state of young star clusters and the extended size of ECs by allowing ECs to form from a CC of compact star clusters. If the formation scenario suggested in this paper is correct, a statistical analysis of the observed ECs und UCDs with respect to the results of the models has the potential to shed light on the mass spectrum of the initial CCs and thereby on the interaction history of galaxies at this cosmologically important epoch.
Considerably larger, more homogeneous, and more complete datasets of ECs and UCDs and more detailed observations of CCs are, however, necessary to draw statistically significant conclusions on their origin.
Acknowledgements.
We thank the anonymous referee for his helpful comments, which lead to a considerably improved paper. The work of this paper was supported by DFG Grants KR 1635/14-1 and KR 1635/29-1.References
- Aarseth et al. (1974) Aarseth, S.J., Henon, M., & Wielen, R. 1974, A&A, 37, 183
- Bastian et al. (2006) Bastian, N., Emsellem, E., Kissler-Patig, M., & Maraston, C. 2006, A&A, 445, 471
- Bastian et al. (2009) Bastian, N., Trancho, G., Konstantopoulos, I.S., & Miller, B.W. 2009, ApJ, 701, 607
- Baumgardt et al. (2009) Baumgardt, H., Côté, P., Hilker, M., Rejkuba, M., Mieske, S., Djorgovski, S.G., & Stetson, P. 2009, MNRAS, 396, 2051
- Bekki et al. (2001) Bekki, K., Couch, W.J., & Drinkwater, M.J. 2001, ApJ, 552, L105
- Bekki et al. (2004) Bekki, K., Couch, W.J., Drinkwater, M.J., & Shioya, Y. 2004, ApJ, 610, L13
- Blakeslee & Barber (2008) Blakeslee, J.P., & Barber DeGraaff, R. 2008, AJ, 136, 2295
- Burkert et al. (2005) Burkert, A., Brodie, J., & Larsen, S. 2005, ApJ, 628, 231
- Brodie & Strader (2006) Brodie, J. P., & Strader, J. 2006, ARA&A, 44, 193
- Brüns et al. (2009) Brüns, R. C., Kroupa, P., & Fellhauer, M. 2009, ApJ, 702, 1268
- Brüns & Kroupa (2011) Brüns, R. C., & Kroupa, P. 2011, ApJ, 729, 69
- Chandar et al. (2004) Chandar, R., Whitmore, B, & Lee, M. G. 2004, ApJ, 611, 220
- Cao & Wu (2007) Cao, C., & Wu, H. 2007, AJ, 133, 1710
- Chies-Santos et al. (2007) Chies-Santos, A. L., Santiago, B. X., & Pastoriza, M. G. 2007, A&A, 467, 1003
- Dabringhausen et al. (2008) Dabringhausen, J., Hilker, M., & Kroupa, P. 2008 MNRAS, 386, 864
- Dabringhausen et al. (2009) Dabringhausen, J., Kroupa, P., & Baumgardt, H. 2009 MNRAS, 394, 1529
- Da Costa et al. (2009) Da Costa, G. S., Grebel, E. K., Jerjen, H., Rejkuba, M., & Sharina, M. E. 2009, AJ, 137, 4361
- de Grijs et al. (2003) de Grijs, R., Anders, P., Bastian, N., et al. 2003, MNRAS, 343, 1285
- Drinkwater et al. (2000) Drinkwater, M. J., Jones, J. B., Gregg, M. D., & Phillipps, S. 2000, PASA, 17, 227
- Elmegreen (2007) Elmegreen, D. M. 2007, in IAU symp. 235, eds. F. Combes, & J. Palous, 376
- Evstigneeva et al. (2007) Evstigneeva, E. A., Gregg, M. D., Drinkwater, M. J., & Hilker, M. 2007, AJ, 133, 1722
- Evstigneeva et al. (2008) Evstigneeva, E. A., Drinkwater, M. J., Peng, C.Y., et al. 2008, AJ, 136, 461
- Fellhauer et al. (2000) Fellhauer, M., Kroupa, P., Baumgardt, H., et al. 2000, New A, 5, 305
- Fellhauer et al. (2002) Fellhauer, M., Baumgardt, H., Kroupa, P., & Spurzem, R. 2002, CeMDA, 82, 113
- Fellhauer & Kroupa (2002a) Fellhauer, M., & Kroupa, P. 2002a, MNRAS, 330, 642
- Fellhauer & Kroupa (2002b) Fellhauer, M., & Kroupa, P. 2002b, AJ, 124, 2006
- Fellhauer & Kroupa (2005) Fellhauer, M., & Kroupa, P. 2005, MNRAS, 359, 223
- Forbes et al. (2008) Forbes, D. A., Lasky, P., Graham, A. W., & Spitler, L 2008, MNRAS, 389, 1924
- Gallagher et al. (2001) Gallagher, S. C., Charlton, J. C., Hunsberger, S. D., Zaritsky, D., & Whitmore, B. C. 2001, AJ, 122, 163
- Georgiev et al. (2009) Georgiev, I. Y., Puzia, T. H., Hilker, M., & Goudfrooij, P. 2009, MNRAS, 392, 879
- Harris (1996) Harris, W.E. 1996, AJ, 112, 1487
- Harris et al. (2002) Harris, W. E., Harris, G. L. H., Holland, S. T., & McLaughlin, D. E. 2002, AJ, 124, 1435
- Haşegan et al. (2005) Haşegan, M., Jordán, A., Côté, P., et al. 2005, ApJ, 627, 203
- Hau et al. (2009) Hau, G. K. T., Spitler, L. R., Forbes, D. A., et al. 2009, MNRAS, 394, L97
- Hernquist (1990) Hernquist, L. 1990, ApJ, 356, 359
- Hilker et al. (1999) Hilker, M., Infante, L., Vieira, G., Kissler-Patig, M., & Richtler, T. 1999, A&AS, 134, 75
- Homeier et al. (2002) Homeier, N., Gallagher, J. S. III, & Pasquali, A. 2002, A&A, 391, 857
- Hurley & Mackey (2010) Hurley, J.R., & Mackey, A.D. 2010, MNRAS, 408, 2353
- Huxor et al. (2005) Huxor, A. P., Tanvir, N. R., Irwin, M. J., et al. 2005, MNRAS, 360, 1007
- Huxor et al. (2008) Huxor, A. P., Tanvir, N. R., Ferguson, A. M. N., et al. 2008, MNRAS, 385, 1989
- Huxor et al. (2009) Huxor, A., Ferguson, A.M.N., Barker, M.K., et al. 2009, ApJ, 698, L77
- Huxor et al. (2011) Huxor, A., Ferguson, A.M.N., Tanvir, N.R., et al. 2011, MNRAS, astro-ph 1102.0403
- Jordán et al. (2005) Jordán, A., Côté, P., Blakeslee, J. P., et al. 2005, ApJ, 634, 1002
- King (1962) King, I. 1962, AJ, 67, 471
- Konstantopoulos et al. (2009) Konstantopoulos, I. S., Bastian, N., Smith, L. J., et al. 2009, ApJ, 701, 1015
- Kroupa (1998) Kroupa, P. 1998, MNRAS, 300, 200
- Kroupa (2008) Kroupa, P. 2008, in The Cambridge N-Body Lectures, Lecture Notes in Physics, Vol. 760, eds. S. Aarseth, C. Tout, & R. Mardling (Berlin: Springer Verlag), 181
- Larsen & Brodie (2000) Larsen, S. S., & Brodie, J. P. 2000, AJ, 120, 2938
- Larsen et al. (2002) Larsen, S. S., Efremov, Y. N., Elmegreen, B. G., et al. 2002, ApJ, 567, 896
- Lee et al. (2005) Lee, M. G., Chandar, R., & Whitmore, B. C. 2005, AJ, 130, 2128
- Mackey & Gilmore (2004) Mackey, A. D., & Gilmore, G. F. 2004, MNRAS, 352, 153
- Mackey et al. (2006) Mackey, A. D., Huxor, A., Ferguson, A.M.N., et al. 2006, ApJ, 653, L105
- Madrid et al. (2010) Madrid, J. P., Graham, A. W., Harris, W. E., et al. 2010, ApJ, 722, 1707
- Masters et al. (2010) Masters, K. L., Jordán, A., Côté, P., et al. 2010, ApJ, 715, 1419
- McLaughlin & van der Marel (2005) McLaughlin, D. E., & van der Marel, R. P. 2005, ApJS, 161, 304
- Mengel et al. (2008) Mengel, S., Lehnert, M. D., Thatte, N. A., et al. 2008, A&A, 489, 1091
- Metz (2008) Metz, M. 2008, PhD thesis, Universität Bonn
- Mieske et al. (2002) Mieske, S., Hilker, M., & Infante, L. 2002, A&A, 383, 823
- Mieske et al. (2004) Mieske, S., Infante, L., Benítez, N., et al. 2004, AJ, 128, 1529
- Mieske et al. (2007) Mieske, S., Hilker, M., Jordán, A., Infante, L., & Kissler-Patig, M. 2007, A&A, 472, 111
- Mieske et al. (2008) Mieske, S., Hilker, M., Jordán, A., et al. 2008, A&A, 487, 921
- Mieske & Kroupa (2008) Mieske, S., & Kroupa, P. 2008, ApJ, 677, 276
- Miyamoto & Nagai (1975) Miyamoto, M., & Nagai, R. 1975, PASJ, 27, 533
- Pellerin et al. (2010) Pellerin, A., Meurer, G. R., Bekki, K., et al. 2010, AJ, 139, 1369
- Peng et al. (2006) Peng, E.W., Côté, P., Jordán, A., et al. 2006, ApJ, 639, 838
- Plummer (1911) Plummer, H. C. 1911, MNRAS, 71, 460
- Rejkuba et al. (2007) Rejkuba, M., Dubath, P., Minniti, D., & Meylan, G. 2007 A&A, 469, 147
- Richtler et al. (2005) Richtler, T., Dirsch, B., Larsen, S., Hilker, M., & Infante, L. 2005, A&A, 439, 533
- Spitzer (1987) Spitzer, L. 1987, in: Dynamical Evolution of Globular Clusters (Princeton: Princeton Univ. Press)
- Stonkutė et al. (2008) Stonkutė, R., Vansevičius, V., Arimoto, N., et al. 2008, AJ, 135, 1482
- Taylor et al. (2010) Taylor, M.A., Puzia, T.H., Harris, G.L., Harris, W.E., Kissler-Patig, M., & Hilker, M. 2010, ApJ, 712, 1191
- Tran et al. (2003) Tran, H.D., Sirianni, M., Ford, H.C. et al. 2003, ApJ, 585, 750
- van den Bergh & Mackey (2004) van den Bergh, S., & Mackey, A. D. 2004, MNRAS, 354, 713
- Whitmore & Schweizer (1995) Whitmore, B. C., & Schweizer, F. 1995, AJ, 109, 960
- Whitmore et al. (1999) Whitmore, B. C., Zhang, Q., Leitherer, C., et al. 1999, AJ, 118, 1551