Penetrating the Homunculus – Near-Infrared Adaptive Optics Images of Eta Carinae 11affiliation: Based on observations obtained at the Gemini Observatory (program ID : GS-2008B-DD-6), which is operated by the Association of Universities for Research in Astronomy, Inc., under a cooperative agreement with the NSF on behalf of the Gemini partnership: the National Science Foundation (United States), the Science and Technology Facilities Council (United Kingdom), the National Research Council (Canada), CONICYT (Chile), the Australian Research Council (Australia), Ministério da Ciência e Tecnologia (Brazil) and Ministerio de Ciencia, Tecnología e Innovación Productiva (Argentina).
Abstract
Near-infrared adaptive optics imaging with NICI and NaCO reveal what appears to be a three-winged or lobed pattern, the “butterfly nebula”, outlined by bright Br and H2 emission and light scattered by dust. In contrast, the [Fe II] emission does not follow the outline of the wings, but shows an extended bipolar distribution which is tracing the Little Homunculus ejected in Car’s second or lesser eruption in the 1890’s. Proper motions measured from the combined NICI and NaCO images together with radial velocities show that the knots and filaments that define the bright rims of the butterfly were ejected at two different epochs corresponding approximately to the great eruption and the second eruption. Most of the material is spatially distributed 10 to 20 above and below the equatorial plane apparently behind the Little Homunculus and the larger SE lobe. The equatorial debris either has a wide opening angle or the clumps were ejected at different latitudes relative to the plane. The butterfly is not a coherent physical structure or equatorial torus but spatially separate clumps and filaments ejected at different times, and now 2000 to 4000 AU from the star.
1 Introduction
Eta Carinae’s dusty, mottled, bipolar Homunculus nebula and its ragged equatorial “skirt” of debris provide a visual record of its two eruptions in the 19th century. Numerous studies to measure the proper motions and expansion of the ejecta have shown that the bipolar lobes were ejected during Car’s “great eruption” in the 1840’s (Gaviola 1950, Ringuelet 1958, Currie et al. 1996, Smith & Gehrz 1998, Morse et al. 2001). Proper motion and radial velocity measurements of the equatorial ejecta revealed material very likely expelled in two separate eruptions (Davidson et al., 1997, 2001; Smith & Gehrz, 1998; Currie & Dowling, 1999; Morse et al., 2001), in the 1840’s and in the lesser known second eruption in the 1890’s (see Humphreys, Davidson and Smith 1999). A second, smaller bipolar outflow, now called the “Little Homunculus”, was discovered by Ishibashi et al. (2003) based on the Doppler–shifted morphology of the integral-sign shaped Fe II and [Fe II] emission lines in HST/STIS spectra. It is embedded in the Homunculus and extends in either direction along the major axis. Its kinematics suggest an ejection date associated with the 1890’s eruption (Ishibashi et al., 2003; Ishibashi, 2005; Smith, 2005). The Little Homunculus cannot be distinguished in visual images of Car due to bright nebulosity near the star and to extinction in the Homunculus, but its structure can be traced by the velocities of the [Fe II] emission lines (Ishibashi et al. 2003; Smith 2002, 2005; Teodoro et al. 2008).
Infrared imaging and spectroscopy allow us to penetrate the dusty outer shell of the Homunculus to reveal a complex structure near the central star. Mid-infrared imaging, from 5m to 24m, revealed an elongated feature several arcseconds across centered on the star and interpreted as a circumstellar ring (Rigaut & Gehring 1995; Smith et al. 1998; Polomski et al. 1999; Smith & Gehrz 2000). The highest resolution mid-IR imaging to date, (Smith et al., 1995, 2002; Chesneau et al., 2005), show what looks like two interlocking rings or loops with multiple bright knots. Near-IR images (1 – 2 m) obtained with HST/NICMOS were discussed by Smith and Gehrz (1998) who identified a loop-like structure which they also attributed to an equatorial torus. A near-IR (1 – 4m) study by Chesneau et al (2005) using the VLT adaptive optics system, NaCO111The Nasmyth Adaptive Optics System and Near-Infrared Imager and Spectrograph on UT4 of the VLT under programs 074.D-0140, 076.D-0586, 078.D-0562. resolved this feature into a complex dusty structure, the “butterfly” nebula, with three fans or wings outlined by emitting warm dust and reflected hydrogen emission, around the relatively dark wings which are apparently devoid of dust. The wings of the butterfly appear to be emanating from the region of the central star. Chesneau et al. suggested that this was a dusty, bipolar nebula distinct from the little Homunculus. Alternatively, Smith (2006) has argued for a distorted equatorial torus that has been swept back by the stellar wind. Kinematic data are needed to determine the geometric orientation of this complex structure with respect to the axis of symmetry of the Homunculus and the equatorial ejecta and its ejection epoch.
We obtained narrow-band images with the Near-Infrared Coronagraphic Imager (NICI) and adaptive-optics on the Gemini-South telescope just after Car’s 2009 spectroscopic event. In the next section we describe the observing procedure and data reduction. The narrow-band Br, H2, and [FeII] images are discussed in §3. The Br and H2 images are essentially identical. Both trace the outlines of the butterfly nebula, while the continuum-subtracted [Fe II] image reveals a bipolar distribution due to the little Homunculus. In §4 we compare our images with the NaCO images obtained several years earlier and measure the projected motions. The expansion, orientation, and ejection epoch for the resolved features in the butterfly nebula are discussed in the last section.
2 Observations and Data Reduction
We used the Near Infrared Coronagraphic Imager (NICI) (Ftaclas, Martín & Toomey, 2003, Chun et al. 2008) to image the Homunculus of Car on 2009 February, 11 UT, a few weeks after the spectroscopic minimum. NICI features a dual channel camera, primarily designed for Spectral Differential Imaging (SDI) for planet searches (Marois et al., 2005, Biller et al., 2004), but the simultaneity of the two channel imaging also provides optimal on/off line imaging. This simultaneity ensures that the observing conditions (transmission, seeing) for the two channels are matched. Because of its extended nebulosity, the SDI technique was not appropriate for Car.
Pairs of exposures were recorded simultaneously in the two channels with different filters. The Cassegrain rotator was turned off during the observations. The filters were chosen to map the spatial extent of previously identified emission features in Car’s near-infrared spectrum and to provide off-band continuum images for subtraction. Near-infrared spectra (Smith & Davidson, 2001) were used to determine which filters would yield off-band continuum images free of strong emission features. The filters and their characteristics are listed in Table 1. The exposure in each filter is a coaddition of thirty s subexposures. During our observations the seeing varied between and . The effective resolution was and for the and -band filters, respectively, close to the corresponding diffraction limits of and . NICI has an pixel scale providing a Nyquist sampling of the and -band diffraction limits. We used the 95% pupil mask with the semi-transparent focal plane mask to block the central star. The mask slightly degrades the resolution, but minimizes the intensity of the speckle pattern. With the rotator turned off, the field slowly rotated (6-8∘) through the observing sequence. The field rotation was used for spatial dithering and for bad pixel removal. This approach is more efficient than a classical dithering pattern as it avoids the overheads involved in the reacquisition behind the coronagraphic mask
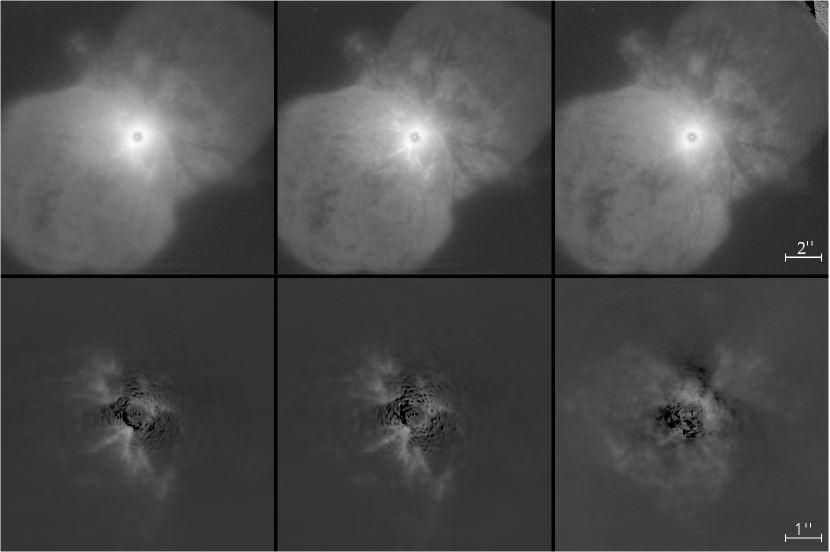
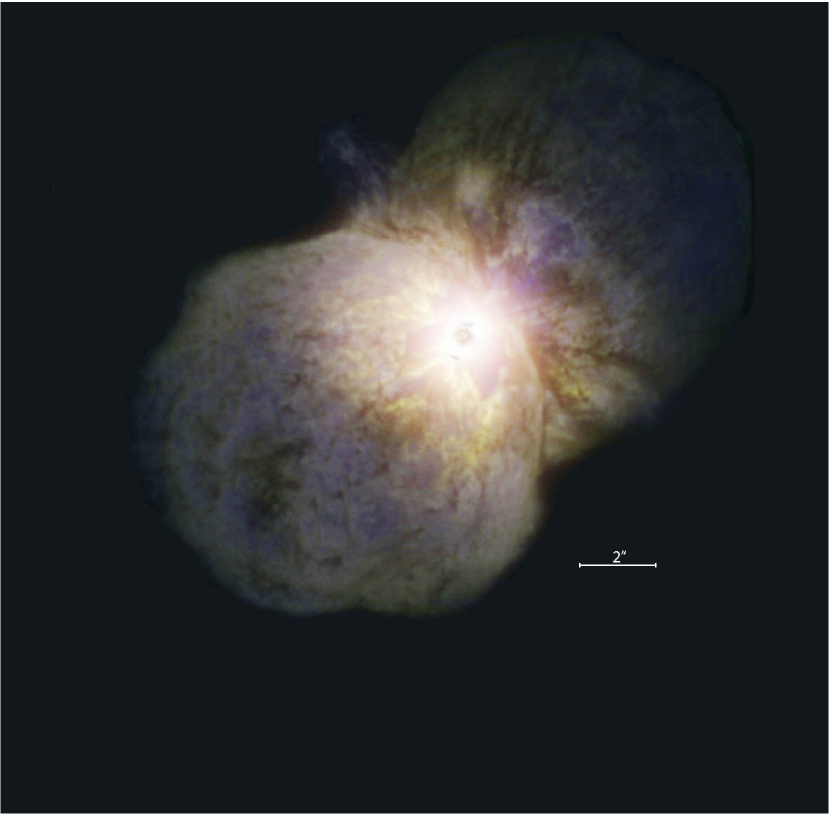
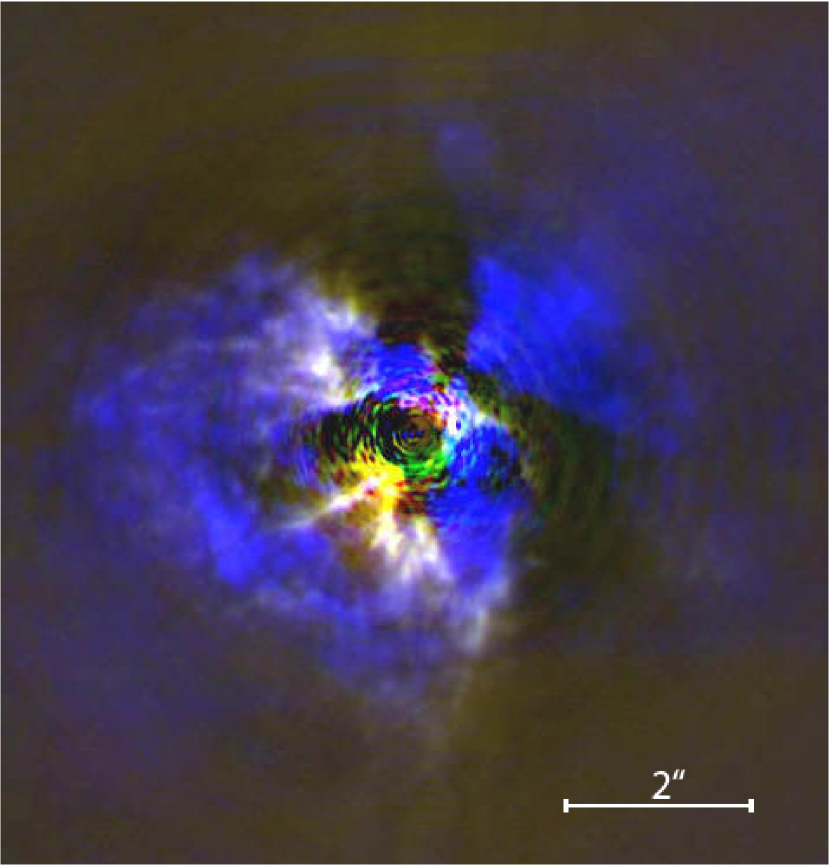
Data reduction steps followed a relatively classical approach. The images were first dark-subtracted and flat-fielded using a median-combined flat that was produced using flat frames taken without the coronagraphic mask. The images were then registered using the unsaturated core of the central star, visible through the semi-transparent coronagraphic mask. A “bad pixel” mask was produced from the flat field images, and bad pixels were flagged in all images. Images were then derotated to a common position angle using the known parallactic angle at the time of observation. The images were median combined to produce the final image. This procedure was repeated for the on and off band filters and the resulting images were subtracted to produce a image. Figure 1 shows the resulting continuum and continuum-subtracted line images for each of the three filter combinations. The combined color continuum and line-continuum images are shown in Figures 2a and 2b.
To better characterize small scale structures in the images, a set of final images was produced by subtracting an median filter from all of the images before the final median combination. These high-passed images better highlight the filamentary structures in the inner Homunculus and are used later to measure their motions.
The near-infrared NaCO images used in this paper were obtained between 2002 and 2006 by Chesneau and his collaborators. A new detector (InSb Aladdin 3 array) was installed in May 2004, replacing the Aladdin 2 detector that had been used since the camera was first available (Chesneau et al. 2005). The NB_374, NB_405 narrow band filters222Central wavelengths 3.74m and 4.05m and 0.02m wide. were used to achieve the best optimization and contrast for the dusty neighborhood of Car. The field of view was and the scale was 27.1 mas per pixel. The reading mode was the so-called ’Uncorr’ mode in which the array is reset and then read once. The minimum effective integration time used for these observations was 0.1750 s. The AutoJitter mode was used so that at each exposure, the telescope moves according to a random pattern in a 10 box. The images were reduced with a self-developed IDL routine that processes the individual frames as described in Chesneau et al. 2005.
3 Description of the Images – Penetrating the Homunculus Nebula
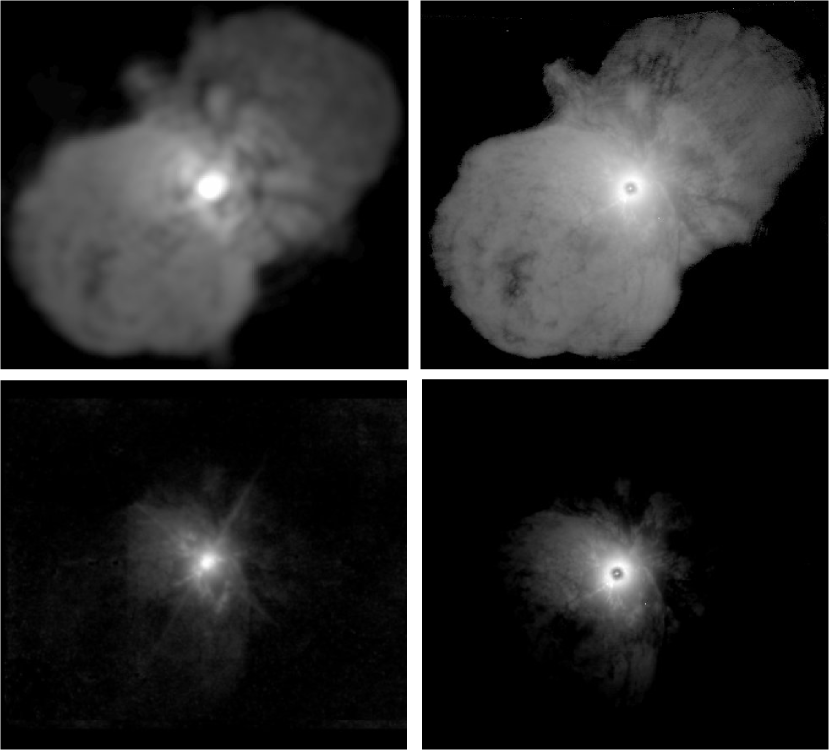
Our -band continuum image and continuum subtracted narrow band Br and H2 images in Figure 1 and the color continuum image in Figure 2a clearly show the three winged dark pattern named the butterfly nebula by Chesneau et al. (2005). The dark wings in both near and mid-infrared images are attributed to the lack of emitting dust at these locations. The continuum-subtracted narrow-band Br and H2 images (Fig.1) show essentially identical patterns of emission due to scattered light by dust. In Figure 3, we show our NICI -band continuum image together with the NICMOS narrow-band 2.15m image, at lower resolution, from Smith and Gehrz (2000) and the central region of the butterfly from the NaCO and NICI -band images. Interestingly, comparison of the two high resolution -band images show no apparent change in the morphology of the butterfly or of the warm infrared emitting regions.
In contrast with the Br and H2 images, the [Fe II] emission shows a very different distribution in Figure 1 and in the combined line color image in Figure 2a. Although the corresponding continuum image shows a weak butterfly pattern, the [Fe II] emission does not follow the outline of the wings, but instead shows a much broader bipolar distribution that is most easily seen in Figure 2b. The spatial extent of the [Fe II] emission is readily traced in the nearer SE lobe out to 2 from the star. We also note that a mottled structure is detectable in the SE lobe [Fe II] emission probably due to reflection in the overlying dusty Homunculus. A relatively bright emission region just above the mask is probably from the Weigelt knots where the [Fe II] emission is known to be strong (Davidson et al. 1995, 1997, Smith 2002). Directly to the NW of the star we are very likely detecting a contribution to the [Fe II] emission from the “fan”. Despite its appearance in the visual images of the Homunculus, this feature is not part of the equatorial spray, but instead a region where we see light from the star’s north polar region directly reflected off the dust. Although fainter in the NW lobe, the [Fe II] emission can also be traced to about 2 along the major axis.
As we noted in the Introduction, the physical extent and shape of the little Homunculus is traced spectroscopically by its Fe II and [Fe II] emission. Figure 8 in the discovery paper (Ishibashi et al., 2003) illustrates the shape and spatial extent of the bipolar [Fe II] emission from the Little Homunculus relative to the Homunculus lobes. A velocity map of the Homunculus (Smith, 2006) in the 1.64m [Fe II] line, the same line imaged with NICI, and the IFU map by Teodoro et al. (2008) likewise show the extent of the Little Homunculus to 2 along the major axis. The spectroscopic map also exihibits the same asymmetry in its brightness between the SE and NW lobes as mentioned above. We therefore conclude that the [Fe II] emission in the NICI image is tracing the Little Homunculus.
One of our original goals for high-resolution images near the time of Car’s 2009 spectroscopic event was to look for possible changes in its dusty environment that may be due to changing illumination of the inner ejecta and excitation of the Weigelt knots as the secondary star passed through the massive primary’s wind. The Weigelt knots are small blobs or condensations of gas and dust 700 AU (03) to the northwest of the star first identified by speckle interferometry (Weigelt & Ebersberger, 1986). The high excitation emission lines seen in ground-based spectra originate in the knots presumably due to UV radiation from the hot secondary star (Mehner et al., 2010). During the spectroscopic events these emission lines weaken and disappear.
As already noted there is no obvious variation in the -band images obtained nearly seven years apart. Due to the focal plane mask, the region of the Weigelt knots, where we might expect to observe some changes, is unfortunately not visible in the NICI images although the extremely IR-bright central star can be seen through the mask in the continuum images. Small changes in positions of the knots had been detected in speckle interferometry (Weigelt et al., 1995; Falcke et al., 1996) and later in HST imaging and spectroscopy (Davidson et al., 1997; Dorland et al., 2004; Smith et al., 2004). The knots are moving very slowly, compared with the expansion of the Homunculus, at less than 50 km s-1 (0005 yr-1) in the equatorial plane. Fortunately no mask was used for the five 3.74m (Pf) and 4.05m (Br) NaCO images obtained from 2002 to 2006 and which bracket the 2003.5 event. The structures seen in the near-infrared images closely correspond with the knots seen in the visible or UV although they are not spatially coincident. The visible structures, dominated by scattering, trace the walls of the dense clumps of dust, while the infrared structures are identified with the emission from hot dust, probably the external layers of the clumps. The infrared condensations corresponding to knots C and D, are therefore called C and D, see Chesnaeu et al. (2005).
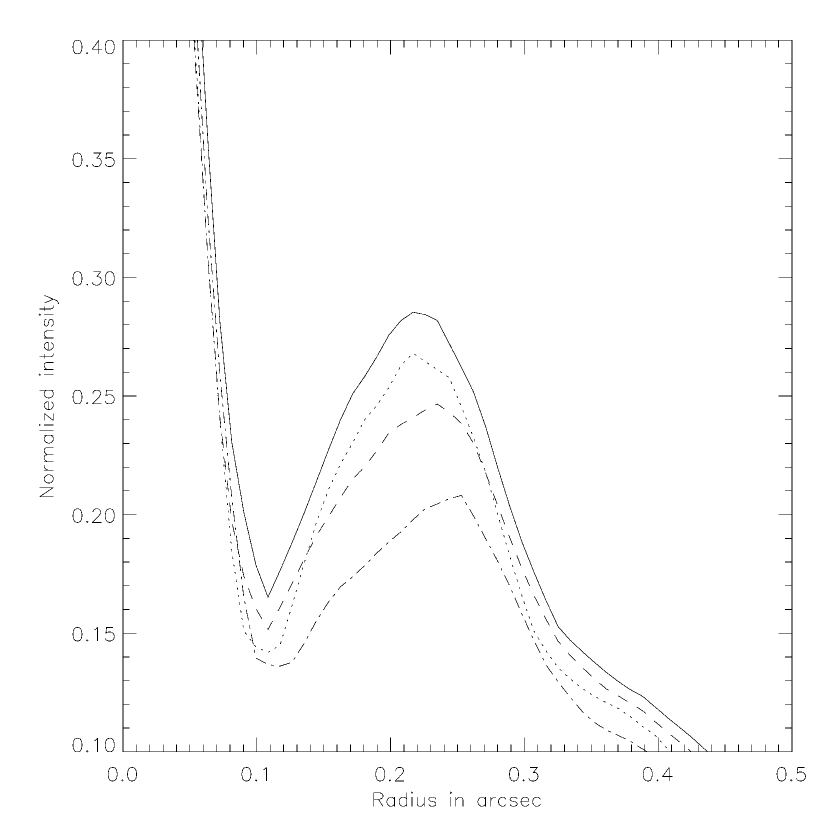
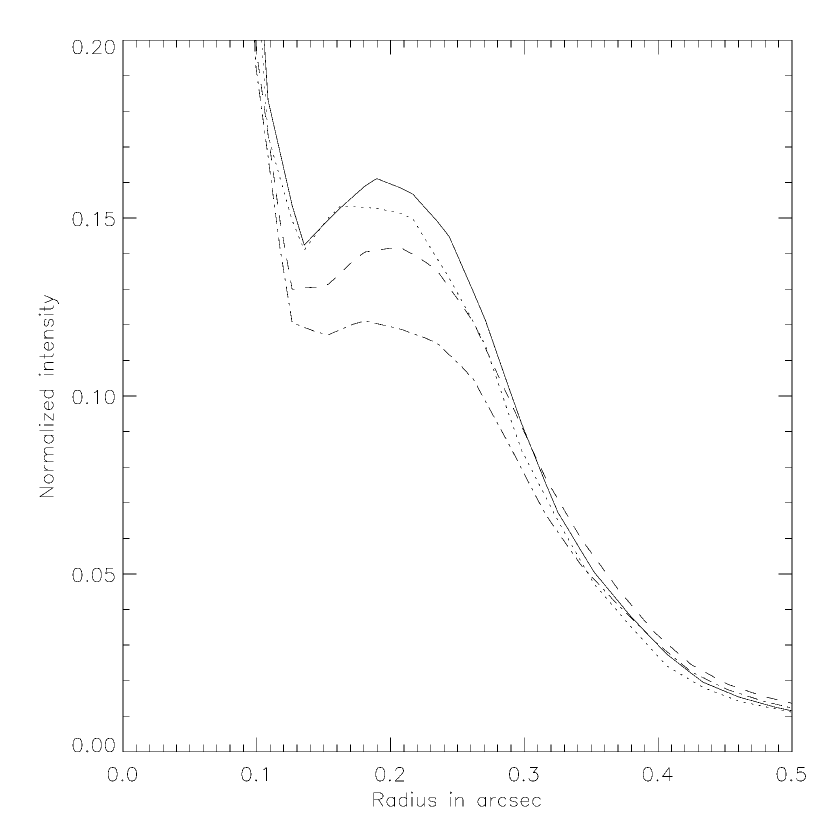
We carefully measured the photocenter of the two most prominent knots, C and D in the 3.74m images at position angles 300 and 352, respectively, although the extraction of the centers was hampered by the increasing brightness of the star (Martin et al., 2006) and Strehl ratio variations. The cuts through the clumps showing the variation of intensity vs distance at different times are in Figure 4. The normalized infrared flux appears to be decreasing from 2002 to 2005, although we emphasize that accurate photometry is difficult with the adaptive optics system. The decrease does not appear to be correlated with the 2003.5 event or orbital phase. One possibility for the apparent decrease in the IR flux is enhanced dust destruction in response to the increased stellar flux, although this will have to be verified.
The interpretation of the complex structure of the butterfly, with its large asymmetrical regions outlined by IR bright emission embedded in the Homunculus, is not straightforward. Chesneau et al. (2005) initially suggested that the emission rims of the butterfly wings are representative of an outflow along the polar axis projected onto the plane of the sky. Their 8.7m image shows bright rims and “dark” regions that correspond approximately with the wings in the NaCO images which they ascribe to minimal dust emission. Smith (2006) however demonstrated that the H2 spectroscopic emission that outlines the thin walls of the Homunculus does not penetrate to the star but appears to terminate at the IR bright edges of the dark structure seen in his 8.8m image. He therefore proposed that this structure is actually a disrupted equatorial torus in which the current equatorial stellar wind is clearing the equatorial plane of dust. Its complicated shape was then attributed to interaction with dusty clumps of different densities.
To further understand this peculiar structure, kinematic data is needed to measure or set limits on its expansion, age, and orientation within the Homunculus. In the next section we combine our NICI images with the comparable NaCO images obtained six to seven years earlier, to measure the projected motions of the knots and filaments that outline the butterfly.
4 Measurement of the Projected Motions
We registered all of the NaCO images (Ks, 4.05 and 3.74m) to the NICI K-band continuum image by first rotating the images to a common orientation and performing a first-order scaling based on the known relative plate scales of NICI and NaCO. The initial, relative positioning was done using the unsaturated core of the central star’s psf. The precise scale and rotation were then fine-tuned iteratively by maximizing the correlation of the high-pass images in an annular region between and from the star. This region contains structures that are visible in all of the NaCO and NICI images, but is sufficiently far from the butterfly to avoid the inner regions where we want to look for anomalous motions. Figure 5 shows the scale vs the date of the NaCO and NICI images. Using the scaling factors and the known pixel scales of NACO and NICI, we then derived the expansion rate and time since the eruption as a check on our procedure. Using data in the range to in all of the NaCO and NICI images, we find that the Homunculus lobes were ejected in . Using different image combinations, NaCO 3.74m with NICI, NaCO 4.05m with NICI, and the NaCO data only, we obtain similar results within of the above value. This result is consistent with Car’s great eruption (1838–1858) and previous determinations of the expansion of the lobes cited in §1.
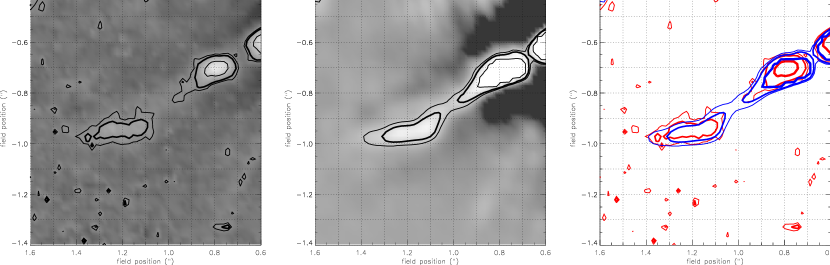
Using the registered high-pass NICI and the 2002.9 NaCO Ks image, we cross-correlated small regions. Since a sharp-edged sample region is very unsuitable for this operation, we employed instead a local Gaussian mask with an radius of 0.2. We measured motions relative to the co-moving grid that expands with the lobes, i.e., a value of zero corresponds to ejection date 1850. The cross-correlation was done in both spatial directions with shifts ranging from to . The width of each computed cell in the correlation datacube was . We use “cell” rather than “pixel” to avoid confusion with the original image pixels which were much smaller, see §2. Because of the Gaussian mask mentioned above, the cells are fuzzy and adjoining values are not mutually independent.
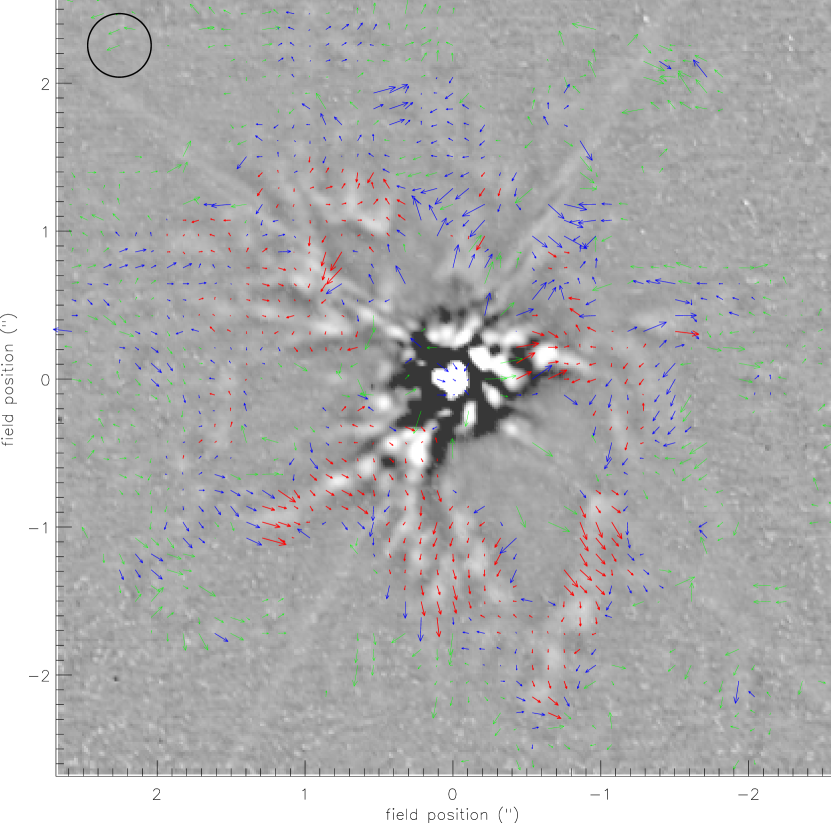
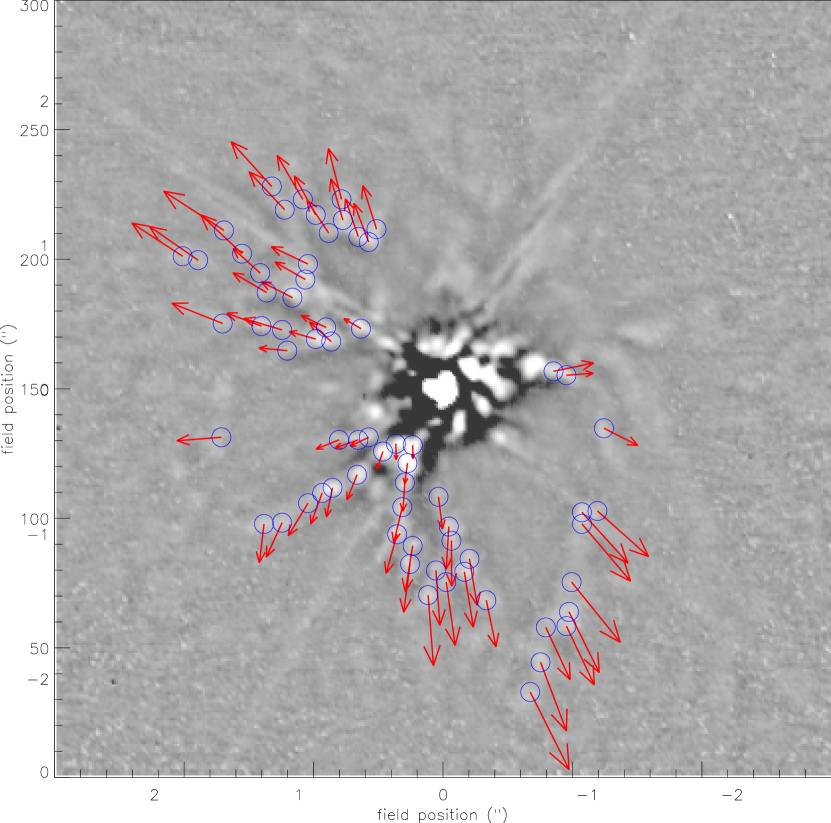
Figure 6 shows the resulting relative co-moving proper motion333Hereafter, we use motion or proper motion with the understanding that these are relative motions. vector field. At each location the correlation amplitude, to , indicates the validity of the result; a motion is considered valid if the maximum in correlation is greater then 0.4. As expected, the highest correlations coincide with strong spatial fine structures, and the periphery of the butterfly has many correlations above 0.8. We experimented with different pairings with the NaCO Ks image and obtained similar results for the high significance correlations. The 6 yr interval between the two images and the explored by the correlations pose an upper limit of /yr per axis on the proper motions. All of the high-correlation motions are safely below this limit; e.g., Figure 7 shows one elongated structure with a significant relative motion of /yr. The lower limit on what is measureable depends on how much structure there is in a given region; for many regions the 1 limit is 0.1 mas/yr. We used Monte Carlo simulations to estimate rms uncertainties, assuming that the error budget is dominated by statistical noise in the shallower NaCO images, estimated from the pixel-to-pixel standard deviation using a robust sigma measurement. For every correlation cell we adopt the rms error in 100 random trials as the local uncertainty in each component of the motion444Caveat: Obviously this does not include systematic errors, which cannot be quantified with the available information. Recall, also, that adjoining cells are not independent.. These statistical uncertainties are typically 0.1 to 0.2 mas/yr.
There are numerous knots, blobs and filamentary features in the vector map. Not all of them define the bright rims of the butterfly. For many of these we derived specific motions referring to the physical structures rather than cells in the grid. To determine the motions of the more recognizable structures we used a circular virtual aperture with parabolic weight function . (Again we must avoid sharp edges.) For each clear physical feature in the map, we first used the virtual aperture to measure a local centroid based on brightness. Then, centering the virtual aperture at that position, we refer to this weighted local set of cells as an aperture sample or just “aperture.” For each aperture sample we then determined the weighted mean of the motions for the included cells. Experimenting with aperture sizes, we found that the results changed little for ; therefore we adopted a diameter cell-widths. The dispersions in the mean motions for the cells in the apertures are larger than the weighted quadratic mean of the cells’ individual error estimates. This may be due to systematic effects. Consequently, we adopted the standard error of the mean motions for the error in each aperture. We retained only aperture samples whose weighted-average correlation amplitudes were greater than 0.8.
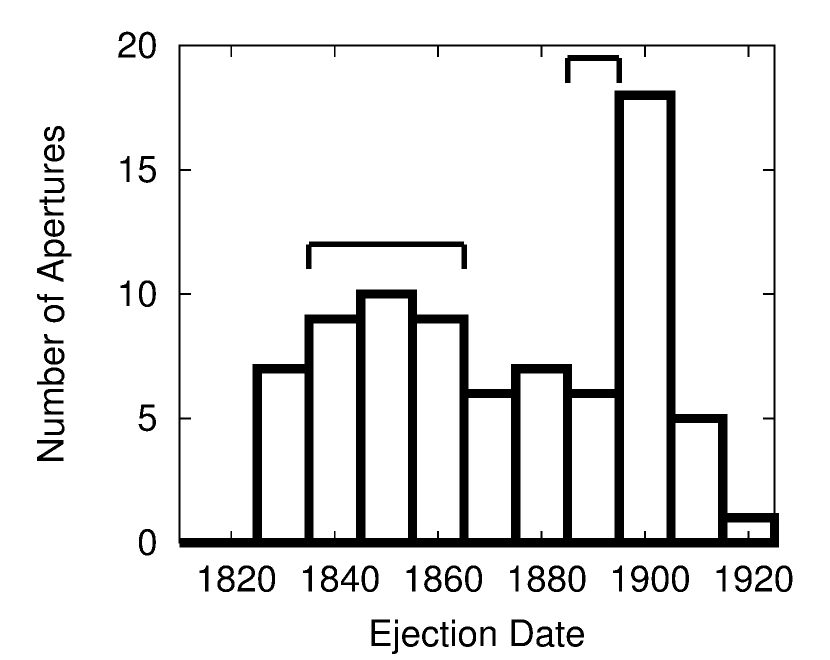
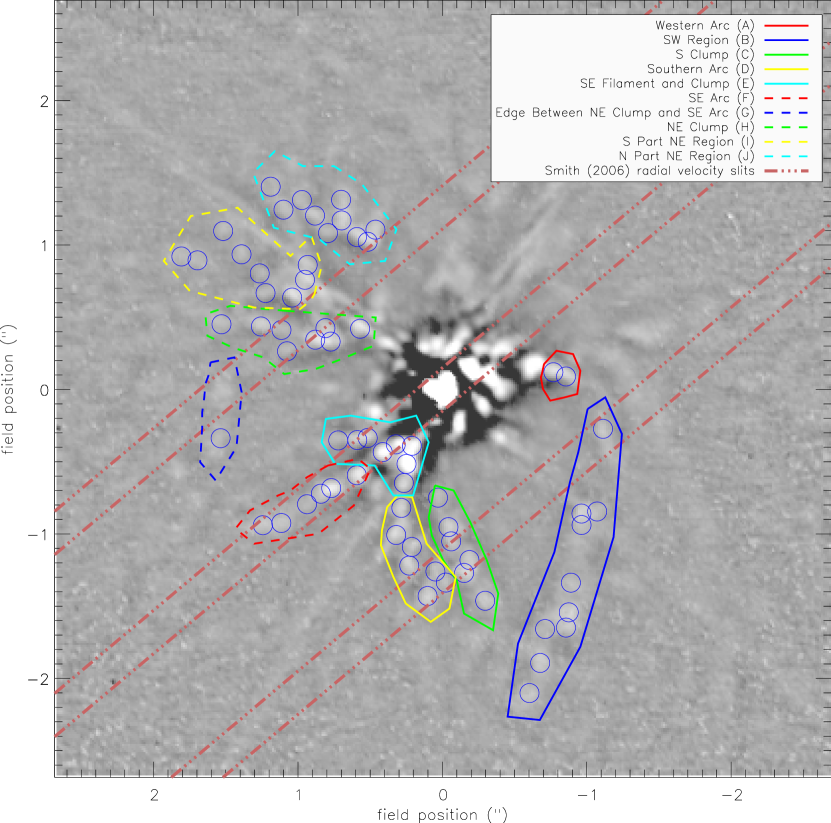
The results for the 67 high significance apertures including the angular distance of each aperture from the star, position angle, and weighted mean relative motion in R.A. and Dec in the co-moving reference frame with their standard errors are in the Appendix. Since the motions have been measured in the rest-frame of the expanding Homunculus, we have also calculated the intrinsic or true motions in the fixed grid, listed in the last two columns of the Appendix. The distribution of these apertures on an image of the butterfly is shown in Figure 8 with the vectors for the true or intrinsic projected motions. The corresponding velocities in the plane of the sky, at a distance of 2.3 kpc for Car (Davidson et al 2001, Smith 2002), are given in Table 2 with the epochs when the sub-structures, or knots or clumps, were ejected assuming uniform motion radially outward from the star. A histogram of the ejection epochs from the projected motions is shown in Figure 9. The names or designations of the larger regions used in Table 2 and shown in Figure 10 are adopted from Chesneau et al.(2005) and Smith et al. (2003).
Smith (2006) obtained long-slit spectroscopy of the H2 emission line at 2.1m across the Homunculus nebula, and three of the slits, SW1, NE1, and “star”, overlap the bright rims of the butterfly at five different positions shown in Figure 10. To determine the total space motion of the knots or sub-structures in these apertures, their spatial orientation, and therefore that of the bright rims of the butterfly, we used the corresponding radial (Doppler) velocities, measured relative to the Doppler velocity of Car, combined with the projected velocity from the proper motions at these five positions. The radial velocities for the apertures within the slits, their resulting total velocity relative to the star, the orientation angle relative to the plane of the sky, , linear distance from the star, and the corresponding ejection epoch are all included in Table 2 for the relevant apertures.
Throughout this paper we assume that the ejecta move radially outward from the central star, and that any apparent transverse motions are measurement errors. Angular momentum considerations make this a safe assumption; given the observed total speeds, off-center ejection in Car’s binary orbit would lead to transverse motions less than 0.1 mas yr-1 at AU.
5 Discussion – Expansion, Age, and Distribution of the Inner Ejecta
It is perhaps not surprising that the ejection epochs cluster around two dates, circa Car’s great eruption (1838 – 1858) and near 1900 corresponding to its second eruption (1887 – 1895); see Figure 9. Like many previous authors we find a date after 1895. However, acceleration at the 10% level is physically possible and may explain this discrepancy as noted by Davidson et al. (1997) (see also Smith et al. 2004).555Note also that in principle the emission center of a condensation could migrate outward faster than its center of mass, because the spatial distribution of excitation depends on the local UV flux and gas density. This effect is small, however, for any brightness peak that represents a real density maximum.
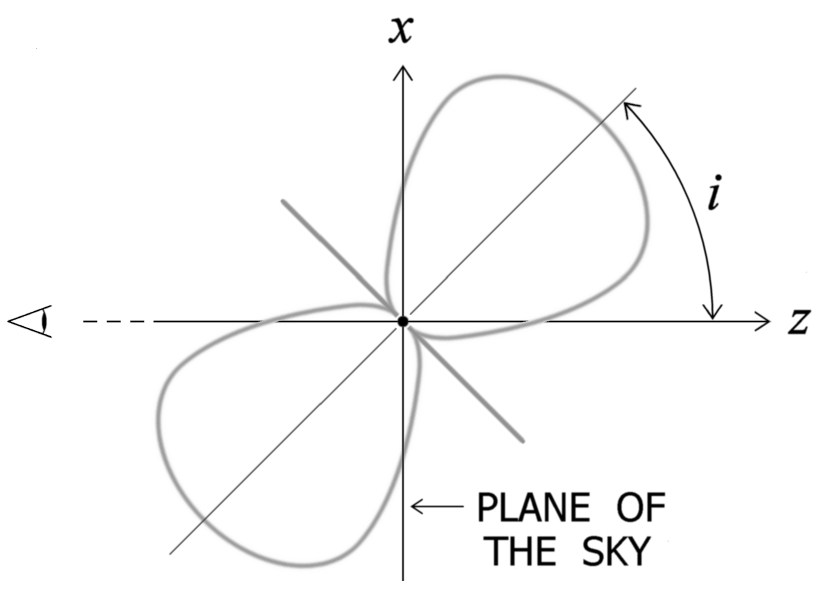
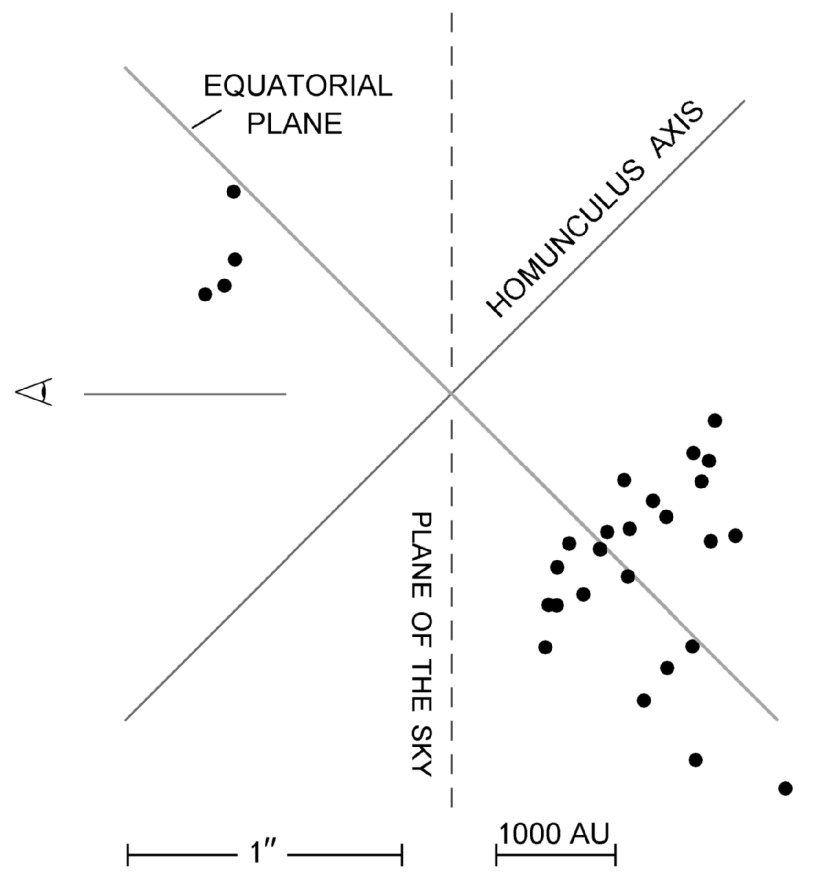
The orientation angle () relative to the plane of the sky has a wide range from positive to negative. Most of the sub-regions in Table 2, however, are projected away from us at angles from to . The equatorial plane (see the schematic diagram in Figure 11) is tilted away from us, behind the SE lobe, and toward us, projected in front of the NW lobe, at about 41. The clumps of knots moving away from us in the SE lobe thus appear to be distributed above and below the equatorial plane. Either the equatorial debris has a fairly wide opening angle of 20 or the material was ejected at somewhat different latitudes relative to the plane. Numerous knots or apertures within the larger regions have comparable ’s suggesting that the different projection angles are significant. There may also be some correlation between the ejection epoch and the orientation angle, although our information for is far from complete. For example, all of the knots with near 20 (S. Clump and S. Arc) and those with near 50 (SE Clump) have ejection dates corresponding to the second eruption, while those consistent with the great eruption have orientation angles closer to 40. Four of the sub-regions, apertures 3, 65, 66, and 67 in the “SW Region” and the “NE region”, are oriented towards us and are very likely due to material projected in front of the NW lobe ejected at the time of the great eruption.
The total space motions or velocities measured for several of the bright clumps or knots range from about 60 to 100 km s-1, much slower that the polar expansion of either the Homunculus at 600 km s-1 (see references in the Introduction)666There have been numerous measurements of the expansion of the Homunculus. See review by Davidson and Humphreys (1997) and references therein for the earlier work. or the little Homunculus at 300 km s-1 (Ishibashi et al. 2003, see also Smith 2005). However, material associated with the equatorial plane has been found to be expanding at a range of velocities (Davidson et al., 2001) including relatively slow moving ejecta near the star. Davidson et al. (2001) also concluded that that the equatorial debris consisted of material from the two eruption events. Zethson et al. (1999) reported slow moving gas projected in front of the NW lobe with radial velocities relative to the star of to km s-1, and presumably in the equatorial plane. The Weigelt knots, mentioned earlier, near the equatorial plane, are also slow moving, with radial velocities of km s-1 and an estimated ejection epoch of 1900.
Our results for the bright clumps and knots that define the apparent rim of the butterfly are thus consistent with results from previous work. They are slow moving, from two different eruptions, and near the equatorial plane, but projected away from the plane of the sky, 2000 to 4000 AU from the star. In Figure 12 we show the physical location of the separate clumps and filamentary features relative to the equatorial plane on a schematic diagram of the inner region of the Homunculus. The latitude or angle relative to the equatorial plane, , is also included in Table 2. Given the orientation and distances of the sub-regions from the star, most of them are on the far side of the Little Homunculus and are also very likely on the far side of the SE lobe. Figure 8 in Ishibashi et al. (2003) llustrates the complexity of this region, and also shows a cloud of debris within 1 of the star beyond the apparent boundaries of the Little Homunculus and bracketing the equatorial plane, similar to the spatial distribution of the sub-regions or clumps in the butterfly.
Smith (2006) suggested that the butterfly is part of a “disrupted torus,” related to a circular region where the two Homunculus lobes meet near the configuration’s midplane. This idea can probably be modified to be fairly consistent with the ejecta directions and two ejection epochs described above. On the other hand, our results are at least equally consistent with other possibilities. Modern investigations (including the work here) reveal complex asymmetry, not circular structure, in and around the equatorial plane where the lobes would meet in a simple picture. This is not very surprising, since there is no strong theoretical reason to expect either circular or latitudinal symmetry there. The central binary system is generally acknowledged to have a very eccentric orbit which obviously breaks the circular symmetry for outflows near periastron; in principle the star’s equatorial region is vulnerable to instabilities that may cause local and chaotic low-speed ejections (e.g., see remarks in §5 of (Zethson et al., 1999)). Furthermore, details of the large-scale Homunculus lobe shapes and orientations show that axial symmetry was only an approximation for the great eruption (Morse et al., 1998; Davidson et al., 2001), and large-scale radial “streamers” or “jets” well beyond the lobes have long been known in the images for some time (e.g., (Duschl et al. 1995, Meaburn et al. 1987, 1993, 1996). Given these diverse clues, we should not expect to represent the past or present equatorial region of the Homunculus in terms of two well-defined, intersecting, axially symmetric geometrical lobe-figures. Instead, the lobes appear to become ill-defined near the midplane. A large circular configuration around Car is worth considering, but there is no strong observational or theoretical evidence that such a structure exists or existed. Note that the famous “equatorial skirt” – located outside the inner region discussed here – consists of radial structures with no discernible circular symmetry.
In the absence of quantitative dynamical models, perhaps the simplest hypothesis is that either the unstable primary star can can eject matter asymmetrically, and/or ejections can occur near periastron when the companion star’s gravity and wind perturb the outflows asymmetrically. These phenomena would explain our observations (qualitatively, at least) wihout any concentration of pre-ejected material near the midplane. Moreover, in either case, local flows can be erratic and asymmetric relative to the midplane because they are very sensitive to unstable local conditions. These possibilities were implicit in some of the references cited above, but they are extremely difficult to model physically.
In summary, the appearance of the “butterfly nebula” as a single, coherent structure with multiple lobes or wings or as an equatorial torus, was thus due to projection effects and to low resolution in the earlier studies. Instead the knots or clumps of knots are separate, ejected primarily at two different epochs, and are apparently oriented within to of the equatorial plane, 2000 to 4000 AU from the star. They may be filamentary streamers or jet-like features associated with the equatorial debris on the far side of the SE lobe.
Appendix A Positions and Projected Motions for the Apertures
References
- Biller et al. (2004) Biller, B. A., Close, L., Lenzen, R., Brandner, W., McCarthy, D. W., Nielsen, E., & Hartung, M. 2004, Proc. SPIE, 5490, 389
- Chesneau et al. (2005) Chesneau, O., et al. 2005, A&A, 435, 1043
- Chun et al. (2008) Chun, M., et al. 2008, Proc. SPIE, 7015, 49
- Currie et al. (1996) Currie, D. G., Dowling, D. M., Shaya, E. J., Hester, J. J., The HST WF/Pc Instrument Definition Team, & The HST WFPC2 Instrument Definition Team 1996, The Role of Dust in the Format ion of Stars, 89
- Currie & Dowling (1999) Currie, D. G., & Dowling, D. M. 1999, in ASP Conf. Ser 179, “Eta Carinae at the Millenium”, ed. J. Morse, R. Humphreys & A. Damineli (San Francisco, ASP), p. 72
- Davidson et al. (1995) Davidson, K., Ebbets, D., Weigelt, G., Humphreys, R. M., Hajian, A. R., Walborn, N. R., & Rosa, M. 1995, AJ, 109, 1784
- Davidson et al. (1997) Davidson, K., Ebbets, D., Johansson, S., Morse, J. A., & Hamann, F. W. 1997, AJ, 113, 335
- Davidson & Humphreys (1997) Davidson, K., & Humphreys, R. M. 1997, ARA&A, 35, 1
- Davidson et al. (2001) Davidson, K., Smith, N., Gull, T. R., Ishibashi, K., & Hillier, D. J. 2001, AJ, 121, 1569
- Dorland et al. (2004) Dorland, B. N., Currie, D. G., & Hajian, A. R. 2004, AJ, 127, 1052
- Duschl et al. (1995) Duschl, W. J., Hofmann, K.-H., Rigaut, F., & Weigelt, G. 1995, Revista Mexicana de Astronomia y Astrofisica Conference Se ries, 2, 17
- Falcke et al. (1996) Falcke, H., Davidson, K., Hofmann, K.-H., & Weigelt, G. 199 6, A&A, 306, L17
- Ftaclas et al. (2003) Ftaclas, C., Martín, E. L., & Toomey, D. 2003, Brown Dwarfs, 211, 521
- Gaviola (1950) Gaviola, E. 1950, ApJ, 111, 408
- Humphreys et al. (1999) Humphreys, R. M., Davidson, K., & Smith, N. 1999, PASP, 111, 1124
- Ishibashi et al. (2003) Ishibashi, K., et al. 2003, AJ, 125, 3222
- Ishibashi (2005) Ishibashi, K. 2005, The Fate of the Most Massive Stars, 332, 131
- Lenzen et al. (2004) Lenzen, R., Close, L., Brandner, W., Biller, B., & Hartung, M. 2004, Proc. SPIE, 5492, 970
- Marois et al. (2005) Marois, C., Doyon, R., Nadeau, D., Racine, R., Riopel, M., Vallée, P., & Lafrenière, D. 2005, PASP, 117, 745
- Marois et al. (2006) Marois, C., Lafrenière, D., Macintosh, B., & Doyon, R. 2006, ApJ, 647, 612
- Martin et al. (2006) Martin, J. C., Davidson, K., & Koppelman, M. D. 2006, AJ, 132, 2717
- Meaburn et al. (1987) Meaburn, J., Wolstencroft, R. D., & W alsh, J. R. 1987, A&A, 181, 333
- Meaburn et al. (1993) Meaburn, J., Gehring, G., Walsh, J. R. , Palmer, J. W., Lopez, J. A., Bryce, M., & Raga, A. C. 1993, A&A, 276, L21
- Meaburn et al. (1996) Meaburn, J., Boumis, P., Walsh, J. R., Steffen, W., Holloway, A. J., Williams, R. J. R., & Bryce, M. 1996, MNRAS, 282, 1313
- Mehner et al. (2010) Mehner, A., Davidson, K., Ferland, G. J. & Humphreys, R. M., 2010, ApJ, 710, 729
- Morse et al. (1998) Morse, J. A., Davidson, K., Bally, J., Ebbets, D., Balick, B., & Frank, A. 1998, AJ, 116, 2443
- Morse et al. (2001) Morse, J. A., Kellogg, J. R., Bally, J., Davidson, K., Balick, B., & Ebbets, D. 2001, ApJ, 548, L207
- Polomski et al. (1999) Polomski, E. F., Telesco, C. M., Piña, R. K., & Fisher, R. S. 1999, AJ, 118, 2369
- Rigaut & Gehring (1995) Rigaut, F., & Gehring, G. 1995, Revist a Mexicana de Astronomia y Astrofisica Conference Series, 2, 27
- Ringuelet (1958) Ringuelet, A. E. 1958, ZAp, 46, 276
- Smith et al. (1995) Smith, C. H., Aitken, D. K., Moore, T. J. T., Roche, P. F., Pueter, R. C., & Pina, R. K. 1995, MNRAS, 273, 354
- Smith & Gehrz (1998) Smith, N., & Gehrz, R. D. 1998, AJ, 1 16, 823
- Smith et al. (1998) Smith, N., Gehrz, R. D., & Krautter, J. 1998, AJ, 116, 1332
- Smith & Gehrz (2000) Smith, N., & Gehrz, R. D. 2000, ApJ, 529, L99
- Smith & Davidson (2001) Smith, N., & Davidson, K. 2001, ApJ, 551, L101
- Smith et al. (2002) Smith, N., Gehrz, R. D., Hinz, P. M., Hoffmann, W. F., Mamajek, E. E., Meyer, M. R., & Hora, J. L. 2002, ApJ, 567, L77
- Smith (2002) Smith, N. 2002, MNRAS, 337, 1252
- Smith et al. (2003) Smith, N., Gehrz, R. D., Hinz, P. M., Hoffmann, W. F., Hora, J. L., Mamajek, E. E., & Meyer, M. R. 2003, AJ, 125, 1458
- Smith et al. (2004) Smith, N., et al. 2004, ApJ, 605, 405
- Smith (2005) Smith, N. 2005, MNRAS, 357, 1330
- Smith (2006) Smith, N. 2006, ApJ, 644, 1151
- Teodoro et al. (2008) Teodoro, M., Damineli, A., Sharp, R. G., Groh, J. H., & Barbosa, C. L. 2008, MNRAS, 387, 564
- Weigelt & Ebersberger (1986) Weigelt, G., & Ebersberger, J. 1986, A&A, 163, L5
- Weigelt et al. (1995) Weigelt, G., et al. 1995, Revista Mexicana de Astronomia y Astrofisica Conference Series, 2, 11
- Zethson et al. (1999) Zethson, T., Johansson, S., Davidson, K., Humphreys, R. M., Ishibashi, K., & Ebbets, D. 1999, A&A, 344, 211
| Filter | Channel | Central (m) | Width (m) |
|---|---|---|---|
| [Fe II] | Blue | 1.644 | 0.0247 |
| CH4 H 1% L | Red | 1.628 | 0.0174 |
| H2 1-0 S(1) | Blue | 2.124 | 0.0261 |
| Br-gamma | Blue | 2.169 | 0.0295 |
| Kcont | Red | 2.272 | 0.0352 |
| Region | Projected Vel | Origin | Doppler Vel | Total Vel | bbOrientation angle with respect to the plane of the sky. | DistanceddDistance from the star in AU at the inclination angle. | Origin | eeThe angle or latitude relative to the equatorial plane. |
|---|---|---|---|---|---|---|---|---|
| Ap. Number | (km s-1) | EpochaaFrom the total projected motion in the plane of the sky. | (km s-1) | (km s-1) | (deg) | (AU) | EpochccFrom the total space velocity. | (deg) |
| A: Western Arc | ||||||||
| 1 | 87.13.4 | 19028 | ||||||
| 2 | 57.25.8 | 183036 | ||||||
| B: SW Region | ||||||||
| 3 | 81.25.2 | 184820 | -525 | 96.76.0 | 32.93.4 | 3286 | 184517 | 2 |
| 4 | 145.73.7 | 19065 | ||||||
| 5 | 145.42.2 | 19113 | ||||||
| 6 | 159.82.6 | 19173 | ||||||
| 7 | 164.22.5 | 19033 | ||||||
| 8 | 144.22.0 | 18774 | ||||||
| 9 | 138.21.9 | 18654 | ||||||
| 10 | 122.71.1 | 18523 | ||||||
| 11 | 155.41.3 | 18712 | ||||||
| 12 | 184.62.2 | 18833 | ||||||
| C: S Clump | ||||||||
| 13 | 101.12.0 | 18546 | ||||||
| 14 | 100.21.8 | 18854 | 385 | 107.35.3 | 21.03.7 | 2807 | 188310 | 4 |
| 15 | 91.03.5 | 19028 | ||||||
| 16 | 68.92.6 | 19018 | ||||||
| 17 | 96.51.4 | 18983 | ||||||
| 18 | 119.42.0 | 18974 | 385 | 125.35.4 | 17.73.5 | 2945 | 18968 | 8 |
| D: Southern Arc | ||||||||
| 19 | 116.72.0 | 18984 | 385 | 122.75.4 | 18.03.5 | 2877 | 18968 | 13 |
| 20 | 135.71.7 | 19073 | 385 | 140.85.3 | 15.63.2 | 3032 | 19057 | 13 |
| 21 | 150.31.2 | 19102 | 385 | 155.05.1 | 14.93.0 | 3236 | 19086 | 17 |
| 22 | 103.20.7 | 18872 | ||||||
| 23 | 98.20.8 | 18952 | ||||||
| 24 | 86.41.6 | 18874 | ||||||
| 25 | 77.51.9 | 19005 | ||||||
| E: SE Clump and Filament | ||||||||
| 26 | 61.11.1 | 19014 | ||||||
| 27 | 44.31.7 | 18929 | ||||||
| 28 | 29.21.6 | 187814 | 485 | 56.25.3 | 58.72.5 | 1549 | 187614 | 18 |
| 29 | 33.62.2 | 188116 | 485 | 58.65.4 | 55.13.0 | 1608 | 187715 | 17 |
| 30 | 39.91.9 | 187412 | 485 | 62.45.3 | 50.02.9 | 1796 | 187014 | 8 |
| 31 | 43.82.2 | 187912 | 485 | 65.05.4 | 47.63.1 | 1773 | 187813 | 3 |
| 32 | 52.61.4 | 18867 | 485 | 71.25.2 | 42.42.9 | 1837 | 188511 | 1 |
| 33 | 52.31.9 | 186211 | 485 | 71.05.4 | 42.53.1 | 2214 | 185914 | 1 |
| F: SE Arc | ||||||||
| 34 | 57.51.4 | 18697 | 485 | 74.95.2 | 39.92.9 | 2218 | 186613 | 12 |
| 35 | 63.31.3 | 18487 | 485 | 79.45.2 | 37.23.0 | 2685 | 184614 | 1 |
| 36 | 70.41.7 | 18527 | 485 | 85.25.3 | 34.33.2 | 2811 | 185013 | 7 |
| 37 | 80.71.5 | 18576 | 485 | 93.95.2 | 30.73.1 | 3022 | 185412 | 13 |
| 38 | 80.22.9 | 182513 | 485 | 93.55.8 | 30.93.6 | 3618 | 182216 | -11 |
| 39 | 82.93.0 | 181714 | 485 | 95.85.8 | 30.13.6 | 3880 | 181417 | 5 |
| G: East Edge Connecting SE Arc and NE Region | ||||||||
| 40 | 95.01.1 | 18384 | ||||||
| H: NE Clump | ||||||||
| 41 | 116.11.1 | 18633 | ||||||
| 42 | 78.81.4 | 18306 | 585 | 97.85.2 | 36.42.5 | 3685 | 182713 | 10 |
| 43 | 85.32.5 | 18628 | 585 | 103.25.6 | 34.22.9 | 3199 | 186011 | 10 |
| 44 | 60.52.6 | 181716 | 585 | 83.85.6 | 43.82.9 | 3377 | 181516 | 14 |
| 45 | 58.51.1 | 18396 | 585 | 82.45.1 | 44.82.2 | 2949 | 183713 | 19 |
| 46 | 58.40.9 | 18435 | 585 | 82.35.1 | 44.82.1 | 2884 | 184013 | 22 |
| 47 | 61.94.3 | 186719 | ||||||
| 48 | 42.16.0 | 182751 | ||||||
| I: South side of NE Region | ||||||||
| 49 | 86.21.7 | 18486 | ||||||
| 50 | 74.71.1 | 18325 | 585 | 94.55.1 | 37.82.4 | 3521 | 182913 | 23 |
| 51 | 74.51.3 | 18336 | 585 | 94.45.2 | 37.92.4 | 3497 | 183013 | 19 |
| 52 | 82.91.7 | 18297 | ||||||
| 53 | 77.51.2 | 18026 | ||||||
| 54 | 120.91.8 | 18604 | ||||||
| 55 | 125.82.0 | 18455 | ||||||
| 56 | 128.81.3 | 18403 | ||||||
| 57 | 153.23.0 | 18775 | ||||||
| J: North side of NE Region | ||||||||
| 58 | 110.32.9 | 18448 | ||||||
| 59 | 128.32.3 | 18526 | ||||||
| 60 | 107.32.5 | 18437 | ||||||
| 61 | 94.42.2 | 18358 | ||||||
| 62 | 83.32.9 | 183112 | ||||||
| 63 | 111.71.2 | 18613 | ||||||
| 64 | 91.30.7 | 18432 | ||||||
| 65 | 85.31.6 | 18506 | -625 | 105.55.3 | 36.02.4 | 3524 | 184814 | 14 |
| 66 | 87.92.0 | 18626 | -625 | 107.65.4 | 35.12.5 | 3316 | 186013 | 12 |
| 67 | 96.75.0 | 186914 | -625 | 114.97.1 | 32.73.6 | 3388 | 186716 | 8 |
| Aperture | Dist. from | PAaaPosition angle measured from north through east. | Relative Proper Motion | Avg | HomunculusddThe radial expansion of the Homunculus at this position from the star. | True MotioneeThe relative motion corrected for the expansion of the Homunculus. | |||
|---|---|---|---|---|---|---|---|---|---|
| Number | Star (arcsec) | (deg) | RA (mas/yr) | Dec (mas/yr) | NbbNumber of cells included in the aperture. | SigccThe weighted average of the significance of the cells included in the aperture. | Exp. (mas/yr) | RA (mas/yr) | Dec (mas/yr) |
| 1 | 0.86 | -77.29 | -2.560.58 | 0.460.17 | 8 | 0.93 | 5.39 | -7.820.58 | 1.640.17 |
| 2 | 0.94 | -80.21 | 0.600.78 | -0.630.69 | 6 | 0.93 | 5.92 | -5.230.78 | 0.380.69 |
| 3 | 1.20 | -99.73 | 0.770.12 | -2.090.92 | 8 | 0.84 | 7.53 | -6.650.12 | -3.360.92 |
| 4 | 1.38 | -124.15 | -2.780.35 | -4.010.56 | 7 | 0.90 | 8.70 | -9.980.35 | -8.890.56 |
| 5 | 1.30 | -127.36 | -2.450.13 | -4.900.38 | 7 | 0.92 | 8.19 | -8.960.13 | -9.880.38 |
| 6 | 1.35 | -130.02 | -2.980.18 | -5.710.43 | 7 | 0.91 | 8.50 | -9.490.18 | -11.170.43 |
| 7 | 1.59 | -142.85 | -3.430.37 | -3.710.25 | 7 | 0.89 | 10.03 | -9.480.37 | -11.710.25 |
| 8 | 1.75 | -147.30 | 0.050.15 | -2.580.33 | 8 | 0.92 | 11.00 | -5.900.15 | -11.840.33 |
| 9 | 1.83 | -149.59 | 0.400.20 | -1.530.27 | 7 | 0.91 | 11.52 | -5.430.20 | -11.460.27 |
| 10 | 1.77 | -153.81 | 0.150.12 | -0.200.16 | 7 | 0.89 | 11.15 | -4.770.12 | -10.200.16 |
| 11 | 1.97 | -157.71 | -0.340.10 | -1.900.20 | 9 | 0.91 | 12.37 | -5.030.10 | -13.340.20 |
| 12 | 2.14 | -161.66 | -3.360.38 | -2.360.07 | 7 | 0.85 | 13.46 | -7.590.38 | -15.140.07 |
| 13 | 1.44 | -165.25 | 0.420.17 | -0.340.33 | 7 | 0.90 | 9.04 | -1.880.17 | -9.080.33 |
| 14 | 1.14 | -166.95 | 0.130.05 | -2.090.31 | 7 | 0.93 | 7.16 | -1.490.05 | -9.070.31 |
| 15 | 0.89 | -172.76 | 1.210.10 | -2.770.62 | 7 | 0.94 | 5.60 | 0.510.10 | -8.330.62 |
| 16 | 0.68 | -176.65 | -0.530.41 | -1.980.23 | 6 | 0.61 | 4.30 | -0.780.41 | -6.270.23 |
| 17 | 0.99 | -172.40 | 0.780.16 | -2.710.19 | 8 | 0.93 | 6.20 | -0.040.16 | -8.850.19 |
| 18 | 1.22 | -169.59 | -0.360.14 | -3.240.33 | 7 | 0.94 | 7.69 | -1.750.14 | -10.810.33 |
| 19 | 1.19 | -178.95 | -0.660.17 | -3.200.33 | 8 | 0.92 | 7.48 | -0.790.17 | -10.680.33 |
| 20 | 1.27 | -175.76 | -1.160.10 | -4.330.29 | 8 | 0.93 | 8.02 | -1.750.10 | -12.330.29 |
| 21 | 1.36 | 178.64 | -1.240.08 | -5.170.20 | 7 | 0.92 | 8.58 | -1.030.08 | -13.750.20 |
| 22 | 1.16 | 172.11 | 0.240.07 | -2.170.09 | 6 | 0.93 | 7.30 | 1.240.07 | -9.390.09 |
| 23 | 1.03 | 172.10 | 0.560.04 | -2.500.14 | 6 | 0.92 | 6.45 | 1.440.04 | -8.890.14 |
| 24 | 0.97 | 165.09 | 0.580.13 | -1.730.26 | 7 | 0.89 | 6.10 | 2.150.13 | -7.630.26 |
| 25 | 0.78 | 164.06 | 0.340.24 | -2.200.23 | 9 | 0.88 | 4.89 | 1.680.24 | -6.910.23 |
| 26 | 0.61 | 161.24 | -0.830.12 | -1.970.15 | 7 | 0.92 | 3.82 | 0.400.12 | -5.590.15 |
| 27 | 0.48 | 158.17 | -0.590.08 | -1.250.29 | 7 | 0.96 | 3.00 | 0.530.08 | -4.030.29 |
| 28 | 0.35 | 156.25 | -0.970.24 | -0.670.16 | 7 | 0.91 | 2.20 | -0.080.24 | -2.680.16 |
| 29 | 0.40 | 140.81 | -1.640.37 | -1.150.11 | 7 | 0.87 | 2.49 | -0.070.37 | -3.080.11 |
| 30 | 0.50 | 136.63 | -0.950.26 | -1.190.22 | 7 | 0.91 | 3.12 | 1.190.26 | -3.460.22 |
| 31 | 0.52 | 120.74 | 0.800.34 | -0.060.18 | 6 | 0.87 | 3.28 | 3.620.34 | -1.740.18 |
| 32 | 0.59 | 118.35 | 1.280.19 | 0.200.17 | 7 | 0.90 | 3.73 | 4.560.19 | -1.570.17 |
| 33 | 0.71 | 113.46 | 0.380.31 | -0.010.15 | 7 | 0.86 | 4.44 | 4.460.31 | -1.780.15 |
| 34 | 0.74 | 135.01 | 1.300.23 | -1.610.10 | 8 | 0.95 | 4.64 | 1.980.23 | -4.890.10 |
| 35 | 0.93 | 131.20 | -3.240.22 | -1.820.10 | 7 | 0.96 | 5.87 | 1.180.22 | -5.690.10 |
| 36 | 1.01 | 130.18 | -2.650.24 | -1.960.19 | 7 | 0.94 | 6.38 | 2.220.24 | -6.070.19 |
| 37 | 1.13 | 129.86 | -1.590.24 | -1.770.15 | 7 | 0.90 | 7.09 | 3.850.24 | -6.320.15 |
| 38 | 1.35 | 129.26 | -3.490.51 | -1.300.10 | 7 | 0.89 | 8.50 | 3.090.51 | -6.680.10 |
| 39 | 1.46 | 126.55 | -6.470.51 | -2.080.16 | 8 | 0.86 | 9.18 | 0.910.51 | -7.550.16 |
| 40 | 1.49 | 100.34 | -0.510.08 | 1.010.17 | 6 | 0.84 | 9.35 | 8.690.08 | -0.670.17 |
| 41 | 1.55 | 70.35 | 0.700.20 | 0.660.06 | 7 | 0.87 | 9.77 | 9.900.20 | 3.940.06 |
| 42 | 1.29 | 66.91 | -0.720.23 | -0.660.09 | 7 | 0.92 | 8.14 | 6.770.23 | 2.530.09 |
| 43 | 1.15 | 65.23 | 0.920.42 | -0.790.16 | 6 | 0.93 | 7.25 | 7.500.42 | 2.240.16 |
| 44 | 1.06 | 71.62 | -0.820.46 | -1.580.09 | 7 | 0.80 | 6.69 | 5.530.46 | 0.530.09 |
| 45 | 0.91 | 62.92 | 0.070.14 | -1.170.13 | 7 | 0.96 | 5.73 | 5.170.14 | 1.440.13 |
| 46 | 0.89 | 56.25 | 0.190.14 | -0.800.06 | 7 | 0.95 | 5.59 | 4.840.14 | 2.300.06 |
| 47 | 0.81 | 60.32 | -0.210.10 | 1.290.76 | 7 | 0.83 | 5.08 | 4.210.10 | 3.810.76 |
| 48 | 0.70 | 45.56 | 0.170.41 | -1.141.00 | 7 | 0.96 | 4.43 | 3.330.41 | 1.961.00 |
| 49 | 1.27 | 42.79 | 1.710.19 | -2.490.24 | 7 | 0.86 | 8.01 | 7.150.19 | 3.390.24 |
| 50 | 1.21 | 46.76 | 0.380.19 | -1.820.08 | 8 | 0.86 | 7.63 | 5.940.19 | 3.410.08 |
| 51 | 1.20 | 53.96 | -0.020.22 | -1.360.07 | 7 | 0.87 | 7.58 | 6.100.22 | 3.100.07 |
| 52 | 1.37 | 57.44 | -0.700.20 | -0.810.24 | 8 | 0.94 | 8.62 | 6.570.20 | 3.830.24 |
| 53 | 1.48 | 53.85 | -2.230.18 | -0.690.12 | 8 | 0.89 | 9.28 | 5.260.18 | 4.790.12 |
| 54 | 1.66 | 52.73 | -0.210.23 | 1.290.23 | 7 | 0.83 | 10.41 | 8.080.23 | 7.600.23 |
| 55 | 1.89 | 59.35 | -0.740.28 | 0.510.21 | 7 | 0.83 | 11.88 | 9.490.28 | 6.570.21 |
| 56 | 2.00 | 60.32 | -1.020.19 | 0.250.15 | 8 | 0.85 | 12.55 | 9.890.19 | 6.470.15 |
| 57 | 1.86 | 51.14 | 2.700.48 | 0.330.21 | 6 | 0.85 | 11.67 | 11.790.48 | 7.660.22 |
| 58 | 1.67 | 38.10 | 0.470.16 | -0.880.49 | 7 | 0.85 | 10.48 | 6.940.16 | 7.370.49 |
| 59 | 1.85 | 37.22 | 0.890.30 | -0.560.29 | 7 | 0.84 | 11.63 | 7.930.30 | 8.700.29 |
| 60 | 1.65 | 33.17 | -0.680.24 | -0.120.37 | 7 | 0.88 | 10.36 | 4.990.24 | 8.550.37 |
| 61 | 1.51 | 32.52 | -0.940.23 | -0.400.33 | 7 | 0.92 | 9.49 | 4.160.23 | 7.600.33 |
| 62 | 1.36 | 32.07 | -0.330.33 | -0.850.42 | 8 | 0.93 | 8.53 | 4.210.33 | 6.380.42 |
| 63 | 1.52 | 24.55 | -1.400.16 | 1.240.15 | 8 | 0.91 | 9.54 | 2.560.16 | 9.920.15 |
| 64 | 1.39 | 26.87 | -1.630.08 | 0.230.10 | 7 | 0.92 | 8.76 | 2.330.08 | 8.050.10 |
| 65 | 1.24 | 24.87 | -0.740.27 | 0.320.13 | 7 | 0.94 | 7.80 | 2.540.27 | 7.400.13 |
| 66 | 1.18 | 22.27 | 0.050.28 | 0.640.22 | 8 | 0.93 | 7.45 | 2.880.28 | 7.530.22 |
| 67 | 1.24 | 18.51 | 0.180.31 | 1.050.84 | 7 | 0.92 | 7.82 | 2.660.31 | 8.460.84 |