The origin of peak-offsets in weak-lensing maps
Abstract
Centroid positions of peaks identified in weak lensing mass maps often show offsets with respect to other means of identifying halo centres, like position of the brightest cluster galaxy or X-ray emission centroid. Here we study the effect of projected large-scale structure (LSS), smoothing of mass maps, and shape noise on the weak lensing peak positions. Additionally we compare the offsets in mass maps to those found in parametric model fits. Using ray-tracing simulations through the Millennium Run -body simulation, we find that projected LSS does not alter the weak-lensing peak position within the limits of our simulations’ spatial resolution, which exceeds the typical resolution of weak lensing maps. We conclude that projected LSS, although a major contaminant for weak-lensing mass estimates, is not a source of confusion for identifying halo centres. The typically reported offsets in the literature are caused by a combination of shape noise and smoothing alone. This is true for centroid positions derived both from mass maps and model fits.
keywords:
galaxies: clusters: general – gravitational lensing: weak1 Introduction
Weak gravitational lensing is one of the most important tools to study clusters of galaxies. Its sensitivity to both luminous and dark matter is a distinct advantage over other methods. Observations of a clusters’ tidal shear field imprinted on the observed ellipticities of faint background galaxies allow for “parameter-free” mass reconstructions (see e.g. Kaiser & Squires, 1993; Seitz & Schneider, 2001 for methods, and Clowe & Schneider, 2001, 2002; Dietrich et al., 2009; Israel et al., 2010 for applications). Such two-dimensional maps often show offsets between the position of the observed peaks in surface mass density and other indications of a galaxy cluster’s centre, like the position of the brightest cluster galaxy or the centroid of the X-ray emission (e.g., Dietrich et al., 2005; Wittman et al., 2006; Okabe et al., 2010). Such offsets can be of either astrophysical origin or caused by random or systematic noise. An example of the latter could be missing data due to bright stars or other masked image defects.
Two examples of clusters where the observed separation between weak-lensing and X-ray centroid has been attributed to astrophysical causes are the “Bullet Cluster” (Clowe et al., 2006a) and MACS J0025.41222 (Bradač et al., 2008). These are systems in which high-speed collisions separated the collisionless dark-matter and galaxy components from the collisional intra-cluster medium.
In other cases the spatial discrepancy has been determined to be consistent with the centroid shifts induced by the shape noise of the background galaxies (e.g., Clowe et al., 2006b). It has also been noted that the observed centroid offsets depend on the halo concentration, with more centrally concentrated halos showing smaller offsets in convergence maps (2010ApJ...719.1408F).
Weak lensing is susceptible to the entire mass along the line-of-sight and it is now well established that projected large-scale structure (LSS) and halo triaxiality are significant contributions to the total error budget in weak-lensing mass estimates of galaxy clusters (Hoekstra, 2001, 2003; 2011MNRAS.412.2095H; Dodelson, 2004; Becker & Kravtsov, 2010; Corless & King, 2007). In addition to influencing weak-lensing mass-estimates, irregular halo shapes and projected LSS could potentially shift the centroids of the observed surface mass density distribution away from the true halo centre. We will summarily refer to these effects as projected LSS throughout this work. E.g., Lombardi et al. (2005) speculated that the projection of groups close to the line-of-sight might be the cause for the or kpc offset they observed between the weak lensing and optical/X-ray centroids of RCDS . Our aim in this paper is to study the importance of this effect and its relative importance to centroid shifts induced by shape noise and the inevitable smoothing in mass reconstructions. Knowledge of all these effects is required to make robust statements about the nature and astrophysical significance of observed peak offsets.
The outline of the paper is as follows. We describe the simulations and how we identified weak lensing peaks in them in Sect. 2. We present the results of matching halo centres to lensing peak positions in Sect. 3. Finally, we summarise and discuss our findings in Sect. 4. We use standard lensing notation throughout (e.g. Schneider, 2006).
2 Methods
To study the spatial offsets between halo centre and lensing peak position, we simulated weak-lensing observations of galaxy clusters using -body and ray-tracing simulations. We used the Millennium Run (MR, Springel et al., 2005) simulation. The MR is a large dark matter -body simulation with particles in a Mpc box simulating structure formation from to the present epoch in a flat CDM Universe. The assumed cosmological parameters are: a matter density , a cosmological constant with energy density , a Hubble constant of (in units of ), and an initial density power spectrum normalisation . The Plummer equivalent smoothing scale in the MR is kpc.
Cluster halos in the MR were identified by a friend-of-friends algorithm. Cluster centres were identified with the position of the minimum of the gravitational potential. Cluster masses were obtained by measuring the mass inside spheres around the cluster centre with mean density 200 times the critical cosmic density.
The ray-tracing algorithm described in Hilbert et al. (2009) was used to calculate the apparent positions of the cluster centres and the convergence in 512 fields of view. In these simulations, the matter distribution is created by periodic continuations of the simulation boxes at increasing redshifts to create backward light cones. Matter is divided into slices of thickness Mpc perpendicular to the line-of-sight and angled with respect to the box sides to avoid the repetition of structures along the line-of-sight. Light rays are shot from redshift zero to through these lens planes. The solid angle subtended by these simulations is small enough to neglect the effects of sky curvature.
The products of these ray-tracing simulations are noise-free maps of the dimensionless surface mass-density and complex shear . This noise-free case allows us to study the impact of LSS projections alone, without being affected by smoothing and shape noise, which are always present in mass reconstructions derived from astronomical observations.
2.1 Mass maps
Already Kaiser & Squires (1993) noted that a mass reconstruction obtained from an unfiltered shear field would have infinite variance. Smoothing the shear field with a low-pass filter suppresses the noise but also amounts to a smoothing of the reconstructed field. For a Gaussian filter the variance in is (Kaiser & Squires, 1993)
| (1) |
where is the intrinsic 2-d ellipticity dispersion and the number density of background galaxies. This smoothing also leads to correlated noise in the mass reconstruction. The noise power spectrum is given by (Lombardi & Bertin, 1998)
| (2) |
The noise on large fields is rotation and translation invariant, and therefore the covariance between modes at different is zero. Maps of correlated noise were created by drawing independent complex Gaussian random variables with variance given by eq. (1) and applying an inverse Fourier transform to the arrays created in this way.
In this work we used three values for the number density of background galaxies and two smoothing scales . The two smaller number densities correspond roughly to typical ground-based observations with m to m class telescopes (e.g., Dietrich et al., 2007; Okabe et al., 2010), while the higher number density represents space-based data (e.g., Clowe et al., 2006a). The large smoothing scale was used for the lowest number density, while the small smoothing scale was applied in the case of the two larger number densities.
Peaks in -maps were detected with a connected-component labelling of pixels above a detection threshold. We used the 8-connectivity, i.e., we consider all pixels that are connected via the sides, edges, or corners of a square as one structure. Additionally, we imposed the condition that each peak must have at least 3 pixels above the detection threshold. The pixel with the highest value is considered to be the peak location. We compared this peak location to the one derived by SExtractor’s (Bertin & Arnouts, 1996) fit of a bivariate Gaussian. The two methods give results that generally agree to within a fraction of pixel. This deviation is too small to be a concern for us. Halos were then matched to their nearest neighbour in the list of detected peaks. All halos with a mass of more than and were considered in this matching.
2.2 Shear catalogues and model fits
Often weak-lensing studies of clusters include parametric model fits to the tangential shear profiles (e.g., Dietrich et al., 2009; Okabe et al., 2010), in which the centroid position can be treated as free parameters (e.g., Oguri et al., 2010). Since no smoothing is applied to the shear field, shape noise and LSS projections are the only source of noise. To compare with the centroid positions obtained from mass maps, we created mock catalogues of galaxies with number densities arcmin-2 and intrinsic ellipticities drawn from a Gaussian with 2-dimensional ellipticity dispersion , truncated at . The reduced shear , computed from the ray-tracing, was applied to these intrinsic ellipticities using the standard relation (1997A&A...318..687S)
| (3) |
where the asterisk denotes complex conjugation, and the superscript denotes intrinsic source properties.
We fitted NFW (1997ApJ...490..493N) models to the shear estimated from the galaxy catalogue within a radius of around the halo centre positions. We fixed the NFW concentration parameter to follow the 2004A&A...416..853D mass-concentration relation, leaving three free parameter, the halo centre and the halo mass . Fits were performed using the maximum likelihood estimator of 2000A&A...353...41S.
3 Results
3.1 Noise-free case
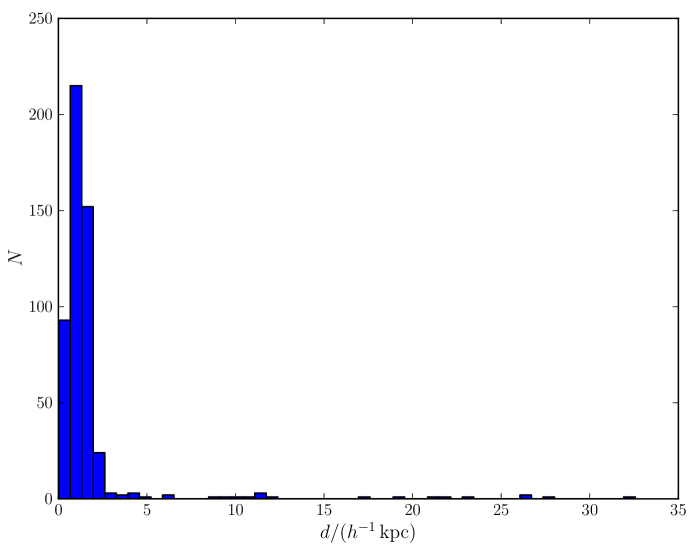
Figure 1 shows the apparent and physical offsets between centres of halos and associated peak positions in noise free -maps. While the matching between halos and lensing peaks was performed for all cluster sized halos at redshifts below as described in the previous section, we made a redshift dependent mass cut in the selection of halos that enter our comparison. We selected a fiducial minimum cluster mass of at redshift . The minimum mass is governed by the lensing efficiency and scales with the halo redshift as
| (4) |
where is the angular diameter distance between two redshifts, and is the redshift of the background source population. Here the background sources were assumed to be at a single redshift , which is the redshift of the first lens plane at .
Obviously, almost all lensing peaks are projected to the immediate vicinity of the halo centre. Virtually no associations are made on scales , which are beyond the resolution limit of the Millennium Run simulation. Visual inspection of the few large-distance matches confirmed that their large offsets are not caused by LSS projections. They are undetected halos erroneously matched to a nearby lensing peak or their surface mass density signal was merged into a double peaked structure when it overlapped with a more significant foreground or background object. Our peak finder does not attempt to deblend such objects into multiple peaks, although a human observer would correctly identify the smaller peak as caused by the halo. Thus, we do not consider these cases to be LSS projections for the purpose of this work. Furthermore, in optical multi-colour data, both clusters would be readily identifiable as separate entities.
While a source redshift of is typical for the mean redshift of targeted ground-based lensing observations, the tail of the redshift distribution extends to higher values, and space based observations have the potential to probe LSS at significantly higher redshifts. We therefore matched the same set of halos to convergence peaks detected in maps with a single source plane at , the highest redshift in our ray-tracing simulations, in an effort to maximise the impact of LSS projections.
The result is virtually unchanged. The percentile increases from kpc to kpc and a few more halos have barely resolved offsets, but still 478 out of the 512 halos have offsets of less than kpc, down from 503 in the case of the lower source redshift.
3.2 Smoothing and shape noise
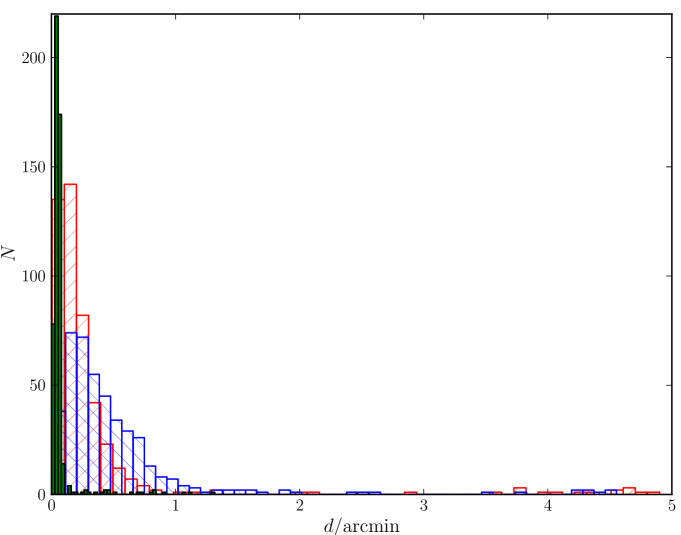
We now turn to the influences of smoothing and shape noise. The effect of smoothing is shown in Fig. 2. () halos fulfilling our selection criterion in eq. (4) could be matched to peaks detected in -maps smoothed with Gaussians of width () within a distance of . Again, the vast majority of large separation pairs in the tail of the distribution is due to erroneous associations. Ignoring outliers at , we find that almost 90% of all associations are made within one half of the smoothing scale. The observed offsets are, however, significantly larger than in the absence of smoothing, as is shown by the comparison with the unsmoothed case in Fig. 2. Thus, smoothing alone, without the added influence of shape noise, causes shifts of centroid positions with respect to the halo centres.
We summarise properties of the offset distributions in Table 1. Here the mode of the distributions is estimated from the maximum of a Gaussian kernel density estimate of the offset distribution. It is worth pointing out that for one-sided distributions whose mode is very close to zero, this method has a systematic bias towards higher values. Nevertheless, the values we find are generally in good agreement with naive mode estimates obtained from looking at the histogram plots, with the exception of the LSS only case. All other quantities are computed directly from the measured offsets.
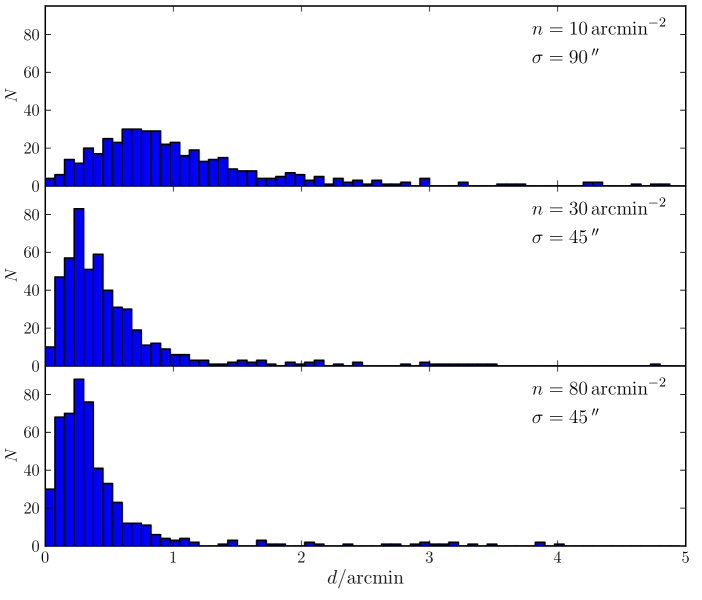
Finally, Fig. 3 shows the observed offsets in smoothed maps with shape noise added. As described in Sect. 2, we assumed combinations of number densities and smoothing scales of . As one would expect, the apparent offsets are larger than in the noise free case. The distribution’s mode roughly triples for and approximately doubles for arcmin-2. The distributions also have noticeably longer tails than in the noise free case. Again, the distribution properties are summarised in Table 1.
3.3 NFW model fits
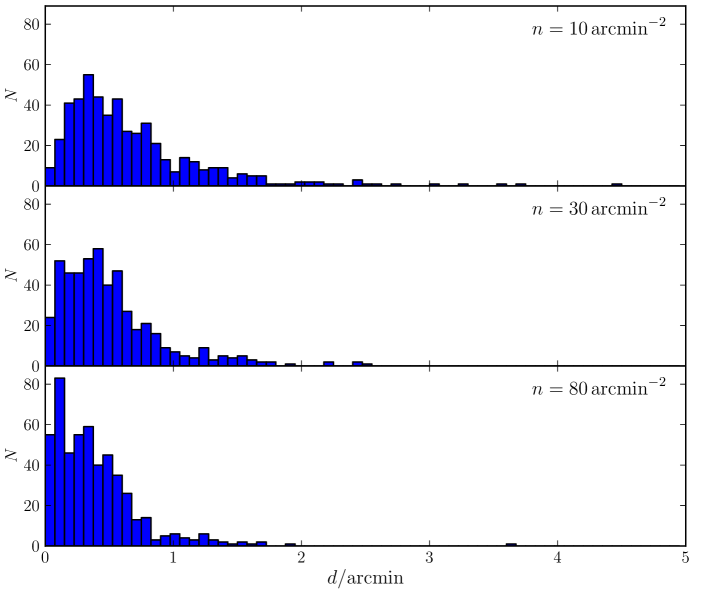
The centroid offset distributions obtained from fitting NFW models to the shear catalogues, as described in section 2.2, are shown in Fig. 4 and the distribution properties are summarised in Table 1. The offsets are smaller than those observed in -maps for the low number density case only. For arcmin-2 the offsets are comparable, if not slightly worse than in noisy mass maps.
| mode/ | mean/ | ||||
| LSS only | |||||
| 0 | 9 | 4 | 5 | 9 | |
| Smoothed maps | |||||
| 45 | 8 | 13 | 26 | 33 | |
| 90 | 14 | 25 | 48 | 59 | |
| Smoothing and shape noise | |||||
| 10 | 90 | 44 | 52 | 87 | 101 |
| 30 | 45 | 17 | 27 | 52 | 64 |
| 80 | 45 | 15 | 21 | 41 | 51 |
| NFW model fits | |||||
| 10 | 0 | 22 | 37 | 72 | 85 |
| 30 | 0 | 22 | 29 | 58 | 76 |
| 80 | 0 | 9 | 23 | 45 | 62 |
4 Summary and Discussion
We used ray-tracing simulations through the Millennium Run -body simulation to study the impact of projected large-scale structure on the observed peak positions of halos in weak-lensing maps. The main result of this work is that such projections do not lead to shifts of the maximum surface mass density away from the halo centre. This is true even for the extreme case of a single source redshift at . Thus, this is a robust result applicable to both ground- and deep space-based lensing observations. By making the mass selection in eq. (4) dependent only on the lensing efficiency in our mock survey, we neglected selection biases that will effect real galaxy cluster catalogues. Real clusters are often studied in detail precisely because they reveal striking lensing features, offsets between dark and luminous matter, or other unusual features. Furthermore, mergers, projections, and alignment of triaxial halos with the line-of-sight will inevitably boost low mass halos to appear to be above the mass selection. While this could in principle be a concern for the applicability of our results to a highly biased cluster sample, the virtually complete absence of significant offsets caused by LSS projections across our entire sample suggests that this is not a concern.
The negligible effect that LSS projections have is exemplified by the case of RCDS at , which we mentioned in the introduction. Its lensing centroid has an offset of . This corresponds to a projected distance of kpc and is significantly larger than any of the offsets seen in Fig. 1. Thus, this offset is most likely not caused by projected LSS. We emphasise that, although Table 1 suggests that an offset of is consistent with LSS projections at the confidence level, we see such large offsets only for lower redshift halos. The relevant comparison here is with the physical offsets reported in Fig. 1. This is supported by looking at the offsets caused by LSS as a function of redshift. We grouped the 512 halos into four equally large groups of increasing redshifts and report the median and 95th percentile of their respective offset distributions in Table 2. The median shows a slight increase with redshift but still well below the resolution of our simulations. The tails of the distributions show no clear trend. We conclude that the offsets caused by LSS are limited in physical scales to those scales that are much smaller than the redshift independent smoothing scale for all halos studied in this work.
| median/ kpc | 95%tile/ kpc | ||
|---|---|---|---|
| 0.07 | 0.34 | 1.1 | 10.5 |
| 0.34 | 0.46 | 1.6 | 6.6 |
| 0.46 | 0.58 | 1.8 | 3.4 |
| 0.58 | 0.93 | 2.1 | 5.6 |
Smoothing an asymmetric mass distribution with a symmetric kernel naturally leads to centroid shifts. We showed that these occur on scales less or equal to one half of the smoothing scale. Adding shape noise leads to additional, significantly larger offsets.
For typical shallow ground-based observations with number density and smoothing scale , the mode of the offset distribution is at and the mean of the distribution is at . These values are compatible with those found by blind searches for galaxy clusters (Gavazzi & Soucail, 2007; Schirmer et al., 2007; Geller et al., 2010). All these values were obtained by taking only those halos into account which could be matched to a weak-lensing peak within . Including the long tail of matches at larger separations of course leads to the inclusion of mostly spurious matches. The percentile of the full distribution is at , reproducing the result of Dietrich et al. (2007).
Obviously the offsets become smaller if a higher number density of background galaxies suppresses the shape noise. However, even with the depths achieved by current space-based data sets, the offsets are significantly larger than in the absence of shape noise. E.g., for arcmin-2 the mode of the offset distribution is at , almost twice as large as in the noise-free case where it is at . The situation is slightly better for the tail of the distribution where the 95th percentile is still larger by a factor of .
Our findings show that the significance of peak offsets can often be reliably estimated by bootstrapping from the shear catalogue, as it was e.g. done by Clowe et al. (2006a). Such a bootstrapping procedure does not include the systematic centroid shifts due to smoothing but this effect is often smaller than the offsets typically caused by shape noise. The resulting underestimation of offset distances can be rectified by taking into account that smoothing leads to additional offsets of up to half the smoothing scale at 90% confidence. Applying this to the example of the Bullet Cluster, we conclude that the contribution of smoothing is absolutely negligible and the bootstrapping procedure provided a reliable estimate of the offsets’ significances.
Oguri et al. (2010) studied the offsets of the weak lensing signal of 25 massive clusters in the LoCuSS sample from their brightest cluster galaxies (BCG). When comparing their results to our NFW model fits, it is important to remember that they have no knowledge of the true halo centre as we have in the MR but must instead rely on the BCG position as an estimate for the halo centre. This is subject to possible misidentifications of the BCG or displacements of the BCG with respect to the dark matter halo centre, as discussed in detail in Johnston et al. (2007). However, Oguri et al. conclude that their result is consistent with a fraction of clusters with BCG misidenitifications, in agreement with the work of Johnston et al. (2007). The remaining offsets are all smaller than . This is comparable to what we find in the middle panel of Fig. 4, which has approximately the same number density as the LoCuSS data set. However, our results also suggest that of all offsets are larger than . This could very well masquerade as BCG misidentifications, which should occur with the same frequency.
Acknowledgements
This work was initiated during a visit by JPD to ESO Garching. JPD would like to the thank the ESO visitor programme for support and the ESO staff for hospitality. JPD gratefully acknowledges support from NSF grant AST 0807304. We thank an anonymous referee for a number of comments and question that helped to improve this paper significantly, as well as Eduardo Rozo and Tim McKay for helpful comments on the draft version of this paper. SH and JH acknowledge support by the Deutsche Forschungsgemeinschaft within the Priority Programme 1177 under the project SCHN 342/6 and the Transregional Collaborative Research Centre TRR 33 “The Dark Universe”.
References
- Becker & Kravtsov (2010) Becker, M. R. & Kravtsov, A. V. 2010, arXiv:1011.1681
- Bertin & Arnouts (1996) Bertin, E. & Arnouts, S. 1996, A&AS, 117, 393
- Bradač et al. (2008) Bradač, M., Allen, S. W., Treu, T., et al. 2008, ApJ, 687, 959
- Clowe et al. (2006a) Clowe, D., Bradač, M., Gonzalez, A. H., et al. 2006a, ApJ, 648, L109
- Clowe & Schneider (2001) Clowe, D. & Schneider, P. 2001, A&A, 379, 384
- Clowe & Schneider (2002) Clowe, D. & Schneider, P. 2002, A&A, 395, 385
- Clowe et al. (2006b) Clowe, D., Schneider, P., Aragón-Salamanca, A., et al. 2006b, A&A, 451, 395
- Corless & King (2007) Corless, V. L. & King, L. J. 2007, MNRAS, 380, 149
- Dietrich et al. (2009) Dietrich, J. P., Biviano, A., Popesso, P., et al. 2009, A&A, 499, 669
- Dietrich et al. (2007) Dietrich, J. P., Erben, T., Lamer, G., et al. 2007, A&A, 470, 821
- Dietrich et al. (2005) Dietrich, J. P., Schneider, P., Clowe, D., Romano-Díaz, E., & Kerp, J. 2005, A&A, 440, 453
- Dodelson (2004) Dodelson, S. 2004, Phys. Rev. D, 70, 023008
- Gavazzi & Soucail (2007) Gavazzi, R. & Soucail, G. 2007, A&A, 462, 459
- Geller et al. (2010) Geller, M. J., Kurtz, M. J., Dell’Antonio, I. P., Ramella, M., & Fabricant, D. G. 2010, ApJ, 709, 832
- Hilbert et al. (2009) Hilbert, S., Hartlap, J., White, S. D. M., & Schneider, P. 2009, A&A, 499, 31
- Hoekstra (2001) Hoekstra, H. 2001, A&A, 370, 743
- Hoekstra (2003) Hoekstra, H. 2003, MNRAS, 339, 1155
- Hoekstra et al. (2010) Hoekstra, H., Hartlap, J., Hilbert, S., & van Uitert, E. 2010, arXiv:1011.1084
- Israel et al. (2010) Israel, H., Erben, T., Reiprich, T. H., et al. 2010, A&A, 520, A58
- Johnston et al. (2007) Johnston, D. E., Sheldon, E. S., Wechsler, R. H., et al. 2007, ArXiv e-prints
- Kaiser & Squires (1993) Kaiser, N. & Squires, G. 1993, ApJ, 404, 441
- Lombardi & Bertin (1998) Lombardi, M. & Bertin, G. 1998, A&A, 335, 1
- Lombardi et al. (2005) Lombardi, M., Rosati, P., Blakeslee, J. P., et al. 2005, ApJ, 623, 42
- Oguri et al. (2010) Oguri, M., Takada, M., Okabe, N., & Smith, G. P. 2010, MNRAS, 405, 2215
- Okabe et al. (2010) Okabe, N., Takada, M., Umetsu, K., Futamase, T., & Smith, G. P. 2010, PASJ, 62, 811
- Schirmer et al. (2007) Schirmer, M., Erben, T., Hetterscheidt, M., & Schneider, P. 2007, A&A, 462, 875
- Schneider (2006) Schneider, P. 2006, in Saas Fee Advanced Course 33: Gravitational Lensing: Strong, Weak and Micro, ed. P. Schneider, C. Kochanek, & J. Wambsganss
- Seitz & Schneider (2001) Seitz, S. & Schneider, P. 2001, A&A, 374, 740
- Springel et al. (2005) Springel, V., White, S. D. M., Jenkins, A., et al. 2005, Nature, 435, 629
- Wittman et al. (2006) Wittman, D., Dell’Antonio, I. P., Hughes, J. P., et al. 2006, ApJ, 643, 128