e-mail: lns@univ.kiev.ua††thanks: 64, Volodymyrs’ka Str., Kyiv 01601, Ukraine\sanitize@url\@emaile-mail: lns@univ.kiev.ua ††thanks: 150, Zabolotnyi Str., Kyiv 03143, Ukraine††thanks: 2, bd. 5, Academician Glushkov Ave., Kyiv 03022, Ukraine††thanks: 64, Volodymyrs’ka Str., Kyiv 01601, Ukraine\sanitize@url\@emaile-mail: lns@univ.kiev.ua
Vibrational spectra of berberine and their interpretation by means of DFT quantum-mechanical calculations
Abstract
Experimental vibrational spectra (Raman and infrared absorption) of berberine are obtained at room temperature. The vibrational spectra of berberine are calculated by the DFT method at the B3LYP/6-311++G(d,p) level. Based on the correlation between experimental and calculated data, the vibrational spectrum is interpreted in the frequency range of 800–1700 cm-1 in detail. The experimental and calculated spectra of intramolecular vibrations are found to correlate closely.
1 Introduction
Natural alkaloid berberine has been used in medicine for a long time for treating a number of diseases. Preparations of berberine have been found to have cytotoxic, bactericidal, and antiviral effects [1]. Moreover, berberine influences the cancer cell metabolism by destroying cells irreversibly. Such activity of the alkaloid is attributed to its ability to intercalate into the DNA macromolecule by blocking the processes of replication and transcription. Many articles are devoted to the interaction between berberine and nuclei acids, see, e.g., reviews [1,2]. Another important target for antitumour berberine agents is DNA-topoisomerase: berberine can inhibit topoisomerase, by breaking the connection between this enzyme and DNA [3].
To clarify which mechanism causes berberine to produce its therapeutic effect, it is necessary to know the mechanisms by which it binds to DNA. Earlier, using the Raman spectroscopy method, we revealed an interesting fact of a resonance interaction of berberine and DNA vibrations [4, 5]. It was found that, in the DNA-berberine solution, the intensity of vibrations of both berberine and DNA increases greatly (by orders as compared to those of the spectra of components) in the range where their intense spectra overlap (1000–1700 cm-1). To explain this interaction, the detailed data about berberine and DNA vibrational spectra are required.
The vibrational spectra of berberine were previously investigated with the use of the Raman [6–9] and IR-absorption spectroscopy methods [7, 9], but no exhaustive interpretation of the obtained spectra was given in those works. In works [7–9], the Raman spectra of berberine in the range of 600–1800 cm-1 obtained by the SERS and SSRS (surface-enhanced and shifted-subtracted Raman spectroscopy) methods were presented.
This work continues and develop our study described in [10].
2 Materials and Methods
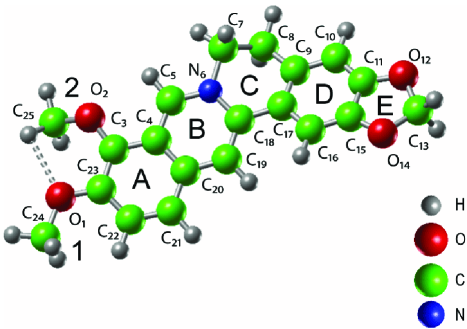
Natural berberine is mainly contained in plants as hydrochloride or dihydrosulfate, a structural formula of a neutral berberine molecule is C20H19NO5 (or C20H18NO4(OH)). A structural formula of a berberine cation (as usually investigated) is [C20H18NO (see Fig. 1). The quantum-mechanical investigations of the berberine structure were carried out in [11, 12]. The results of studies of the spatial structure of berberine cation isomers [12] demonstrate that the berberine cation that consists of hexamerous planar rings has an almost planar frame structure. A deviation from this planar structure is observed only in a partially saturated C ring. It conforms to the shape of a half-chair, in which C7 and C8 atoms of the C ring deviate appreciably from the plane of B and D rings.
The microcrystalline powder of berberine has been studied (berberine hydrochloride, ‘‘Alps Pharmaceutical’’, Japan, 407 g/Mole). Since berberine absorbs in the range to 550 nm [13], a He-Ne laser emission ( Å) has been used for the excitation of Raman spectra; the real power on a specimen was 10 mW. Some spectra were obtained by using a Kr-laser ( Å) with a power 60–80 mW on a specimen. Raman spectra have been measured at room temperature with the -reflection geometry using an optical setup made on the basis of a double-grating monochromator DFS-24 with a resolution of 1.5 cm-1. A laser beam was focused on a specimen with a cylindrical lens to obtain an elongated irradiated area parallel to the entrance slit of the spectrometer. To improve the signal-to-noise ratio, the time accumulation at the point was s (multipass mode). Spectra were recorded in the range of 40–4000 cm-1.
The IR-absorption spectra of berberine (microcrystalline powder) were recorded with a Nicolet NEXUS-470 Fourier spectrometer. We used the ATR (Attenuated Total Reflectance) technique. To improve the signal-to-noise ratio, a signal accumulation regime was used (128 scans). Spectra were recorded in the range of 400–4000 cm-1 with a resolution cm-1. In the resulting spectra, Fresnel losses on the input and output surfaces of specimens were allowed for. In addition, to obtain the absorption spectra, the dependence of the penetration depth of evanescent waves into the sample on their wavelength is considered according to the relation [14]
| (1) |
where and are refractive indices of a prism (diamond) and a specimen, respectively, is a light wavelength, and is an incident beam angle.
In some cases, experimental spectra were treated, by using the Origin and PeakFit programs to specify the data on the band position, the number of band components, and so on.
The optimized geometry of the berberine cation was calculated by the DFT method at the B3LYP/6-311++G(d,p) level without any structural restrictions. At this level, the vibrational (Raman and IR-absorption) spectra were calculated in the harmonic approximation. It should be noted that, for the first time in an optimized structure, the intermolecular hydrogen bond CH…O between metoxylic groups OCH3 of berberine was found [10]. The existence of the bond was determined based on the presence of a critical point of (3,–1) type on the electron density distribution by the АIМ method [15]. The binding energy was found to be 3.12 kcal/mole. The DFT calculations were performed using the ‘‘Gaussian03’’ program package for Win32 [16] granted by the ‘‘Gaussian’’ corporation.
Because the DFT method usually overestimates frequencies, a scaling factor of 0.985 was used for the comparison of calculated and experimental data. This correction was necessary due to errors in the calculation of interatomic interactions as a result of the limited basic functions set [17]. The value 0.985 provides the best correspondence between calculated and experimental data. The scaling factor was determined by Raman spectra – as it turned out, the shapes of calculated and experimental spectra was more similar for Raman spectra, and the correspondence between calculated and experimental frequencies was practically unambiguous. In our case, the scaling factor is close to 1 indicating that the used basic set is sufficient for the studied molecule.
In addition, it is known that the Gaussian set of programs deals with Raman activities , not intensities [18, 19]. Therefore for comparing with the experiment, the Raman activities were corrected by the following relationship to obtain Raman intensities [18]:
| (2) |
Here, is a constant, is the laser excitation line frequency, is the vibrational frequency, are Planck and Boltzmann constants, speed of light, and temperature in degrees Kelvin, respectively.
The values of frequencies and relative intensities of spectral lines with regard for the aforementioned corrections and the detailed interpretation of vibrations are presented in Table.
3 Results and Discussion
The berberine crystal (C20H18NOCl-4H2O) symmetry is triclinic (P1, ) [20]. Due to a low symmetry, there are no degenerated vibrations in vibrational spectra of berberine. The correspondence between the ‘‘crystalline’’ and ‘‘molecular’’ modes is unambiguous. The most essential difference between the spectra of free and crystalline berberine had to reveal itself in the range of very low frequencies (the so-called external vibrations, there are three of them at . In the range of middle and high frequencies (internal vibrations), the influence of a crystal structure is very weak. Both duplication in the number of vibrations (because of ) and some shifting of the vibrational bands take place.
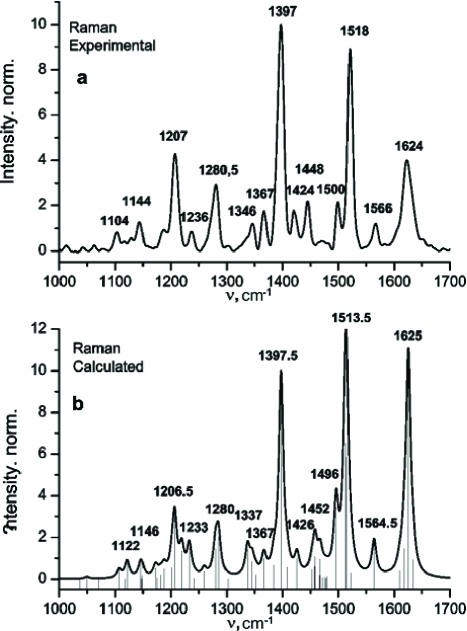
Therefore, we believe that the comparison of experimental vibrational spectra of microcrystalline berberine with calculated spectra of the berberine cation in the actual range of 600–1800 cm-1 was sufficiently correct, which was confirmed by the following analysis. Experimental and calculated Raman and IR-absorption spectra in the range of 800–1700 cm-1 are presented in Figs. 2 and 3, respectively. The frequency values – both experimental and calculated using the scaling factor – are presented in Table. The relative intensities of Raman lines were corrected by (1). In this case, we are interested more in the range of 1000–1700 cm-1. This is because berberine vibrations are the most intense in this range, and there a resonance interaction of the berberine and DNA vibrations (increasing by orders) is observed in the Raman spectrum of a berberine-DNA water solution [4, 5].
| Experimental Data | Calculations | Interpretation of vibration modes | ||||||
| [6] Ram | [9] Ram | [7] IR | Our data | with corrections | ||||
| Ram | IR | , cm-1 | ||||||
| – | 731 | – | 727 | – | 728 | (2.0) | (0.1) | p(СН3); p,(СН2) r.С; f(СН2) r.E; |
| in-plane of all rings; (CNC); (СOС); | ||||||||
| – | – | – | – | vw813 | 810 | (vw) | (0.4) | out-of-plane of atoms H,C r.A,B (H–C22,21,19); others weak |
| – | 834 | – | – | vw832 | 830 | (0.4) | (0.2) | (O–CH3); very strong - r.D,E; weaker - r.A,B,C; |
| – | 842 | – | 843 | 842 | 851 | (vw) | (0.1) | out-of-plane of atoms H,C r.D (H–C10,16) – |
| – | – | – | – | 870 | 870 | (vw) | (1.0) | antiphase (851) and cophase (870); p(C8H2) r.C; |
| weak - of all rings; | ||||||||
| – | – | – | – | 888 | 879 | (0.2) | (0.1) | (O–CH3); p(CH2) r.C; strong - of all rings; |
| – | – | 898 | – | 900 | 901 | (vw) | (0.3) | out-of-plane of atoms H,C19 r.B (H–C19); p(CH2) r.C; |
| others weak; | ||||||||
| – | – | – | – | 912 | 908 | (0.1) | (0.5) | (O–CH3); p(CH2) r.C; strong O–C–O r.E; |
| in-plane - of all rings; | ||||||||
| – | – | – | – | 928 | 926 | (vw) | (0.3) | out-of-plane of atoms H,C5 r.B (H–C5); others very weak; |
| – | – | – | – | – | 934 | (0.2) | (0.4) | p(CH2) r.C; r.C,D; - r.E (O–C–O very strong); |
| – | – | – | – | – | 957 | (vw) | (vw) | out-of-plane of atoms H r.A,B; others very weak; |
| – | – | – | – | 951 | 960 | (vw) | (0.3) | (CH3(1)); p(CH3(2)); p,f(CH2) r.C; f(CH2) r.E; |
| strong in-plane - of all rings; | ||||||||
| – | – | – | 970 | 963 | 970 | (0.3) | (0.7) | weak out-of-plane r.А (С21–H, C22–H); |
| – | – | 1002 | – | 1000 | 994 | (vw) | (0.4) | p(CH3(2)); (O1–CH3); f,(CH2) r.C; |
| f(CH2) r.E; strong - all rings; | ||||||||
| – | – | 1035 | – | 1035 | 1037 | (vw) | (3.7) | strong -(O–CH2–O) r.E and - r.D; |
| out-of-plane pf(CH2) r.C; weak of other rings; | ||||||||
| – | 1044 | – | – | – | 1050 | (vw) | (0.1) | u(CH3); out-of-plane pf(CH2) r.C; f(CH2) r.E; - of all rings; |
| – | 1067 | 1065 | – | 1058 | 1070 | (vw) | (1.3) | u(CH3); (O–CH3); out-of-plane p(CH2) r.C; |
| f(CH2) r.E; - of all rings; | ||||||||
| – | – | – | 1104 | 1103 | 1107 | (0.4) | (3.4) | u,p(CH3); f(CH2); (O–CH3), (C–OCH2) of both pairs |
| of bonds; in-plane - of all rings; H – in-plane; | ||||||||
| – | – | – | – | 1114sh | 1117 | (vw) | (0.3) | out-of-plane strong p(CH2) and weak of atoms O r.E; |
| weak - of all rings; | ||||||||
| 1118 | – | 1110 | 1119 | 1121sh | 1122 | (0.8) | (1.0) | u,p(CH3); out-of-plane pf(CH2) r.E; (O–CH3), (C–OCH2), |
| (N–CH2), (C7–CH2) r.C; all rings; | ||||||||
| H – in-plane and out-of-plane; | ||||||||
| 1144 | – | 1143 | 1144 | 1142 | 1146 | (0.7) | (1.5) | strong (N-CH2), (C5NC18); |
| - r.A,B,C and atoms H in bonds C–H; r.E rigid; | ||||||||
| – | – | – | – | – | 1148 | (vw) | (vw) | strong p(CH3(1)), others weak; |
| – | – | – | – | vw1152 | 1149 | (0.2) | (0.6) | strong p(CH3(2)), others weak; |
| sh | – | – | 1174 | 1171 | 1172 | (0.5) | (0.4) | p(CH3); with differ. ampl.; ,f(CH2) r.C; (CH2) r.E; |
| – | – | – | – | – | 1175 | (vw) | (0.2) | -vibrations r.D, mating with -vibrations r.C; |
| – | – | – | – | – | 1181 | (0.2) | (0.3) | (C7NC18); -vibrations r.A,B; |
| – | – | 1182 | 1187.5 cm | 1184 | 1187.5 | (0.5) | (0.2) | (1181 – strong only p(CH3), 1187- (CH2) r.E); |
| – | – | – | – | 1199 | 1201 | (0.5) | (1.0) | p(CH3); (CH2) (r.C – strong, r.E – weak); strong (N-C7, |
| N-C18) and (C17C9C8 ); weak of all rings; | ||||||||
| 1203 | 1206 | – | 1206 | vw1207sh | 1206.5 | (3.0) | (0.2) | p(CH3); (CH2) (r.C – strong, r.E – weak); |
| - of all rings; atoms H of rings – in-plane; | ||||||||
| Experimental Data | Calculations | Interpretation of vibration modes | ||||||
| [6] Ram | [9] Ram | [7] IR | Our data | with corrections | ||||
| Ram | IR | , cm-1 | ||||||
| – | – | 1230 | 1222 | 1227 | 1219.5 | (1.3) | (4.2) | u(CH3) (1-weak); |
| (CH2) r.C; f(CH2) r.E; (O(1.2)-C); (OCO) r.E; | ||||||||
| - of all rings | ||||||||
| 1235 | 1237 | – | 1236 | 1234sh | 1233 | (1.5) | (0.1) | (1219 – decreasing from A to D; 1233 – conversely); |
| – | – | – | – | vw1246sh | 1241.5 | (vw) | (4.5) | p(CH3); (CH2) r.C; weak f(CH2) r.E; - all rings and O,N; |
| sh | – | – | 1257sh | 1261 | 1260 | (0.4) | (1.2) | weak p,u(CH3); (CH2) r.C; f(CH2) r.E; |
| - of all rings (r.B,C,D,E – strong); | ||||||||
| 1276 | 1280 | 1271 | 1280.5 | 1278 | 1280 | (1.4) | (5.4) | p,u(CH3); weak ,f(CH2) r.C; weak f(CH2) r.E; |
| - of all rings (r.A,B – strong); | ||||||||
| – | – | 1301 | 1295 | – | 1285.5 | (2.0) | (3.8) | p,u(CH3); strong f(CH2) r.C; weak (CH2) r.E; |
| - of all rings (r.C,D,E – strong); | ||||||||
| – | – | – | 1303 | 1309 | 1302 | (vw) | (1,3) | u(CH3); (CH2) r.C, weak f(CH2) r.E; |
| - of all rings (r.A,B-strong); | ||||||||
| sh | – | 1331 | 1333 | 1333 | 1337 | (1.5) | (2.6) | u(CH3); f,f or f,(CH2) r.C, f(CH2) r.E; |
| 1342 | 1340 | – | 1346 | 1346 | 1345.5 | (0.8) | (5.8) | - of all rings (1337 – strong, 1352 – weak); |
| – | – | – | – | – | 1352 | (0.2) | (1.3) | |
| 1361 | 1367 | 1364 | 1367 | 1365 | 1367 | (1.0) | (10) | p(CH3); f,(CH2) r.C, f(CH2) r.E; |
| – | – | 1390 | 1385sh | 1388 | 1384.5 | (0.7) | (4.0) | - vibrations of all rings (1384 – commensurable, |
| 1367 – decreasing from A to E); | ||||||||
| 1397 | 1397 | – | 1397 | 1397sh | 1397.5 | (10) | (2.8) | p(CH3), p(CH2); in-plane --vibrations of atoms |
| C,N,O,H of all rings; | ||||||||
| – | – | – | 1410 | – | 1408.5 | (0.6) | (0.6) | strong f(CH2) r.E, weaker – r.C; weak u(CH3); |
| - vibrations of all rings; | ||||||||
| 1424 | 1425 | 1424 | 1424 | 1422 | 1426 | (1.0) | (1.3) | u(CH3)-strong (2); f(CH2); atoms O – almost immobile; |
| strong - vibrations of all rings; | ||||||||
| 1449 | 1447 | – | 1448 | 1444 | 1452 | (0.5) | (0.2) | u(CH3): 1457-strong (1); (CH2); |
| 1457 | (0,6) | (0,1) | - vibrations of all rings | |||||
| – | – | – | 1460 | 1457 | 1458 | (1.1) | (0.2) | (1452-strong, 1457-weak), r.C,D,E (1458); |
| sh | – | – | 1466 | 1466sh | 1466 | (0.2) | (0.2) | (CH3): 2-strong, 1-weak; |
| – | – | – | 1472 | – | 1467.5 | (1.0) | (0.1) | u(CH3); (CH2) r.C; - vibrations r.A,B,C; |
| – | – | – | – | – | 1471 | (vw) | (0.5) | |
| sh | – | – | 1475b | – | 1476 | (0.1) | (0.3) | with differ. ampl. (CH3); |
| – | – | – | – | – | 1478 | (vw) | (0.7) | weak vibrations adjacent r.A; |
| – | 1481 | – | 1487 | 1479 | 1479 | (0.1) | (1.4) | |
| 1501 | 1499 | 1506 | 1500 | 1504 | 1496 | (3.4) | (5.6) | u(CH3); (CH2) r.E and C; - vibrations r.D (strong), |
| r.A,B (weak); | ||||||||
| 1518 | 1520 | – | 1518 | 1511sh | 1513.5 | (6.6) | (2.7) | u,(CH3); (CH2); in-plane -vibrations with |
| 1515 | (5.9) | (4.0) | differ. ampl. of atoms C,N,O,H of all rings; | |||||
| – | – | – | 1532sh | 1520sh | 1522.5 | (0.3) | (1.5) | strong (CH2) r.E, weak -vibration r.E,D, |
| weak of others rings; | ||||||||
| 1568 | 1569 | 1558 | 1566 | 1567 | 1564.5 | (1.8) | (1.6) | u(CH3): strong (2), weak (1); strong in-plane - vibrations |
| r.A,B (including C18-N and gr.C7H2 r.C); | ||||||||
| Experimental Data | Calculations | Interpretation of vibration modes | ||||||
| [6] Ram | [9] Ram | [7] IR | Our data | with corrections | ||||
| Ram | IR | , cm-1 | ||||||
| – | – | 1600 | 1613 | 1601 | 1609.5 | (0.4) | (4.5) | in-plane - vibrations of atoms C,O,H,N of all rings; |
| sh | – | – | 1623 | – | 1618 | (1.5) | (0.3) | weak u,p(CH3); (CH2) r.C, f(CH2) r.E; |
| 1626 | 1622 | 1629 | 1624 | 1620 | 1625 | (10.7) | (3.3) | 1609: strong of all rings; O – almost immobile; |
| 1618: strong vibrations r. А,D; N – immobile; | ||||||||
| 1625: strong vibrations – r.D, N – vibrates; | ||||||||
| sh | 1633 | – | 1635 | 1633 | 1634 | (0.9) | (0.5) | in-plane of atoms С,N,O,Н of all rings |
| (strong – r.В,С,D, weak – gr. СН2; gr. ОСН3 – immobile); | ||||||||
N o t e s: In brackets near frequency values
are the relative intensity of lines. (The intensities of the modes
at 1397 cm-1 in Raman
spectra and 1367 cm-1 in
IR-absorption spectra count as 10. Modes with relative intensity
less than
0.1 are designated as ‘‘vw’’, for
‘‘very weak’’).
A b b r e v i a t i o n s: b: band; sh: band
shoulder; r.A,B,C,D,E: A, B, C, D and E rings, respectively;
weak’’ and ‘‘strong’’ denote vibrations with small and
large displacements, respectively. Vibrations: – stretching,
– deformation (for the CH2-groups, the same as
bending); : – torsion; : a part of
C atoms in a ring performs -vibrations, and
the others perform -vibrations; for CH2-groups –
f: wagging; p: rocking (atoms vibrate in one plane);
for CH3-groups – u: umbrella (symmetric
-vibrations); p: rocking (atoms vibrate in parallel
planes); for , f, p – vibrations preserve the
rigidity of CH3 and CH2 groups.
Unfortunately, the high frequency region of 3000–3300 cm-1 was not applicable to the comparative analysis: Raman spectra have very small intensities in this region, and IR-absorption spectra are only loosely correlated with calculations.
The calculated spectrum consists of non-degenerate vibrations of a berberine cation [C20H18NO, 105 of which lie in the range of 20–1700 cm-1 (61 of which are in the actual range of 800–1700 cm-1), other 18 ones fall in the range of 3000–3300 cm-1. Low-range frequencies up to 720 cm-1 correspond to out-of-plane vibrations of rings and associated groups. In-plane vibrations of rings appear beginning with 720 cm-1; in particular, the only sufficiently intense 727-cm-1 Raman mode outside of the range of 1200–1700 cm-1. In-plane vibrations are characteristic of the entire range from 720 to 1700 cm-1. The high-frequency region of 3000–3300 cm-1 consists of the modes corresponding to vibrations of C–H-bonds with weak displacements of other atoms, mostly C.
In Fig. 2,a, the experimental Raman spectrum of berberine (microcrystalline powder) in the range of 1000–1700 cm-1 at the excitation by the 6328-Å line is presented. We adjusted the spectra, by subtracting the linearly decreased background and by smoothing the noise level slightly. In the experimental spectrum, more than twenty vibration modes were registered, and the strong correlation was observed between our data and data of [6, 9] (see Table), where the reasonably good berberine Raman spectra in the range of 1000–1700 cm-1 were presented (in [9], FT-Raman). Unfortunately, in Tables in [6, 9], only the frequencies of the most intense bands were given; an interpretation of vibrations was absent, or it was incomplete or inadequate. It should be noted that the Raman spectra of berberine obtained in [7–9] by the SERS and SSRS methods are not applicable fully for the correct comparative analysis of the experimental and calculated data.
In Fig. 2,b, we present the calculated Raman spectrum of a berberine cation in the range of 1000–1700 cm-1, by using a scaling factor.
The frequency values and the detailed interpretation are presented in Table. The strong correlation between experimental and calculated spectra is observed in the range of 1000–1700 cm-1 – both between frequencies and intensities of vibrations. In the range up to 1000 cm-1, besides a 727 cm-1 mode, the intensities of calculated vibrations are very small (less by 2–4 orders) in agreement with experimental data. Notice that some modes very weak by calculations (e.g., 1302 cm-1) are revealed in experimental spectra.
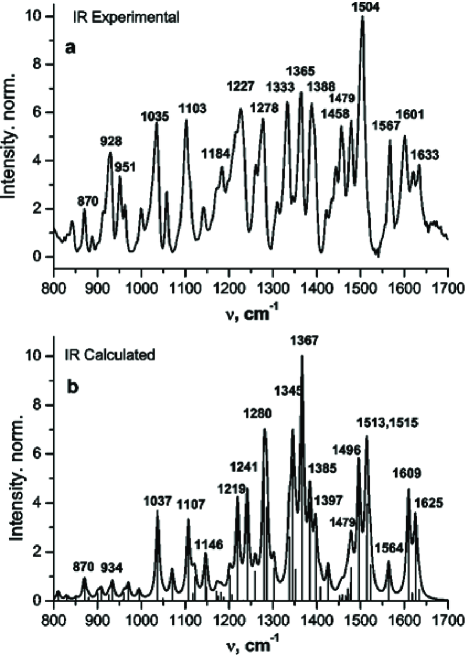
In Fig. 3,a, the IR-absorption spectrum of berberine (microcrystalline powder) in the range of 800–1700 cm-1 is presented (after subtracting the background), about 40 rather intense separated vibrational modes are observed, the good agreement between our data and data of [7–9] takes place (see Table).
It should be mentioned that the obtained experimental IR-absorption and Raman spectra appear quite similar to the IR-absorption spectra and the FT-Raman spectrum presented in [7, 9]; but IR-frequency values were presented in [7] only for the most intense lines, whereas they were not presented at all in [9]. Moreover, the analysis in [7, 9] was performed with SERS spectra that did not correspond well to our spectra by shape. The calculated Raman and IR-absorption spectra appear very similar to those we calculated, but differences in frequency values are quite substantial. Experimental and calculated Raman spectra are similar, but IR spectra are not.
We attribute this discrepancy to the fact that the calculations usually use an ion or molecule of berberine, but experiments are conducted with commercially produced crystallohydrate. Since the dipolarity of vibrations for IR-absorption processes is important, we have not discounted the possibility that the presence of dipole water molecules (and OH-groups) in specimens might have led to the dipole-dipole interaction with berberine molecules, and the results of the interaction might be revealed in IR-absorption spectra. The influence on Raman spectra is weaker, because the Raman scattering processes are related to the electron system, and the influence of the dipole-dipole interaction on the vibrational system is less direct.
In Fig. 3,b, we present the calculated IR-absorption spectrum of berberine (cation) in the range of 800–1700 cm-1, by considering a scaling factor.
The relatively strong correlation between the frequencies of experimental and calculated IR-absorption spectra is observed in the range of 800–1700 cm-1; the correlation between the intensities of vibrations is somewhat worse, for the aforementioned reasons. It should be noted that, contrary to Raman spectra, some modes that were calculated to be intense were not observed at all in experimental IR-spectra, or they had only a very weak intensity (e.g., 1149, 1242, 1285, 1408, 1471 cm etc.). In this case, the lines of an unknown nature were revealed in Raman and IR spectra (1127 cm-1 (IR), 1129 cm-1 (Raman) etc.).
4 Conclusions
Thus, the Raman and IR-absorption spectra have been obtained for a berberine cation by DFT at the B3LYP/6-311++G(d,p) level. The optimized geometry of the berberine cation was calculated as well. The results of calculations strongly correlate with experimental data obtained for microcrystalline berberine chloride in the region of 1000–1700 cm-1 significant from the viewpoint of the interaction of berberine with DNA. The obtained interpretation of the Raman bands of berberine can be used for an analysis of the berberine interaction with nuclei acids and other biomolecules. The DFT method can be used, with satisfactory reliability, to calculate vibrational spectra of other isoquinoline alkaloids of the protoberberine group, for which obtaining the Raman vibrational spectra would be complicated or even impossible for one reason or another.
The autors are grateful to S.O. Alekseev and M.E. Kornienko for the help in the recording of IR-spectra and to L.A. Zaika (Institute of Molecular Biology and Genetics of the NANU) for specimens of berberine.
References
- [1] L. Grycova, J. Dostal, and R. Marek, Phytochemistry 68, 150 (2007).
- [2] M. Maiti and G.S. Kumar, Medic. Res. Reviews 27, 649 (2007).
- [3] T.-K.E. Li, E. Bathory, E.J. La Voie, A.R. Srinivasan, W.K. Olson, R.R. Sauers, L.F. Liu, and D.S. Pilch, Biochemistry 39, 7107 (2000).
- [4] S.Yu. Kutovyy, V.G. Pashchenko, and L.A. Zaika, Visn. Kyiv Univ., Ser. Fiz. Mat., No. 7, 12 (2005).
- [5] V.M. Yashchuk, S.Yu. Kutovyy, N.V. Bashmakova, V.G. Pashchenko, O.V. Dudko, and L.A. Zaika, Nauk. Zapys. Kyiv Mogyl. Akad., Ser. Fiz. Mat., 51, 42 (2007).
- [6] I.M. Bell, R.J.H. Clark and P.J. Gibbs, Spectrochim. Acta A 53, 2159 (1997).
- [7] N. D. Strekal, I.G. Motevich, J.W. Nowicky, and S.A. Maskevich, J. Appl. Spectrosc. 74, 31 (2007).
- [8] S.E. Bell, E.S.O. Bourguignon, A. O’Grady, J. Villaumie, and A.C. Dennis, Spectrosc. Eur. 14/6, 17 (2002).
- [9] M. Leona, J.R. Lombardi, J. Raman Spectrosc. 38, 853 (2007).
- [10] N.V. Bashmakova, S. Yu. Kutovyy, D.M. Hovorun, R.O. Zhurakivsky, and V.M. Yashchuk, Dopov. Nats. Akad. Nauk Ukr., No. 9, 781 (2009).
- [11] M.-J. Huang, K.S. Lee, and S.J. Hurley, Int. J. Quantum Chem., 105, 396 (2005).
- [12] V.I. Danilov, V.V. Dailidonis, D.M. Hovorun, N. Kurita, Y. Murayama, T. Natsume, A.I. Potopalsky, and L.A. Zaika, Chem. Phys. Lett. 430, 409 (2006).
- [13] N. Bashmakova, S. Kutovyy, V. Yashchuk, D. Hovorun, M. Losytskyy, and L. Zaika, Ukr. J. Phys. 54, 471 (2009).
- [14] K.K. Chittur, Biomaterials 19, 357 (1998).
- [15] F. Richard and R.F.W. Bader, Atoms in Molecules. A Quantum Theory (Oxford Univ. Press, Oxford, 1990).
- [16] Gaussian 03, Revision C.02, Gaussian, Inc., Wallingford CT, 2004.
- [17] M. D. Halls, J. Velkovski, and H.B. Schlegel, Theor. Chem. Acc. 105, 413 (2001).
- [18] V. Krishnakumar, G. Keresztury, T. Sundius, and R. Ramasamy, J. Mol. Struct. 702, 9 (2004).
- [19] D. Michalska and R. Wysokinski, Chem. Phys. Lett. 403, 211 (2005).
-
[20]
B.M. Kariuki and W. Jones, Acta Crystallogr., Sect. C: Cryst. Struct. Commun. C 51, 1234 (1995).
Received 01.11.10
КОЛИВАЛЬНИЙ СПЕКТР ОРГАНIЧНОЇ СПОЛУКИ
БЕРБЕРИНУ ТА ЙОГО
IНТЕРПРЕТАЦIЯ
КВАНТОВО-МЕХАНIЧНИМ МЕТОДОМ
ФУНКЦIОНАЛА ГУСТИНИ
Н.В. Башмакова, С.Ю. Кутовий, Р.О. Журакiвський,
Д.М. Говорун, В.М. Ящук
Р е з ю м е
За кiмнатної температури отримано коливальнi спектри (раманiвський
та iнфрачервоного поглинання) мiкрокристалiчного хлориду берберину
та проведено їхню iнтерпретацiю методом функцiонала густини на рiвнi
теорiї DFT B3LYP/6-311++G(d,p) в дiапазонi частот 800–1700
см-1. Спостережено добру кореляцiю мiж експериментальними та
розрахованими частотами коливань.