Study of phase stability in the -FeCr system
Abstract
Formation energy of the -phase in the Fe-Cr alloy system, , was computed versus the occupancy changes on each of the five possible lattice sites. Its dependence on a number of Fe-atoms per unit cell, , was either monotonically increasing or decreasing function of , depending on the site on which Fe-occupancy was changed. Based on the calculated values, the average formation energy, , was determined as a weighted over probabilities of different atomic configurations. The latter has a minimum in the concentration range where the -phase exists. The minimum in that range of composition was also found for the free energy calculated for 2000 K and taking only the configurational entropy into account.
pacs:
71.15.Mb, 71.15.Nc, 71.23.-k, 75.50.BbSigma () phase was found in 43 binary alloys and many other three- or multi-component alloy systems Hall66 ; Joubert08 . This phase cannot be formed at the stage of solidification of the solution of alloying elements. Instead, it can only be obtained by a high temperature annealing process (solid state reaction). From the viewpoint of technological applications of alloys, the -phase is the one which should be avoided as it drastically deteriorates different mechanical properties of materials in which it precipitates. Sigma phase has a tetragonal unit cell (type D P42/mnm) hosting 30 atoms distributed over five crystallographically non-equivalent sites usually called A, B, C, D, and E. In binary alloy systems, like Fe-Cr - the subject of the present paper- both alloying elements are present on all five lattice sites Cieslak08c .
In the Fe-Cr system the -phase can be formed by an isotermal annealing in a limited range of concentration (45-50at% Cr) and temperature (C)Hall66 . Once formed it remains stable at lower temperatures, but it dissolves into the -phase at temperatures above C. Details of the reasons and mechanism of its creation as well as that of its dissolution, hence prevention of its formation, are not known with sufficient clarity yet.
Determination of the formation energy of this phase compared to the energy of formation of bcc () phase (from which it precipitates) may allow for a better understanding of processes involved in its formation and dissolution. Thus, it may be helpful in a creation of a new generation of materials, like stainless steels, having properties more suitable for a construction of new generations of industrailly important facilities like nuclear power plants.
Several theoretical papers were recently devoted to the phase transformation Turchi94 ; Olsson03 ; Korzhavyi05 ; Ackland09 ; Kabliman09 , yet the mechanism responsible for the process is not completely understood. This justifies further studies toward this end. The increase of computing capabilities of modern computers allows creation of increasingly sophisticated models that are able to include more parameters relevant to more adequately and precisely describe the complex structure and properties of the -phase.
In the present work we analysed semi-ordered unit cells having a composition in the vicinity of experimentally determined concentration of one of the alloying elements. Assumptions of the model and details of a computational method used in this work have been widely described elsewereCieslak08b ; Cieslak10a .
Determination of the formation energy of the -phase has so far been based on calculations carried out for the unit cell which sublattices were occupied entirely by a single type of atoms Sluiter75 ; Pavlu10 . In the case of five sublattices and two kinds of atoms, there are 32 possible different atomic arrangements which satisfy these assumptions. Differences between formation energies (in fact, free entalpies, ) determined for each of these configurations and corresponding values obtained for pure constituents (so called reference state - RS), , are customarily presented in form of a diagram as a function of total concentration of alloying elements. Such presentation enables a determination of the concentration range where the -phase exists, as well as drawing conclusions regarding sublattice occupancies. Although this approach allows performing calculations without losing the symmetry of the unit cell, it does not permit to take into account a sublattice disorder. For example in Ref. 12, the lowest value of the formation energy was found for a system named by the authors as FeCrCrFeCr. This notation means that sublattices A and D are fully occupied by Fe atoms, whereas B, C and E sites exclusively by Cr atoms. In the present paper, the convention of the description of the sublattice occupancy in the unit cell is slightly different, because we want to take into account atomic chemical disorder, too. Since the total number of atoms on each of the five sublattices is known, in our notation only the number of the Fe atoms on each sublattice is given explicitely, while the Cr atoms form the balance. Thus, according to our convention the arrangement of atoms FeCrCrFeCr will be called -20080.
Analysis of the formation energy, as sought here, is fraught with a lot of problems. The most important seems to be the one that the -phase in the Fe-Cr alloy system is chemically disordered, and all sublattices are occupied by both alloying elements Cieslak08c . As found with neutron diffraction studies, sublattices A and D are actually in the majority filled by Fe atoms while the other sublattices in the majority by Cr atoms. Yet, for the Fe-Cr the average sublattice occupancy is closer to the configuration -21373 rather than -20080.
Another serious problem that we encounter analyzing the is related with the fact that such analysis is performed as a function of the total concentration of one of the alloying elements. In fact, the should be better considered in five dimensions i.e.versus the concentration for each of the five sublattices.
Facing these problems we proposed a different approach which so far has been successfully applied to determine different hyperfine parameters of the -phase in Fe-Cr and Fe-V systems, such as charge density, electric field gradients and magnetic structure of particular sublattices. It is based on the calculations performed in a finite number of unit cells with the symmetry reduced to a simple tetragonal one, in which each position (but not the sublattice) is occupied by one type of the atoms (e.g. Fe or Cr). The atoms are distributed over different sites with probabilities determined from neutron diffraction measurements. Details of the method itself and the mentioned-above calculated hyperfine parameters are presented elsewhere Cieslak08b ; Cieslak10a .
Let assume the -21373 be a reference state for further calculations. This configuration was chosen as equivalent to the average Fe-occupancy of the sublattices determined experimentally. The value of for the -21373 was here calculated as the average over the values computed for 26 unit cells of different configurations of elementary atoms on all sublattices that fulfil the assumptions for the -21373. The next step was to calculate a change of caused by a replacement of one or two atoms of Fe (Cr) but on a single sublattice, only.
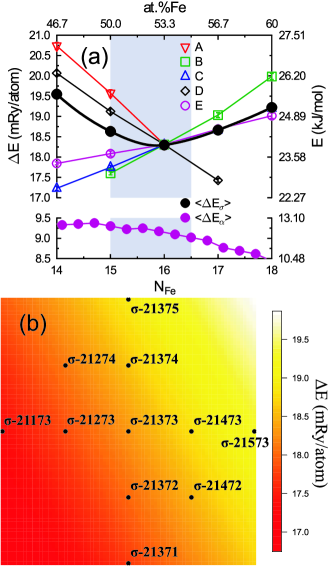
The calculated in that way values of are shown in FIG 1a. Each point on the chart corresponds to 10-15 various atomic arangements analysed separately. As one can see, the changes of versus the number of Fe atoms, , on each of the five sublattices are linear. In particular, increasing the amount of iron on sublattices A and D leads to a reduction in the whereas for other sublattices to its increase. A similar correlation could be observed for the cases in which the change was made on two sublattices at the same time without changing the total concentration of the alloy. An example of the latter is shown in FIG. 1b. The results are in line with those presented in FIG. 1a, and they lead to a conclusion that the configuration -21373 is not the most energetically favorable one for the -FeCr. Moreover, as it is clear from FIG. 1, a reduction of can be achieved by increasing the population of Fe atoms on the sublattices A and D or Cr atoms on sublattices B, C and E. Such changes of the sublattice occupancy lead to the configuration -20080, which was found as the most favorable energetically in Ref.Pavlu10, . Based on the above outlined analysis we can conclude that if the -phase were created at 0K (the temperature for which the calculations were carried out), then the sublattice occupancy would be different from that observed experimentally.
One must remember that the -phase is a disordered system and each configuration set presented in FIG. 1 (as well as many others not taken into account in this calculations) occurs in real terms with various probabilities. Therefore, in order to make a fair comparison between our results and the experimental ones it seems appropriate to calculate the average values of as a function of the concentration of Fe atoms. The average values, , were obtained based on the calculated values of for each configuration weighted by the probability of its occurrence. As can be clearly seen in FIG. 1a, the average for the -phase reaches its minimum almost in the middle of the range where the -phase was found experimentally.
As was mentioned earlier, the -phase in the Fe-Cr system can be formed in the range of temperatures between and C. Annealing above C leads to a recovery of the -phase, whereas below C -phase remains stable. A comparison between the - and -phase average formation energies is presented in FIG. 1a. The has been calculated using the KKR-CPA method. As one can see, its values are significantly lower than the values found for the -phase in the corresponding concentration range. This finding is consistent with the experimental result that the solid phase of Fe-Cr obtained from the liquid phase is always of the -type.
In order to obtain a deeper insight into a relationship between the energies of formation of the - and -phases, one should not restrict itself to a comparison of the free enthalpy of these phases. Instead, one should also consider the free energy, . To this end, it becomes necessary to estimate the value of the entropy, .
The total entropy which should be taken into account here has several contributions, namely: configurational entropy, , magnetic entropy, , electronic entropy, , and phonon entropy, .
The magnetic entropy is one of the quantities that can be determined separately for each of the discussed atomic configurations. Its contribution to the total entropy was calculated from the formula
| (1) |
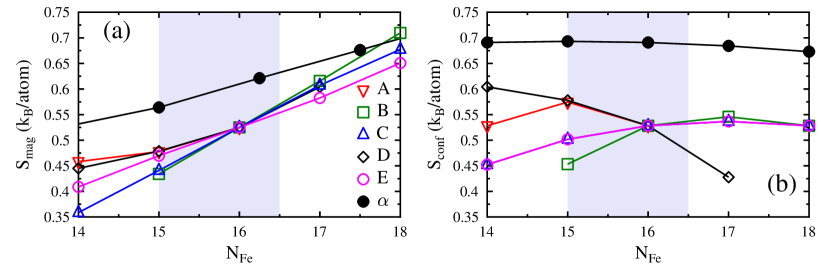
where is Boltzmann constant, stands for the concentration of Fe on each sublattice, and the is the average magnetic moment of Fe/Cr atoms belonging to this sublattice. Calculated in this work -values were found to be consistent with those already published Soulairol10 ; Lavrentiew10 . Consequently, -values were obtained using eq. 1 and are presented in FIG. 2a. A similar for each site and monotonic behavior of with increasing number of Fe-atoms, , reflects the fact that the average magnetic moment changes with a change of Fe-concentration on each sublattice in a similar way. The magnetic entropy calculated for the -phase was found to be larger then the corresponding one of the -phase, but the concentration dependence for the two phases is quite similar. Since the influence of on the phases formation should depend on the difference of the entropies, , one should expect that this type of entropy does not influense the concentration range of transformation too much, because the difference for various is only weakly dependent on the concentration.
The configurational contribution to the entropy, , was calculated according to the known formula:
| (2) |
As in the case of , the configurational entropy can also be determined here for each atomic configuration separately. Plots presented in FIG. 2b pertinent to the -phase reflect its complex structure. The corresponding values for the -phase are larger and stay nearly constant in this range of concentration. Based on the results one should expect that these two types of entropy should have rather different influence on the free energy .
The electronic contribution to the entropy, , can be determined from the temperature dependence of the electronic part of the specific heat, . Unfortunatelly the frequently used formula viz. that is valid as a low temperature approximation, cannot be used here because the temperature of C at which the -phase can be formed is almost twice higher than the Debye temperature, , for the -phase (410-480 ∘C)Cieslak05 and for the -phase in the discussed range of concentration (C)Dubiel10b as determined experimentally. Since the high temperature changes of this type of the specific heat () are expected to be much weaker than other types (e.g. phonon contribution, ) on one hand, and because of a saturation character of , on the other, we are not able to take it correctly into account at this stage of calculations.
The phonon contribution, , was calculated only for one configuration of atoms in an ordered unit cell, namely the one corresponding to the -21373 Dubiel10a . Unfortunately, such calculations are time-consuming and their performation for about 300 atomic arangements, a basis for this work, was in practice not feasible. The total was also determined experimentally on the basis of a phonon spectrum measured on the -phase samples for three different concentrations. In that case the difference , so it is much less than that for the other types of entropy. Unfortunatelly, the measured values correspond to the average entropy only, and as such they cannot be used for a careful analysis of the influence of the atomic configurations on the phase transformation.
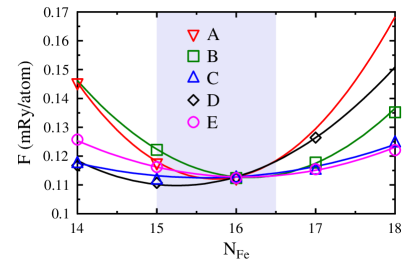
The above oulined analysis shows that at this stage of computations one has only one type of entropy, namely the configurational one, that can be quantitatively used to analyse the behavior of the free energy versus temperature. Exemplary results obtained in this study for T = 2000 K are shown in FIG. 3. It is evident that for each sublattice the free energy reaches its minimum value in the range of concentration in which the -FeCr is observed experimentally. Since this phase can be formed only at elevated temperatures, the sublattice occupancy should corespond to the minimum of at that temperatures, as it is indicated by a shadowed-band.
The temperature of 2000 K is by a factor of two larger than the one at which the formation of sigma occurs. However, the calculations were performed taking into account the configurational entropy only, which is only one of several contributions to the total entropy. Taking into account all types of the entropy will hopefully result in the lowering of the temperature to the values at which the phase really forms.
In summary, the results presented in this paper can be concluded as follows: (a) if the -phase could be formed at 0 K the arrangement of atoms would be different (viz. -20080) than the one observed experimentally, (b) the average value of the formation energy at 0 K has its minimum within the composition where the -phase occurs, (c) the formation energy for the -phase is lower than the one for the -phase, and consequently always the former precipitates from the liquidus, and (d) among different possible contributions to the entropy, the configurational one seems to have the most significant effect on the site occupancy.
Acknowledgements.
This work, supported by the European Communities under the contract of Association between EURATOM and IPPLM, was carried out within the framework of the European Fusion Development Agreement. It was also supported by the Ministry of Science and Higher Education, Warsaw (grant No. N N202 228837)References
- (1) E. D. Hall and S. H. Algie, Metall. Rev. 11, 61 (1966).
- (2) J.-M. Joubert Progr. Mater. Sci. 53, 528 (2008).
- (3) J. Cieslak, M. Reissner, S. M. Dubiel, J. Wernisch and W. Steiner, J. Alloys Comp. 460, 20 (2008).
- (4) P. E. A. Turchi , L. Reinhard , and G. M. Stocks , Phys. Rev. B 50, 15542 (1994).
- (5) P. Olsson , I. A.Abrikossov, L. Vitos , and J. Wallenius , J. Nucl. Mater, 321, 84 (2003).
- (6) P. A. Korzhavyi , Bo Sundman , M. Selleby , and B. Johansson , Mater. Res. Soc. Symp. Proc. 842, S4.10 (2005).
- (7) G. J.Ackland , Phys. Rev. B 79, 094202 (2009).
- (8) E. A. Kabliman, A. A. Mirzoev and A. L. Udovskii, Phys. Met. Metallogrephy 108, 435 (2009).
- (9) J. Cieslak, J. Tobola, S. M. Dubiel, S. Kaprzyk, W. Steiner and M. Reissner, J. Phys.: Condens. Matter. 20, 235234 (2008).
- (10) J. Cieslak, J. Tobola, and S. M. Dubiel, Phys. Rev. B 81, 174203 (2010).
- (11) M.H.F. Sluiter, K. Esfarjani and Y. Kawazoe, Phys. Rev. Lett. 75, 3142 (1995).
- (12) J. Pavlu̇, J. Vřešťál and M. Šob, Intermetallics 18, 212 (2010).
- (13) R. Sourairol , Chu-Chun Fu , and C. Barretteau, J. Phys. Cond. Matter 22, 295502 (2010).
- (14) M. Yu. Lavrentiev, D. Nguyen-Manh, and S. L. Dudarev, Phys. Rev. B 81, 184202 (2010).
- (15) J. Cieslak, B.F.O. Costa, S. M. Dubiel, M. Reissner and W. Steiner, J. Phys.: Condens. Matter. 17, 6889 (2005).
- (16) S. M. Dubiel, J. Cieslak and B.F.O. Costa, J. Phys.: Condens. Matter. 22, 055402 (2010).
- (17) S. M. Dubiel, J. Cieslak, W. Sturhahn, M. Sternik, P. Piekarz, S. Stankov and W. Parlinski, Phys. Rev. Lett. 104, 155503 (2010).