Methanol Maser Emission from Galactic Center Sources with Excess 4.5 m Emission
Abstract
We present a study of signatures of on-going star formation in a sample of protostellar objects with enhanced 4.5 m emission (‘green’ sources) near the Galactic center. To understand how star formation in the Galactic center region compares to that of the Galactic disk, we used the Expanded Very Large Array to observe radiatively excited Class II 6.7 GHz CH3OH masers and collisionally excited Class I 44 GHz CH3OH masers, both tracers of high-mass star formation, toward a sample of 34 Galactic center and foreground ‘green’ sources. We find that 3315% of Galactic center sources are coincident with 6.7 GHz masers, and that 4417% of foreground sources are coincident with 6.7 GHz masers. For 44 GHz masers, we find correlation rates of 2713% and 2513% for Galactic center green sources and foreground green sources, respectively. Based on these CH3OH maser detection rates, as well as correlations of green sources with other tracers of star formation, such as 24 m emission and infrared dark clouds (IRDCs), we find no significant difference between the green sources in the Galactic center and those foreground to it. This suggests that once the star formation process has begun, the environmental differences between the Galactic center region and the Galactic disk have little effect on its observational signatures. We do find, however, some evidence that may support a recent episode of star formation in the Galactic center region.
1 Introduction
Studying star formation in the Central Molecular Zone (CMZ) of the Galaxy (within a few hundred pc of the Galactic center) can help provide insight into the structure and evolution of our Milky Way Galaxy, as well as provide a template for studying star formation in the nuclei of other galaxies. The CMZ, which contains 5 107 M⊙ of molecular gas (Pierce-Price et al., 2000), is home to several of the prominent star-forming regions toward the Galactic center, such as the Sgr A, Sgr B, and Sgr C complexes. These regions are evolved enough to contain UV-emitting stars, but the CMZ also shows evidence of earlier stages of star formation (Liszt, 2009; Bally et al., 2010). Among the best tracers of the early stages of star formation are CH3OH masers and regions of extended, enhanced 4.5 m emission.
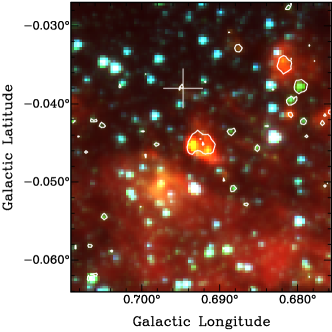
A new method of identifying star formation activity in its early stages is by selecting sources with enhanced 4.5 m emission. Such sources, commonly called green fuzzies (Chambers et al., 2009) or extended green objects (EGOs; Cyganowski et al., 2008), are named for how they appear in Spitzer/IRAC (Fazio et al., 2004) 3-color images (8.0 m in red, 4.5 m in green, and 3.6 m in blue). The enhancement at 4.5 m likely arises from a shock-excited H2 or CO spectral feature in the 4.5 m band (Marston et al. 2004, Noriega-Crespo et al. 2004). More recent work by De Buizer & Vacca (2010) and Foster et al. (2011) has shown that the 4.5 m emission from some green sources is caused by shock-excited H2 emission, while others show no prominent spectral features. Despite its uncertain origin, enhanced 4.5 m emission, frequently referred to as ‘green’ emission in this paper, is a reliable tracer of early protostellar activity (Chambers et al., 2009; Cyganowski et al., 2008, 2009).
Another tracer of star formation activity is one of the brightest known maser lines, the CH3OH transition at 6.7 GHz. This Class II CH3OH maser transition, which is thought to be radiatively excited by a central high-mass protostellar object (Cragg et al., 1992), exclusively traces high-mass ( 8 M⊙) star formation (Walsh et al., 2001; Minier et al., 2003). Class II masers are often found very close to protostars, supporting this idea (Caswell, 1997; Ellingsen, 2005). Collisionally excited Class I CH3OH masers are also thought to be reliable tracers of star formation. Unlike Class II masers, however, they are not restricted to high-mass star-forming regions, as evidenced by the detection of Class I CH3OH masers toward low- and intermediate-mass star forming regions (Kalenskiĭ et al., 2006; Kalenskiĭet al., 2010). Class I masers tend to be found at larger angular distances from protostars than Class II masers (Kurtz et al., 2004; Ellingsen, 2005), and are well-correlated with the outflows associated with star formation (Plambeck & Menten, 1990; Kurtz et al., 2004; Voronkov et al., 2006). Recent work has shown that Class I CH3OH masers are also associated with regions of shocked gas where expanding regions collide with neighboring molecular clouds (Voronkov et al., 2010). Thus, Class I masers are associated with two evolutionary phases of star formation. Because green sources are known to be in early evolutionary phases, Class I masers associated with them are likely to be associated with protostellar outflows rather than regions.
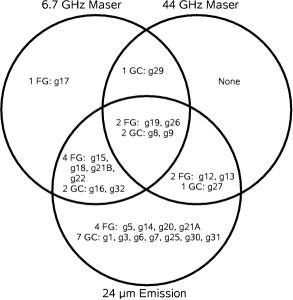
The first to propose a correlation between sources with enhanced 4.5 m emission and CH3OH masers was Yusef-Zadeh et al. (2007), who found that at least 1/3 of the green sources in the Galactic center are associated with CH3OH maser emission. Subsequent studies (Chambers et al., 2009; Chen et al., 2009; Cyganowski et al., 2009) have shown that CH3OH masers are strongly associated with 4.5 m excess sources in the Galactic disk. Moreover, these green sources are also highly associated with: (1) 24 m emission, indicative of heated dust around a protostar, and (2) infrared dark clouds (IRDCs), which are known to harbor the early stages of high-mass star formation (see Section 3.6). Because both Class I and Class II CH3OH maser emission are generated during high-mass star formation, their association with 4.5 m excess sources helps to confirm that the green sources are indeed tracing the early stages of high-mass star formation.
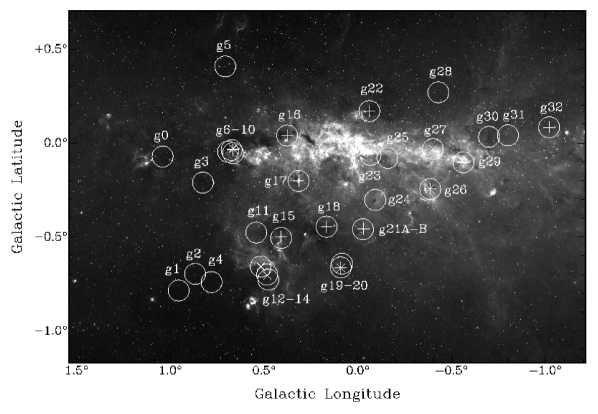
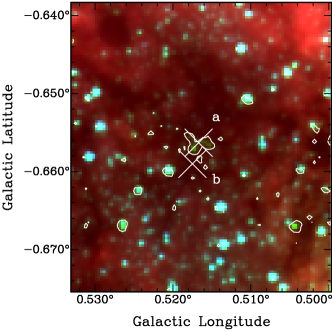
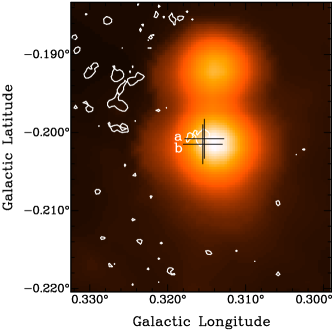
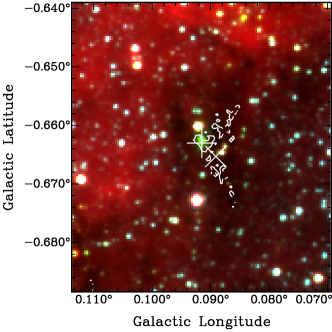
In a detailed examination of the star formation in the Galactic center, Yusef-Zadeh et al. (2009) (Y-Z09 hereafter) identified and examined 34 green sources toward the central region of the Galaxy ( and ; see Fig. 1) using Spitzer/IRAC data. Y-Z09 identified these sources, by eye, using the empirical ‘green’ ratio , which helps select sources that are enhanced at 4.5 m relative to 3.6 m and 5.8 m. Using available published CH3OH maser data, primarily from targeted observations of known star-forming regions and maser sites, Y-Z09 found that 40% of these green sources are associated with Class I and/or Class II CH3OH maser emission. Due to the relatively high detection limit ( 0.3–5 Jy) of these observations, however, it is possible that some masers have gone undetected. Here, we present our more sensitive ( 0.1 Jy), targeted, 6.7 and 44 GHz CH3OH maser observations toward these green sources using the National Radio Astronomy Observatory’s Expanded Very Large Array (EVLA)111The National Radio Astronomy Observatory is a facility of the National Science Foundation operated under cooperative agreement by Associated Universities, Inc.. In addition to CH3OH masers, we also search for other star formation indicators that correlate with our sample of 4.5 m emission sources, such as 24 m emission and IRDCs. We investigate whether star formation in the CMZ differs from that in the Galactic disk.
2 Observations
We used the new 4.0 - 8.0 GHz (C-band) capability of the EVLA to obtain spectral line observations of the 6.6669 GHz 5(1,5)-6(0,6) A++ CH3OH maser transition (Menten, 1991) toward a sample of 34 green sources in the central few degrees of the Galaxy (Fig. 1). The sample selection and individual sources are described in Section 3.7. To observe all 34 sources, we made 31 snapshot observations (one field contains 3 green sources, and another contains 2 green sources) of 80 seconds each in 2007 December as part of Program AY184. In total, 12 EVLA antennas were used in the B configuration. The spectra have 140 km s-1 (3.125 MHz) bandwidth, 256 channels, and a channel width of 0.54 km s-1 (12.2 kHz). The primary beam of the EVLA at this frequency is 7′, the synthesized beams in the processed images are 4″ x 1″, and the position angles of the synthesized beams range from 14∘ to 2∘, with a mean of 7∘.
To calibrate the 6.7 GHz data, we use standard procedures in AIPS along with a few modifications to the standard recipe. The calibrators are 1331+305 for flux calibration and 1730-130 for phase calibration. Doppler tracking was used for these observations. After the data were obtained, however, it was determined that the path lengths of the fibers connecting the LO reference signals to the antennas were not taken into account. After the standard flux and phase calibration, an additional phase modification is applied (using CLCOR in AIPS) to each antenna to correct for this error. Because the sources are within a few degrees on the sky, only one constant offset is necessary, rather than a more time/source specific offset. This offset modifies the phase only, and thus should not affect the positional or velocity accuracy of the data. For those sources with bright emission, self-calibration is performed on the channel of peak emission (as identified in the AIPS task POSSM), and subsequently applied to all other channels. PBCOR is used to correct the flux for primary beam attenuation. The final sensitivity of these 6.7 GHz data is 50 mJy beam-1 in each spectral channel.
In order to identify CH3OH masers at wide range of velocities, we made two observations of each field, centered at what were intended to be 50 km s-1. Because Doppler tracking was used, however, an error in the online system caused the observed frequencies to be calculated using the submission date of the observe file rather than the actual date of observation. Using the online DOPSET tool and the date of the observations, we calculated what the observing frequency should have been, and found that an offset of 16.3-16.8 km s-1 was introduced by this error, depending on the source. Thus, the central velocities of the two observations for each field are 33 km s-1 and 67 km s-1, and our observations cover the entire velocity range from 103 km s-1 to 136 km s-1.
To supplement our observations, we also use a portion of the Methanol Multibeam (MMB) survey catalog of 6.7 GHz masers (Caswell et al., 2010, C10 hereafter). In their survey of the Galactic plane (345∘ 6∘, 2∘), C10 used the Parkes 64-m telescope to search for 6.7 GHz maser emission with a sensitivity of 170 mJy (1). In order to pinpoint the location of the maser emission to within 0.4″, follow-up observations of the Parkes detections were carried out using the Australia Telescope Compact Array (ATCA).
We used the EVLA in the C configuration to observe the 44.069 GHz 7(0,7)-6(1,6) A++ CH3OH maser emission (Morimoto et al., 1985) toward our sample of 34 green sources in 2008 May as part of Program AY184. As with the 6.7 GHz observations, these 34 sources are observed in 31 fields. A total of 26 antennas were used, including 15 EVLA antennas. At this frequency, the primary beam is 1′, the synthesized beams in our data are 1″ x 0.5″, and the position angles of the synthesized beams range from 8∘ to 12∘, with a mean of 5∘. The spectra have 84 km s-1 (12.5 MHz) bandwidth and 64 channels, resulting in a channel width of 1.3 km s-1 (195 kHz). Each source was observed for 2 minutes in each of two velocity ranges, from 89 to 7 km s-1 and 2 to 80 km s-1. Because the velocity range from 7 km s-1 to 2 km s-1 was not covered by these observations, it is possible that masers exist in this range and were undetected by our observations. C10 found that only one of the 29 Class II masers in the region containing our green sources is in this velocity range. As a result, it seems unlikely that a significant number of masers have gone undetected in our search. Because the the possibility remains, however, our 44 GHz maser detection rates should be considered lower limits.
Standard flux (1331+305) and phase (17443-31165) calibration are applied to the data in AIPS. Because these are high-frequency observations, fast-switching was used for frequent phase monitoring. Self-calibration is performed on the channel of peak emission (as identified in the AIPS task POSSM), and subsequently applied to all other channels. PBCOR is used to correct the flux for primary beam attenuation. Because these observations combined data from VLA and EVLA antennas, Doppler tracking was not used (as recommended by NRAO). During the data reduction process, Doppler offsets are calculated using the online DOPSET tool. The final sensitivity of these observations is 70 mJy beam-1 in each spectral channel.
3 Results
To better understand excess 4.5 m emission sources, and the star formation occurring toward the Galactic center, we compiled several of their characteristics. Three of the 34 green sources (g1, g2, and g4) were found to be positionally coincident with known planetary nebulae (Van de Steene & Jacoby, 2001; Jacoby & Van de Steene, 2004, Y-Z09). Because we are interested in studying regions of star formation, we exclude these three sources from subsequent analysis. To examine the remaining 31 sources, we compare their (1) 6.7 GHz Class II CH3OH maser emission, (2) 44 GHz Class I CH3OH maser emission, (3) 24 m emission using Spitzer/MIPS (Rieke et al., 2004) data from Y-Z09, (4) Galactic location, (5) mass, as estimated by Y-Z09, and (6) association with IRDCs, using Spitzer/IRAC data (Stolovy et al., 2006; Arendt et al., 2008; Ramírez et al., 2008). A summary of these results can be found in Table 1.
3.1 Association of 6.7 GHz CH3OH Masers with Green Sources
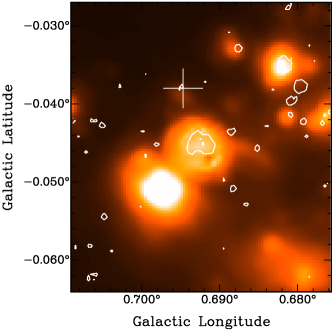
Class II 6.7 GHz CH3OH masers are radiatively excited and are known to trace the early stages of high-mass star formation (e.g., Menten, 1991; Cragg et al., 1992; Walsh et al., 2001; Minier et al., 2003). Because of their strong association with high-mass star formation, we searched for 6.7 GHz CH3OH masers toward our sample of green sources. We detect a total of 18 maser sites in the 31 observed fields. The masers are identified, by eye, in EVLA data cubes before self-calibration. The typical 1 sensitivity in these cubes is 50 mJy. Spectra of the 18 maser sites are shown in Figures 2-32, and their positions, velocities, and peak intensities can be found in Table 2. If a maser site displays more than one velocity feature, the position and velocity of the peak intensity are listed.
All of our maser detections, except for one, are present in the C10 catalog. Comparing the positions of the masers, they have a mean offset of 0.9″. The maser positions from our data are identified by the position of the peak pixel rather than an elliptical Gaussian fit, possibly resulting in an offset of one or two pixels (our data have a pixel size of 0.3″). C10 cite a positional uncertainty of 0.4″ for their catalog. Together, the positional uncertainties can account for the mean offset of 0.9″, and we consider the masers that we detect to be positional matches to the C10 masers. Moreover, we find an average offset in peak velocity of only 0.2 km s-1 (compared to our channel width of 0.54 km s-1) between the two sets of masers. As a result, we are confident that we are detecting the same maser sources as C10.
We detect one maser toward green source g31 (G359.1990.041) that is not in the C10 catalog, located at (J2000) with a velocity of 4.1 km s-1. This maser has a peak flux of 1.4 Jy, not much greater than the 1 Jy value at which the C10 survey is close to 100% complete (Green et al., 2009). Because 6.7 GHz masers can be variable by factors of a few over timescales of months (Goedhart et al., 2004), it is not surprising that this maser escaped detection by C10.
There are four CH3OH masers, detected by C10, that are in our fields of view but went undetected in our observations (0.1670.446, 0.376+0.040, 358.980+0.084, and 359.9700.457 in the naming scheme of C10). Each of these masers displayed variability of at least a factor of 2 in the different C10 observations, and their lowest observed intensities range from 0.2 Jy to 1.3 Jy. Their variability makes it plausible that these masers were in a low or dormant state during our observations, resulting in their non-detection in our observations.
Because of its excitation mechanism, 6.7 GHz maser emission is likely found close to protostars. Recent work (e.g., Cyganowski et al., 2009) has shown that 6.7 GHz masers are indeed close (typically within a few arcseconds) to central, star-forming objects within enhanced 4.5 m sources. To determine which green sources in our sample are associated with 6.7 GHz masers, we select a search radius of 10″. We find that 12 of 31 green sources are positionally coincident with at least one 6.7 GHz maser (Fig. 1).
3.2 Association of 44 GHz CH3OH Masers with Green Sources
Class I CH3OH masers are collisionally excited, and are thought to form both in the outflows associated with star formation (Plambeck & Menten, 1990; Kurtz et al., 2004; Voronkov et al., 2006) and at the intersections of expanding regions and their neighboring molecular clouds (Voronkov et al., 2010). Because they are reliable tracers of star formation, we searched for 44 GHz CH3OH maser emission toward our enhanced 4.5 m emission sources. We detect 8 masers in 31 fields. As with the 6.7 GHz maser observations, the 44 GHz masers are identified by eye in EVLA data cubes prior to self-calibration. These data have a typical 1 sensitivity of 70 mJy. Spectra of the 8 maser sites are shown in Figures 2-32, and their positions, velocities, and peak intensities can be found in Table 3.
Because we are searching for 44 GHz masers toward green sources, which are known to be in the early stages of star formation, we will likely identify masers that are associated with outflows rather than regions. The collisionally excited masers formed in outflows are typically found at larger angular separations (up to tens of arcseconds; Cyganowski et al., 2009) from central protostellar objects than radiatively excited masers. Indeed, Cyganowski et al. (2009) find some 44 GHz masers beyond the extent of the 4.5 m emission used to identify their green sources. We select a radius of 30″ as the maximum separation to associate a 44 GHz maser with a green source. We find that 8 of 31 green sources are positionally coincident with at least one 44 GHz maser (Fig. 1). It is possible that these sources are not physically associated, especially if they are located at the Galactic center distance of 8.5 kpc (where a separation of 30″ corresponds to a linear size scale of 1.2 pc). Because the chance of a random alignment of these two signs of star formation activity is low, however, we use the angular separation of 30″ even for the Galactic center sources.
We find that some green sources are associated with both 44 GHz and 6.7 GHz masers. Of the 12 green sources with 6.7 GHz CH3OH masers, 5 have 44 GHz masers. Of the 8 sources with associated 44 GHz masers, 5 have 6.7 GHz maser counterparts.
3.3 24 m Emission toward Green Sources
Bright 24 m emission is often associated with star formation. This emission may be from the heated dust in a protostar/disk system (Muzerolle et al., 2004; Whitney et al., 2004; Beuther & Steinacker, 2007), or it could arise from the heated dust in an region. Chambers et al. (2009) find a high correlation of green sources with 24 m emission, further supporting the idea that it is a reliable tracer of star formation. To determine if our sample of green sources is coincident with this additional star formation indicator, we visually inspected Spitzer/MIPS 24 m data of the Galactic center (Y-Z09). In regions where the MIPS data are saturated (e.g., near Sgr A∗), lower resolution MSX data at 21.34 m are used to replace the missing MIPS data (see Y-Z09 for details). We find that 24 of the 31 green sources are coincident with 24 m emission. Thus, we can be reasonably sure that these sources are indeed protostellar in nature. Of the seven green sources that do not display 24 m emission, two green sources are close to regions that are very bright at 24 m: Sgr C and Sh2-20 (Sharpless, 1959; Dutra et al., 2003). The bright emission from these sources may be overwhelming any 24 m emission toward the green sources. Thus, the 24 m detection rate toward green sources of 77% (24 of 31) should be considered a lower limit.
3.4 The Galactic Location of Green Sources
The green sources in our sample are divided into two categories – one consisting of sources likely to be in the Galactic center region at a distance of 8.5 kpc, and the other likely to be foreground to the Galactic center. As described in Y-Z09, the green sources were divided into these two categories based on their Galactic latitude. Sources with ′ are assumed to be in the foreground, and sources with ′ are assumed to be at the Galactic center distance. Based on this separation method, we find that 16 and 15 green sources in our sample are foreground sources and Galactic center sources, respectively. While this distance estimate may not be exact, it is a reasonable first approximation. Based on the scale height of 24 m sources and young stellar objects in the Galactic center ( 8′; Y-Z09), it is plausible that the green sources at low Galactic latitudes are at the distance of the Galactic center. With kinematic velocities, one could attempt to derive kinematic distances to these sources. Because the sources are close in projection to the Galactic center, however, the derived kinematic distances would have very large errors. As a result, we have not made distance estimates based on kinematics.
3.5 Masses of Green Sources
The masses of the green sources were determined by Y-Z09, who performed SED fits of the sources using YSO models (Robitaille et al., 2006; Whitney et al., 2003a, b) and a linear regression fitter (Robitaille et al., 2007). The fits to individual sources range from well-constrained to poorly constrained, and have typical errors of 25%. The current masses derived from these fits range from 2.1 to 29.9 M⊙, with a median mass of 10.3 M⊙. Because these green sources are likely still accreting, their final masses may be larger than their current mass, and the masses we list are a lower limit to the final masses of individual stars. Moreover, the green sources may consist of multiple sources at higher resolution, so the derived masses may represent the mass of a cluster of protostars rather than individual protostars. Nevertheless, the derived masses of the green sources, along with their positional coincidence with Class II CH3OH maser emission, make it likely that the green sources harbor high-mass protostars.
3.6 Association of Green Sources with IRDCs
IRDCs, which are identified as absorption features against the Galactic IR background, are dense (n 105 cm-3, N 1024 cm-2), cold ( 25 K; Egan et al. 1998; Carey et al. 1998, 2000), and have characteristic sizes and masses of 5 pc and few 103 M⊙ (Simon et al. 2006). These large reservoirs of molecular gas harbor the earliest stages of star and cluster formation. Within IRDCs are compact cores with characteristic sizes of 0.5 pc and masses of 120 M⊙, comparable to compact cores associated with high-mass star formation (Rathborne et al., 2006). Some IRDC cores contain embedded young stars or protostars, and a few of these embedded young stellar objects will evolve into high-mass stars (e.g., Beuther et al., 2005; Rathborne et al., 2005).
Chambers et al. (2009) found that the cores within IRDCs span a range of evolutionary stages, and can be separated into three broad categories: (1) ‘quiescent’ cores, which display no bright IRAC (3-8 m) or 24 m emission and are in a pre-protostellar state, (2) ‘active’ cores, which contain extended, enhanced 4.5 m emission (a ‘green fuzzy’) coincident with 24 m emission, and (3) ‘red’ cores, which display bright 8 m emission, indicative of polycyclic aromatic hydrocarbon (PAH) emission and an region. We hypothesize that our sample of enhanced 4.5 m sources are similar in their protostellar nature to the green fuzzies found within IRDCs. To test this possibility, we examined 8 m IRAC images of the Galactic center region to determine if our green sources are associated with IRDCs. We find that 30 of our 31 green sources are associated with IRDCs, as identified by eye. Images of these sources are shown in Figures 2-32.
3.7 Notes on Individual Sources
Our source list is comprised of the 34 green sources identified by Y-Z09 (named g0 through g32; g21 is parsed into g21A and g21B). These sources were selected for their proximity, in projection, to the Galactic center (all sources have and ). In addition, all 34 sources were selected, by eye, for their enhanced 4.5 m emission, as identified by the ratio: , referred to as the ‘green ratio’ hereafter. Y-Z09 found that this empirical green ratio of 4.5 m intensity to that determined by a power-law interpolation between 3.6 m and 5.8 m intensities is successful at identifying sources with enhanced 4.5 m emission.
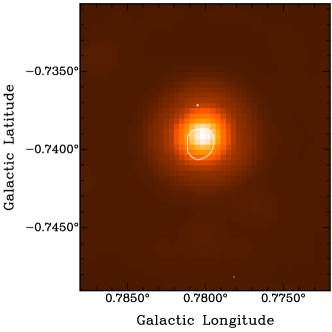
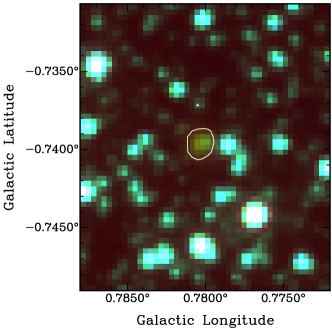
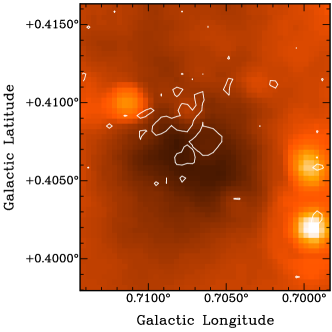
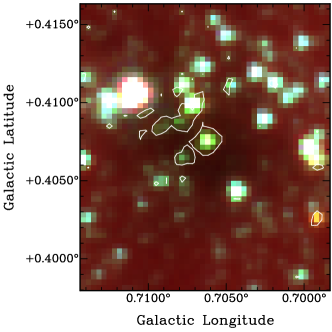
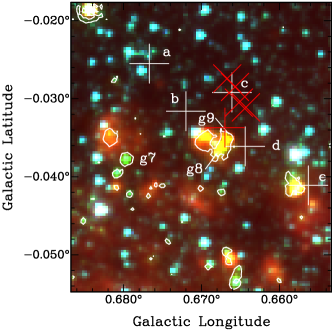
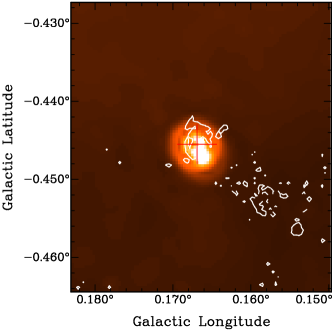
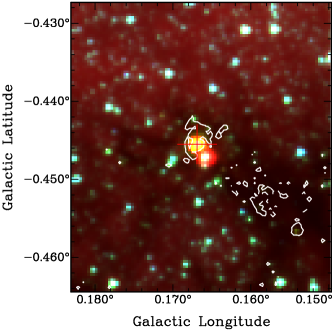
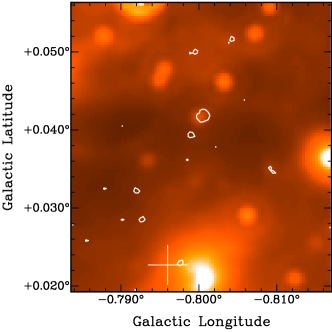
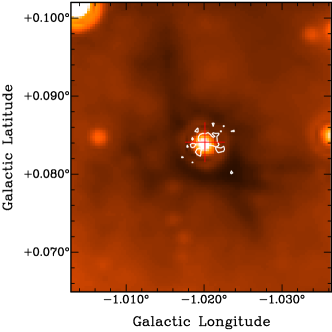
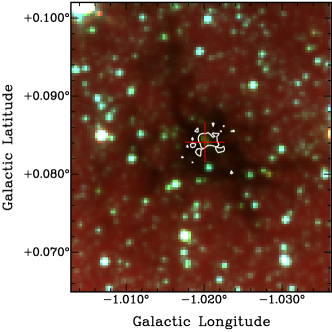
Here we describe each of the green sources in our sample. Spitzer/IRAC 3-color images of each source, using data obtained as part of GLIMPSE (Benjamin et al., 2003) and another IRAC survey of the Galactic center region (Stolovy et al., 2006; Arendt et al., 2008; Ramírez et al., 2008), are contained in Figures 2-32. In addition, Figures 2-32 also contain Spitzer/MIPS 24 m images of each source using data obtained by Y-Z09. For the fields toward which we detect CH3OH maser emission, the maser positions are overlaid on the images, and the spectra are included in the figures. The masses of the sources given in the following sections are from Y-Z09, and are calculated as described in Section 3.5. In general, the 6.7 GHz masers that are associated with our green sources are located on the enhanced 4.5 m emission that define the sources. The average separation between the center of the green sources and their associated 6.7 GHz masers is 2.3′′. Only 2 of the 13 associated 6.7 GHz masers are 5′′ from the center of the green sources, supporting the idea that these masers are formed close to the central protostellar object. 44 GHz masers are found at an average angular separation of 10.6′′ from the center of their associated green sources. The 44 GHz masers masers are farther away from the center of the green sources than the 6.7 GHz masers, near the edges of the enhanced 4.5 m emission and consistent with their creation in outflows.
In 6 fields (g6-g10, g31), we detect 6.7 GHz masers in our observations but do not associate them green sources. We include the positions of these masers in their appropriate figures to show where they reside in relation to the green sources in our sample. In general, the masers that are not associated with the green sources are not associated with any strong IRAC or MIPS emission. These masers may be associated with star formation along the line of sight to the green sources, but at an evolutionary state during which no significant IR emission is detectable. Alternatively, they may reside on the far side of the Galaxy, making the detection of infrared emission toward them difficult.
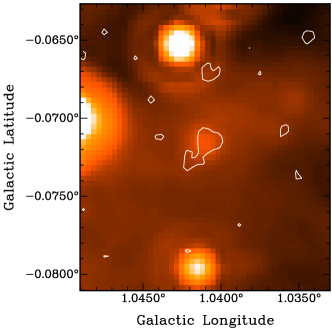
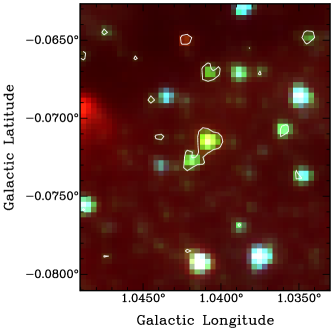
3.7.1 g0 (G1.0410.072)
Green excess source g0 consists of two knots of enhanced 4.5 m emission (Fig. 2), and is located to the west of Sgr D. The mass of g0 (16.13.5 M⊙) indicates that it is a site of high-mass star formation. Source g0 is located within an IRDC that is at the eastern edge of the prominent dust ridge seen toward the Galactic center (Lis & Carlstrom, 1994; Lis & Menten, 1998; Lis et al., 2001). Because it is within 10′ of the Galactic plane, we assume that this source is at the distance of the Galactic center. We do not detect any CH3OH maser emission toward this source.
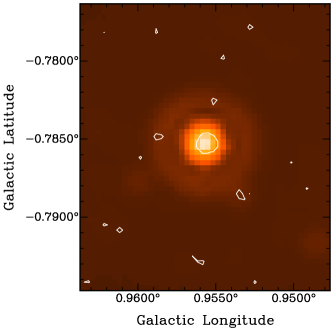
3.7.2 g1 (G0.9550.786), g2 (G0.8680.697), g4 (G0.9550.786)
Sources g1, g2, and g4 (Figs. 3, 4, and 5) are all coincident with the positions of known planetary nebulae (Van de Steene & Jacoby, 2001; Jacoby & Van de Steene, 2004), are in close proximity to one another, and are isolated from other star formation regions. All three sources are associated with 24 m emission, but not show no correlation with other observational signatures of star formation, such as IRDCs or CH3OH maser emission. Because they are likely to be a planetary nebulae rather than protostars, we exclude them from our statistical analysis.
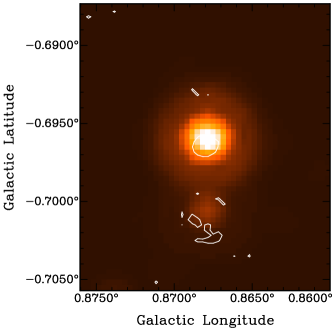
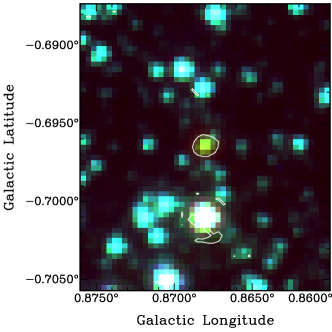
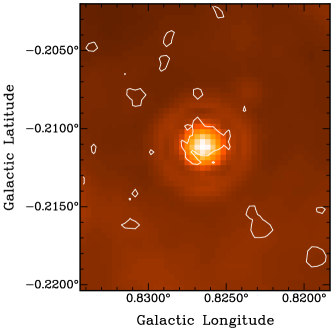
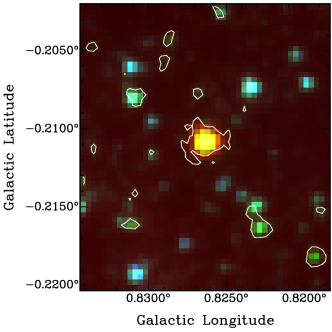
3.7.3 g3 (G0.8260.211)
Similar to g0, green source g3 is embedded within an IRDC that may be part of the prominent dust ridge at positive Galactic longitude near the Galactic center. As seen in Figure 6, g3 appears more orange than green in the IRAC 3-color image, but, as the contours on the image show, it does have an enhancement at 4.5 m. Its Galactic latitude places it at the distance of the Galactic center, and its possible association with the dust ridge and its proximity to Sgr B2 support this claim. Source g3 has a mass of 10.60.0 M⊙, and is not associated with any CH3OH maser emission.
3.7.4 g5 (G0.708+0.408)
Green source g5 has the highest Galactic latitude of all the sources in our sample, making it likely to be foreground to the Galactic center. It is embedded within a small IRDC, and displays faint 24 m emission (Fig. 7). This source, which displays no CH3OH maser emission, has a mass of 6.03.0 M⊙.
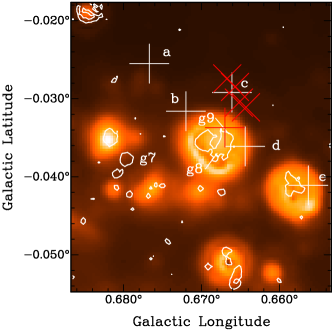
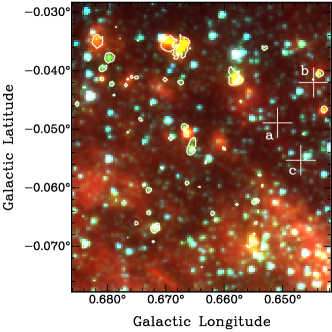
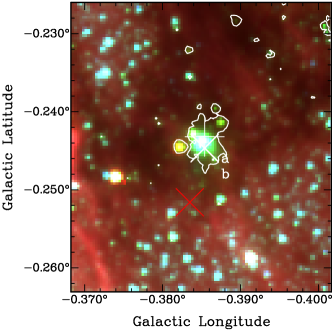
3.7.5 g6 (G0.6930.045), g7 (G0.6790.037), g8 (G0.6670.037), g9 (G0.6670.035), g10 (G0.6650.053)
Green excess sources g6 through g10 are located in close proximity to one another in a large IRDC complex. This IRDC is part of the dust ridge, and is adjacent to Sgr B2, one of the most massive star-forming regions in the Galaxy. The green sources are near the southern edge of the IRDC, just north of the bright Sgr B2 regions, suggestive that star formation is progressing from south to north in this cloud (Y-Z09). We assign the Galactic center distance to each of these green sources. Source g6, at 29.98.2 the most massive of our sources, appears reddish in Figure 8, and is coincident with bright 24 m emission. We do not associate g6 with any CH3OH maser emission, but we do detect a 6.7 GHz maser emission to its north. This maser site, which displays multiple velocity features, is not associated with any obvious IRAC emission, but is coincident with faint 24 m emission. Sources g7, g8, and g9 are shown in Figure 9. Bright green in color in the IRAC image, g7 also displays bright bright 24 m. It has a mass of 9.41.2, and is not associated with any CH3OH masers. Sources g8 and g9 are reddish in color, and the the region immediately surrounding them harbors seven 6.7 GHz masers (within 1′), along with several sites of 44 GHz maser emission (within 1′). The velocities of the 6.7 GHz masers fall in the range of 48-73 km s-1, and the 44 GHz masers fall in the range of 46-78 km s-1, both of which are consistent with the measured velocity of ionized gas seen toward this region. The large number of maser sites, along with their spread in velocity, indicates a high rate of star formation in this area. Source g9 has a mass of 21 7 M⊙, but due to a poorly constrained fit, g8 has no derived mass. Both g8 and g9 are located in a region of bright 24 m emission. Source g10 (9.50.7) displays extended 4.5 m emission, and is not coincident with 24 m emission (Fig. 10). We detect three 6.7 GHz masers in the g10 field, but none are close enough to be associated with the green source. Two of these masers display a single velocity feature, while the other shows two components. None of the maser sites are coincident with bright IRAC or 24 m emission.
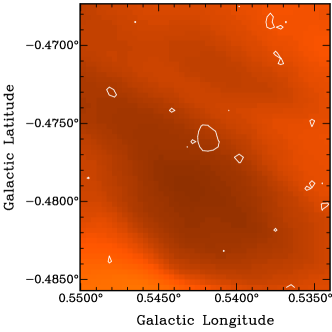
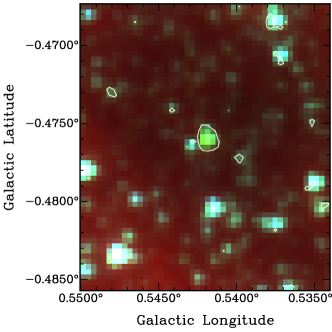
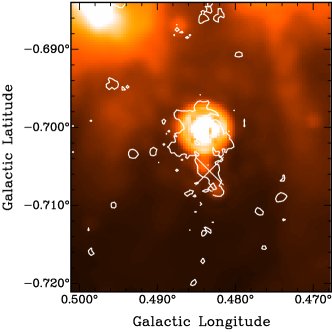
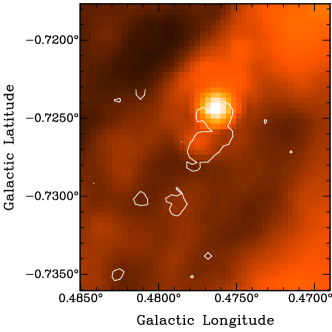
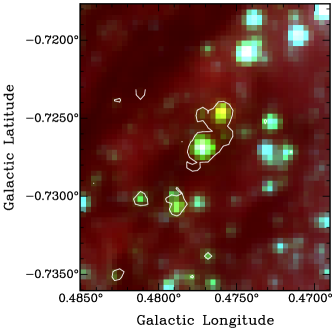
3.7.6 g11 (G0.5420.476), g12 (G0.5170.657), g13(G0.4830.701),g14 (G0.4770.727), g15 (G0.4080.504)
Foreground green excess sources g11-g15 are associated with the Sharpless 20 (Sh20; Sharpless, 1959; Dutra et al., 2003) star formation region, which is centered at ∘, b∘ (Maršálková, 1974). Source g11 (5.22.5 M⊙) displays bright, compact 4.5 m emission, but no correlated 24 m emission (Fig. 11). It is located within an IRDC, adjacent to a bright loop of 8 m emission that is likely part of Sh20. We did not detect any CH3OH masers toward g11. Green source g12, which has a mass of 2.1 1.2 M⊙, shows faint, extended 4.5 m emission along with coincident 24 m emission (Fig. 12). The IRDC that harbors g12 is adjacent to Sh20. We detect two 44 GHz CH3OH masers associated with g12, with single velocity features at 15 and 17 km s-1. One of the maser sites resides within the extent of the 4.5 m emission, while the other is 10″ away. The 4.5 m and 24 m emission from g13 are bright and extended (Fig. 13). This source is locate just south of Sh20, embedded within an IRDC. It has a mass of 9.9 1.7 M⊙, and we detect a single 44 GHz CH3OH maser toward it. This maser has a single velocity feature at 13 km s-1 that is located on a knot of 4.5 m emission 19″ away from the center of the green source. Located just south of g13, g14 displays two knots of 4.5 m emission, both of which are coincident with 24 m emission (Fig. 14). This 7.41.7 M⊙, source displays no CH3OH maser emission, and is found within an IRDC. Green source g15 (Fig. 15) shows extended 4.5 m emission coincident with 24 m emission. This source, with a mass of 14.3 4.2 M⊙, is not associated with a 44 GHz maser. The 4.5 m emission from g15 is positionally coincident with a 6.7 GHz maser that has a single velocity feature at 26 km s-1. It is also surrounded by a bright ring of 8 and 24 m emission, so it is unclear if g15 is embedded in an IRDC, or if the region in which it sits is only dark at 8 m relative to the bright ring of emission.
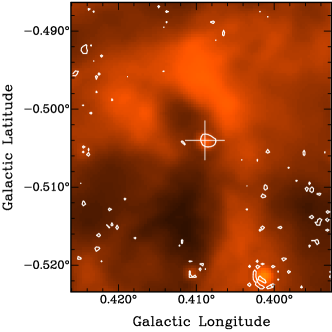
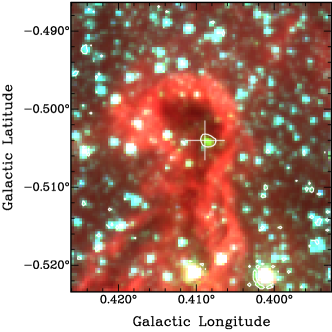
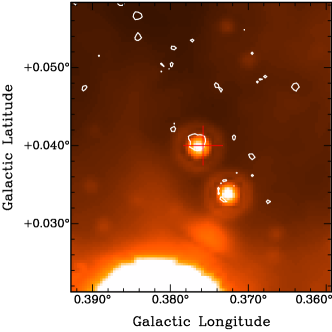
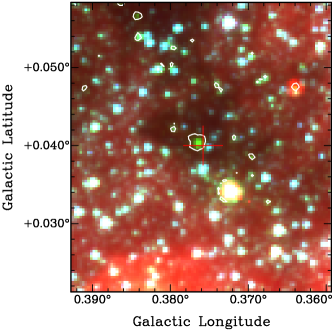
3.7.7 g16 (G0.376+0.040)
Located at the distance of the Galactic center, the extended green source g16 (Fig. 16) coincides with one of the string of submillimeter continuum emitting clouds that comprise the dust ridge. In addition to being located within an IRDC, g16 also displays bright 24 m emission. This source, with a mass of 10.1 0.6 M⊙, is coincident with a 6.7 GHz maser, but no 44 GHz maser. The 6.7 GHz maser has a single velocity feature at 37 km s-1, and is located 2″ away (detected by C10 only) from the center of the green source, but coincident with the enhanced 4.5 m emission.
3.7.8 g17 (G0.3150.201)
The foreground source g17 (Fig. 17) lies in the vicinity of two stellar cluster candidates that are located within 1′ of each other and within the Sharpless 20 region. This region also has variable X-ray emission, indicating the presence of very young stars (Law & Yusef-Zadeh, 2004). Source g17 is associated with an IRDC, and it displays no 24 m emission (one of only two with a maser and no 24 m emission). A possible reason for its lack of 24 m emission is that it lies next to a region of bright 24 m emission, which may be overwhelming any emission coincident with the 4.5 m emission. Green source g17, with a mass of 12.7 2.6 M⊙, is associated with pair of 6.7 GHz masers that are 5″ from the source. One of the maser sites displays a single velocity feature at 20 km s-1, and the other displays several features from 16–20 km s-1. As seen in Figure 17, both masers lie at an interface where bright 4.5 m emission transitions into bright 8 m emission. No 44 GHz maser is detected toward g17.
3.7.9 g18 (G0.1670.445)
Another foreground source, g18 is found toward the region RCW 141. This enhanced 4.5 m source appears orange in Figure 18, and has a mass of 14.0 4.3 M⊙. It is found within a filamentary IRDC and is associated with 24 m emission. While not detected in our data, a 6.7 GHz maser was detected by C10 positionally coincident with g18. The 6.7 GHz spectrum of this source displays several velocity features from 9–17 km s-1. No 44 GHz maser is detected toward g18.
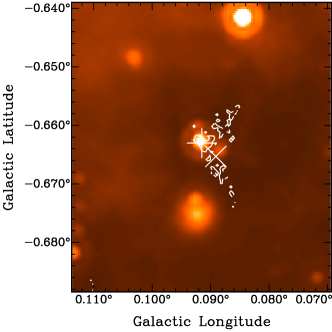
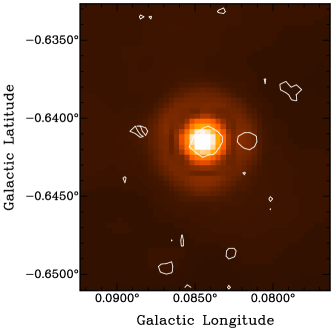
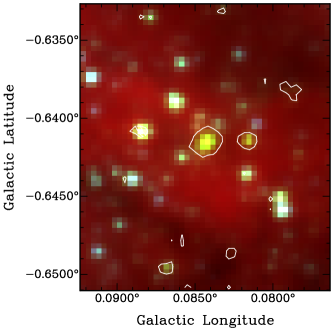
3.7.10 g19 (G0.0910.663), g20 (G0.0840.642)
Green sources g19 (Fig. 19) and g20 (Fig. 20), are located in close proximity to one another in the same IRDC complex toward the region RCW 141. Both sources are likely foreground to the Galactic center, and are coincident with bright 24 m emission. While g20 (7.3 1.3 M⊙) is not associated with any CH3OH masers, g19 (5.5 1.3 M⊙) is associated with a 6.7 GHz and a 44 GHz maser. The 6.7 GHz maser spectrum displays two bright features between 20 and 25 km s-1. It is located within the confines of the green source, 2″ from the center of its extended emission. The 44 GHz maser emission was detected 14″ from the green source, not directly on the 4.5 m emission. This 44 GHz maser displays a single emission feature at 17 km s-1.
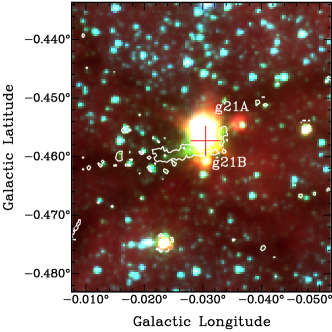
3.7.11 g21A (G359.9720.459A) and g21B (G359.9720.459B)
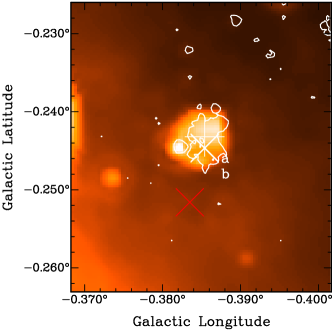
Single SED fits were performed for most green sources (Y-Z09), but g21 was best fit by two sources, designated g21A (11.8 2.5 M⊙) and g21B (23.8 6.6 M⊙). These sources are seen as distinct lobes of 4.5 m emission in Figure 21, and appear to be in the same star forming region, which is foreground to the Galactic center and in the vicinity of RCW 137. Like many of the other green sources, g21A and B are associated with an IRDC and are coincident with 24 m emission. There is one 6.7 GHz maser that is located 10″ from g21A and g21B (7″ and 1″, respectively). Because it is closer to g21B, we associate the maser with that source. This maser consists of a single, bright emission feature at 23 km s-1 in the C10 data. No 44 GHz masers are detected toward either of the g21 sources.
3.7.12 g22 (G359.939+0.170)
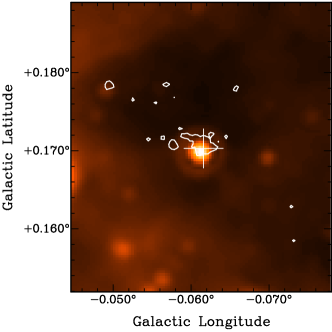
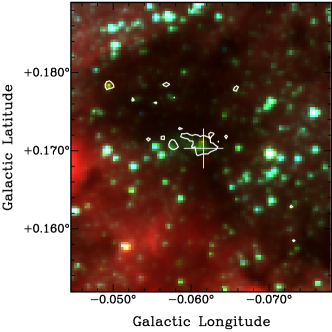
Another example of an extended green source embedded within an IRDC, g22 is likely located foreground to the Galactic center near an complex. The enhanced 4.5 m emission is coincident with both 24 m emission and a 6.7 GHz maser (Fig. 22). The maser has a single, bright emission feature at -0.8 km s-1, and is located directly on the green region that defines the source, close to the peak of the 24 m emission. Source g22 has a mass of 4.9 1.8 M⊙, and is not associated with any 44 GHz maser emission.
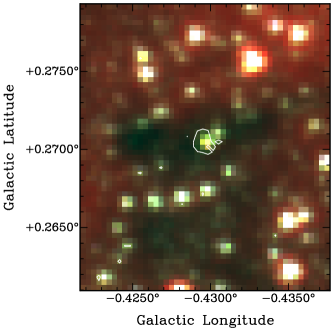
3.7.13 g23 (G359.9320.063)
Of all our sources, g23 is the closest (in projection) to the Galactic center. It is embedded in an IRDC that runs parallel to the Galactic plane, just south of Sgr A∗. It is a compact 4.5 m source (Fig. 23) with no 24 m counterpart. Source g23 has a mass of 12.0 3.2 M⊙, is located at the distance of the Galactic center, and is not associated with any CH3OH masers.
3.7.14 g24 (G359.9070.303)
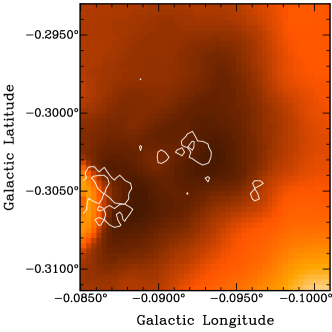
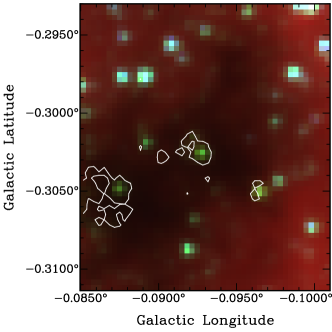
Green source g24 shows a clear enhancement at 4.5 m, but its emission at this wavelength is relatively faint (Fig. 24). It displays no corresponding 24 m emission, and no CH3OH maser emission. This source is located within an IRDC, adjacent to a region of bright 8 m emission. It has a mass of 6.3 2.5 M⊙, and is likely located foreground to the Galactic center.
3.7.15 g25 (G359.8410.080)
Much like g23, green source g25 is found within an IRDC that is south of Sgr A∗ and parallel to the Galactic plane. This source is comprised of two knots of 4.5 m emission (Fig. 25), the brighter of which is correlated with 24 m emission. This source, which displays no CH3OH maser emission, is located at the distance of the Galactic center and has a mass of 10.3 1.2 M⊙.
3.7.16 g26 (G359.6180.245)
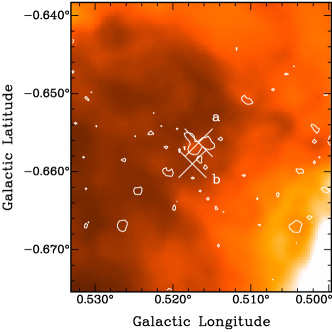
Similarly to sources g21A and g21B, green source g26 is located foreground to the Galactic center, and is in the vicinity of RCW 137. This bright, extended green source, which has a derived mass of 7.1 0.9 M⊙, is located within a plume-shaped IRDC and is coincident with 24 m emission (Fig. 26). 6.7 GHz maser emission is detected toward this source, and its spectrum displays multiple velocity features between 19 and 25 km s-1. The 6.7 GHz maser site is within the confines of the green source. In addition to the 6.7 GHz maser emission, we also detect two sites of 44 GHz maser emission 3″ away, with velocities of 19 and 20 km s-1. The multiple velocity features of 6.7 GHz maser emission, along with the multiple sites of 44 GHz maser emission, indicate that a cluster of stars may be forming in the IRDC that contains g26.
3.7.17 g27 (G359.5990.032)
What stands out about g27 (Fig. 27) is that it is the only green source not clearly associated with an IRDC. Its compact 4.5 m emission is, however, coincident with 24 m emission, indicating that it could still be a region of high-mass star formation. Indeed, it has a mass of 17.5 3.0 M⊙. This Galactic center green source is not associated with any 6.7 GHz maser emission, but is associated with a 44 GHz maser. This 44 GHz maser is 2″ from the center of the source, and has a velocity of 72 km s-1.
3.7.18 g28 (G359.57+0.270)
Source g28 is a faint, slightly extended 4.5 m source that is not coincident with 24 m emission (Fig. 28). Its height above the Galactic plane results in a distance assignment that is foreground to the Galactic center. This source (4.0 1.3 M⊙) is found within a small IRDC that has a relatively low 8 m flux decrement relative to its surroundings. We do not detect any CH3OH masers toward g28.
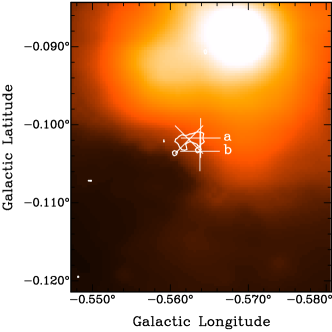
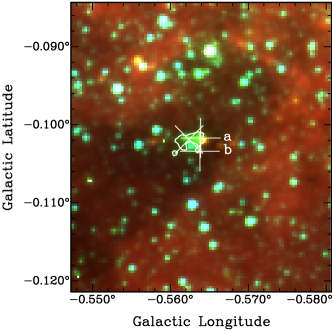
3.7.19 g29 (G359.4370.102)
Located in the Sgr C region at the distance of the Galactic center, green source g29 is embedded within an IRDC and displays extended 4.5 m emission (Fig. 29). This 14.1 2.4 M⊙ source is not associated with 24 m emission, making it one of only two sources that has maser emission but no 24 m emission. Despite the lack of this particular star-forming indicator, the association of g29 with both 6.7 and 44 GHz maser emission indicates that star formation is indeed underway toward this source. The 6.7 GHz maser emission arises in two locations that are near the edge of the 4.5 m emission and are 6″ apart. Each of these maser sites displays two velocity components (53 to 45 km s-1, and 57 to 53 km s-1). The single 44 GHz maser is 5″ from the center of green source, but still within the extent of the 4.5 m emission. This maser has a velocity of 66 km s-1.
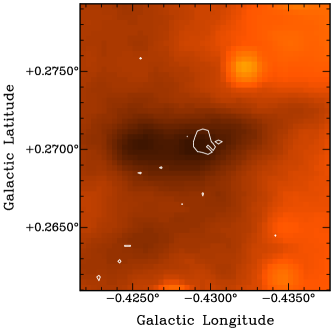
3.7.20 g30 (G359.30+0.033)
Green excess source g30 displays extended 4.5 m and is found within an IRDC that is long, filamentary, and perpendicular to the Galactic plane (Fig. 30). We find bright 24 m emission associated with this green source, but no CH3OH masers. This source is likely to be at the distance of the Galactic center, and it has a mass of 8.9 0.7 M⊙.
3.7.21 g31 (G359.199+0.041)
A compact, bright 4.5 m emission source, g31 is located at the distance of the Galactic center in an IRDC. It has a mass of 14.4 4.6 M⊙, and is coincident with 24 m emission. We detect a 6.7 GHz maser detected in the field, but it is 70″ away from g31, and thus not associated with the green source. The maser site is 15″ from a small region of bright 24 m emission, but is not near any bright IRAC emission. This 44 GHz maser displays a single velocity feature at 4 km s-1.
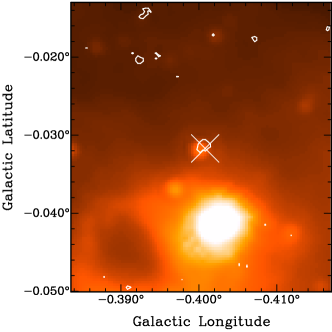
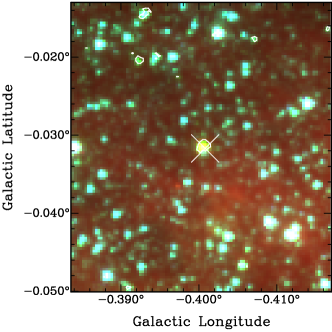
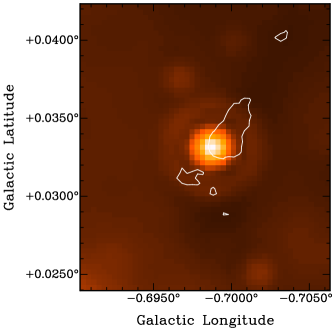
3.7.22 g32 (G358.980+0.084)
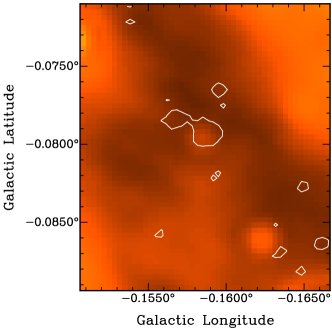
Green source g32 shows faint, extended 4.5 m emission (Fig. 32), is embedded within an IRDC, and is likely located at the distance of the Galactic center. This source is associated with bright 24 m emission and 6.7 GHz maser emission, making it very likely that this is a star-forming source. The 6.7 GHz maser emission is positionally coincident with the extended, enhanced 4.5 m emission, and displays a single velocity feature at 6 km s-1 (in the C10 data only). The SED fit for this source indicates that it has a mass of 10.5 6.0 M⊙. No 44 GHz maser emission is detected toward g32.
4 Discussion
4.1 Comparison of Galactic Center and Foreground Sources
The CMZ contains 5 107 M⊙ of molecular gas (Pierce-Price et al., 2000), including many prominent IRDCs. How exactly star formation proceeds in these clouds, however, remains unclear. Based on molecular line emission seen throughout the CMZ, such as SiO and HCO+ (e.g., Martín-Pintado et al., 2000; Riquelme et al., 2010), as well as several H lines of sight toward the CMZ (Oka et al., 2005), the chemistry of molecular gas in the Galactic center is likely to be different from the gas in the Galactic disk. In addition, a NH3 study of of Galactic center clouds distributed between l=∘ and 3∘ (Huettemeister et al., 1993) shows a two-temperature distribution of molecular gas at T200K and T25K, while the dust temperature of the clouds in the CMZ remains low ( 30 K; e.g., Odenwald & Fazio, 1984; Cox & Laureijs, 1989; Pierce-Price et al., 2000). Stronger turbulence (cf. Morris & Serabyn, 1996) also differentiates CMZ molecular clouds from their counterparts in the Galactic disk. Thus, it is possible that the unique environment in CMZ molecular clouds results in different initial conditions for star formation. The recent results of Y-Z09, however, show that the Kennicut law (Kennicutt, 1998) holds in the Galactic center, so the relationship between star formation rate per unit area and surface mass density in the Galactic center is similar to that of the Galactic disk, at least to first order. Nevertheless, it is possible that some important differences exist between Galactic center and disk star formation. To test this possibility, we compare the 6.7 (radiatively excited) and 44 GHz (collisionally excited) CH3OH maser detection rates toward foreground and Galactic center green sources. The foreground sources have 6.7 and 44 GHz CH3OH maser detection rates of 4417% and 2513%, respectively (errors for detection rates are calculated using counting statistics). Galactic center green sources have 6.7 GHz CH3OH maser detection rate of 3315%, and a 44 GHz maser detection rate of 2713%.
The overall detection rate of 44 GHz masers is roughly the same for foreground and Galactic center sources. The detection rate of 6.7 GHz masers may be higher for foreground sources than Galactic center sources, but taking into account their large error bars, they are also consistent with being the same (Fig. 33; see also Tables 4 and 5). The possible difference in the foreground and Galactic center 6.7 GHz maser detection rates could be due to small-number statistics (i.e., the relatively low number of sources resulting in large errors). If the statistics errors are taken as true 1 errors, then the difference in detection rates is roughly a 1 result. Thus, it is possible that the detection rates for 6.7 GHz CH3OH masers (in addition to the 44 GHz CH3OH masers) are the same for both foreground and Galactic center green sources. If this is the case, then we find no obvious difference between star formation in these two regions, as traced by CH3OH maser detections.
Despite the small number of statistics, we do, however, find that 2/7 (2920%) of foreground sources with 6.7 GHz masers have 44 GHz masers and that 3/5 (6035%) of Galactic center sources with 6.7 GHz masers have 44 GHz masers. Thus, the Galactic center sources with 6.7 GHz masers may have a relative overabundance of 44 GHz masers (again, a roughly 1 result). One possible explanation for this could be the properties of the molecular clouds that harbor the green sources. Pratap et al. (2008) show that 44 GHz maser emission is enhanced at high densities (n(H 10 cm-3) and warm temperatures (80 to 200 K). Thus, the environment in clouds within the Galactic center may give rise to more favorable conditions for the creation of the 44 GHz CH3OH masers.
Although not firmly established, some recent work (Ellingsen et al., 2007; Breen et al., 2010) has proposed a sequence of CH3OH maser evolution in star forming regions. In this evolutionary sequence, Class I CH3OH masers, generated by protostellar outflows, are formed before Class II CH3OH masers, with an overlap period lasting years. Subsequent work by Voronkov et al. (2010) shows that Class I masers are also formed at later evolutionary states, when expanding regions collide with neighboring molecular clouds, possibly accounting for the exceptions noted by Breen et al. (2010) to their proposed sequence. If this sequence is correct, then a relative over-abundance of 44 GHz masers in Galactic center sources, along with a relative under-abundance of 6.7 GHz masers, suggests that the Galactic center sources are, on average, younger than the foreground sources. According to Y-Z09, there was a burst in the Galactic center star formation rate about 105 years ago (rising to 1.4 M⊙ yr-1), which may have given rise to an over-abundance of Stage I young stellar objects in the Galactic center, supporting this result. Other recent work (e.g., Fontani et al., 2010), however, suggests that there is no correlation between evolutionary state and CH3OH maser class, so further study is needed to test these results.
We also compare our maser detection results with other studies of CH3OH maser emission toward 4.5 m emission sources. In one study, Chambers et al. (2009) studied 25 GHz Class I CH3OH maser emission toward a sample of 47 green fuzzies found within IRDCs. These green fuzzies were located using the Green Fuzzy Finder (GFF), which identifies contiguous pixels with an enhancement at 4.5 m. In another study, Cyganowski et al. (2009) studied 6.7 and 44 GHz CH3OH maser emission toward a sample of 20 EGOs. Cyganowski et al. (2009) identified EGOs by eye using 3-color images created with GLIMPSE data (Cyganowski et al., 2008). Chen et al. (2009) also searched for a correlation between EGOs and Class I CH3OH maser emission, using the results of four previously published CH3OH maser searches. Green fuzzies and EGOs have different selection criteria from one another, and from our sample of 31 green sources, but comparisons of the CH3OH maser detection rates may provide some insight into how these sources are related. For simplicity, we refer to the three types of enhanced 4.5 m sources as green sources.
Chambers et al. (2009) find that 17% of 47 green sources in Galactic disk IRDCs are associated with Class I CH3OH maser emission. Cyganowski et al. (2009) searched for CH3OH maser emission toward a sample of 20 green sources, and report that 65% of their sample harbor 6.7 GHz masers, 90% of which also display 44 GHz maser emission. Chen et al. (2009) find that 67% of a sample of 61 sources are associated with Class I CH3OH masers. In our sample of 31 green sources, 12 (39 11%) are associated with 6.7 GHz masers, 8 (26 9%) are associated with 44 GHz masers, and 5 (16 7%) are associated with both maser transitions. Our Class I maser detection rate (26 9%) is in rough agreement with that of Chambers et al. (2009). The similarity of the maser detection rates, along with the association of both sets of sources with IRDCs and 24 m emission, indicates that our green sources are similar in nature to the green sources studied by Chambers et al. (2009).
The difference in the 6.7 GHz maser detection rate between our green sources (39 11%) and the Cyganowski et al. (2009) sample of green sources (65%) is fairly large. Moreover, we find that only 5 of the 12 sources with 6.7 GHz masers (42 19%) also harbor 44 GHz maser emission, while Cyganowski et al. (2009) and Chen et al. (2009) both find higher Class I detection rates. A possible reason for these discrepancies is that the Cyganowski et al. (2009) and Chen et al. (2009) green sources are larger in angular extent than our green sources. The green sources in our sample are roughly 5-10″ in size. The typical green source size in the Cyganowski et al. (2009) and Chen et al. (2009) samples, however, is 10-20″, with some as large as 30″ or more. If we assume that these larger green sources are located at roughly similar distances to the sources in our sample, then their larger angular sizes would correspond to larger physical sizes. Because the extended 4.5 m emission is associated with outflows, it stands to reason that the Cyganowski et al. (2009) and Chen et al. (2009) green sources are associated with larger outflows, and are therefore more evolved. The larger, more evolved outflows have a greater surface area of interaction with the surrounding medium, thereby possibly explaining the increased 44 GHz detection rate toward the Cyganowski et al. (2009) and Chen et al. (2009) samples. Alternatively, the difference in the maser detection rates could be due to the the variable nature of CH3OH maser emission (Goedhart et al., 2004), combined with the different sensitivities of the surveys. Indeed, the 6 sensitivity for the Cyganowski et al. (2009) 6.7 GHz observations is 0.16 Jy, and the 3 sensitivity of our 6.7 GHz observations is 0.15 Jy.
4.2 Green Sources with and without 24 m Emission
Both enhanced 4.5 m emission (used to identify green sources) and 24 m emission are star formation indicators, and when they are coincident with one another, they are a powerful identifier of active star formation (Beuther & Steinacker, 2007; Cyganowski et al., 2008; Chambers et al., 2009). We find that 77% (24 of 31) of the green sources in our sample are coincident with 24 m emission. The detection rate of 6.7 GHz CH3OH masers for green sources coincident with 24 m emission is 4614%, and is 2920% for those without 24 m emission. The detection rate of 44 GHz CH3OH masers for green sources coincident with 24 m emission is 2911%. We detect only one 44 GHz CH3OH maser toward a green source without 24 m emission (detection rate of 1414%). Again, we are limited by the small number of statistics and the large errors, and conclusions drawn from this sample should be taken with caution. Nevertheless, it appears that green sources with 24 m emission are more likely to harbor both 6.7 and 44 GHz CH3OH masers than the green sources that are not coincident with 24 m emission (see Tables 4 and 5). If true, these results once again show that the combination of enhanced 4.5 m emission, 24 m emission, and CH3OH maser emission are reliable protostellar locators.
Even though the green sources that are coincident with 24 m emission seem more likely to harbor CH3OH masers, we do detect masers toward green sources that display no 24 m emission. These sources may contain 24 m emission too faint to detect using our MIPS data. Alternatively, they may be at a different, perhaps earlier, evolutionary state, before the dust around the central protostar has heated sufficiently to emit brightly at 24 m. Finally, it is also possible that some (or all) of these green sources are not related to star formation. For example, planetary nebulae may also appear as 4.5 m enhancement sources–recall that three green sources in our original sample have been excluded from this analysis because their positions coincide with those of known planetary nebulae.
4.3 Masses of Green Sources with and without CH3OH Masers
We find that higher-mass sources are more likely to harbor 6.7 GHz CH3OH masers than lower-mass sources. The median mass of green sources associated with 6.7 GHz CH3OH masers is 12.7 M⊙, while the median mass for those not associated with 6.7 GHz CH3OH masers is 9.5 M⊙ (see Fig. 34). Using a Kolmogorov-Smirnov (K-S) test, we calculate a 76% chance that the mass distributions of green sources with and without 6.7 GHz CH3OH maser emission are drawn from a different parent distribution. The median mass of sources with 44 GHz CH3OH masers is 9.9 M⊙, and the median mass for those without is 10.3 M⊙ (see Fig. 34). We find only a 5% chance that the mass distributions of sources with and without 44 GHz CH3OH masers are drawn from a different parent distribution (according to a K-S test). Because the mass distributions of green sources with and without 6.7 GHz masers are likely to be different, and because the population associated with 6.7 CH3OH masers has a larger median mass than those without, we conclude that higher-mass sources are more likely to display 6.7 GHz maser emission than lower-mass sources. The case is less clear for the 44 GHz masers, the detections of which show no clear correlation with mass.
The lowest mass that a 6.7 GHz maser is associated with is 4.91.8 M⊙ (g22). Because the masses determined by Y-Z09 are the current masses of the sources (not the final masses), it is possible that this source will evolve into a high-mass ( 8 M⊙) star through accretion, consistent with the idea that 6.7 GHz CH3OH maser emission exclusively traces high-mass star formation. Moreover, g22 is assumed to be foreground to the Galactic center; if it is instead at the distance of the Galactic center, its derived mass would increase. The lowest mass source associated with a 44 GHz maser is 2.11.2 M⊙ (g12). Because of its lower mass, the likelihood of this source evolving into a high-mass star is smaller. The association of g12 with a 44 GHz maser supports with the hypothesis that this maser transition traces low-mass star formation in addition to high-mass star formation.
5 Conclusions
To study how star formation in the Galactic center’s CMZ may differ from that of the Galactic disk, we studied CH3OH maser emission toward a sample of 34 green sources. Of the 15 Galactic center green sources, we find that 5 are associated with radiatively excited Class II 6.7 GHz CH3OH maser emission, and 4 are associated with collisionally excited Class I 44 GHz CH3OH maser emission. Of the 16 green sources located foreground to the Galactic center, we find that 8 are associated with 6.7 GHz CH3OH maser emission, and 4 are associated with 44 GHz CH3OH maser emission. Based on these detections, we find: (1) little difference between the sources in the Galactic center and the foreground sources, (2) that the 34 green sources in our sample are similar to the green sources identified by Chambers et al. (2009) rather than the larger green sources identified by Cyganowski et al. (2008), and (3) that the possible relative overabundance of green sources with both 6.7 and 44 GHz masers in the Galactic center may be consistent with a recent burst of star formation in the Galactic center.
References
- Arendt et al. (2008) Arendt, R. G., et al. 2008, ApJ, 682, 384
- Bally et al. (2010) Bally, J., et al. 2010, ApJ, 721, 137
- Benjamin et al. (2003) Benjamin, R. A., et al. 2003, PASP, 115, 953
- Breen et al. (2010) Breen, S. L., Ellingsen, S. P., Caswell, J. L., & Lewis, B. E. 2010, MNRAS, 401, 2219
- Beuther et al. (2005) Beuther, H., Sridharan, T. K., & Saito, M. 2005, ApJ, 634, L185
- Beuther & Steinacker (2007) Beuther, H., & Steinacker, J. 2007, ApJ, 656, L85
- Caswell (1997) Caswell, J. L. 1997, MNRAS, 289, 203
- Caswell et al. (2010) Caswell, J. L., et al. 2010, MNRAS, 404, 1029
- Chambers et al. (2009) Chambers, E. T., Jackson, J. M., Rathborne, J. M., & Simon, R. 2009, ApJS, 181, 360
- Chen et al. (2009) Chen, X., Ellingsen, S. P., & Shen, Z.-Q. 2009, MNRAS, 396, 1603
- Cox & Laureijs (1989) Cox, P., & Laureijs, R. 1989, The Center of the Galaxy, 136, 121
- Cragg et al. (1992) Cragg, D. M., Johns, K. P., Godfrey, P. D., & Brown, R. D. 1992, MNRAS, 259, 203
- Cyganowski et al. (2008) Cyganowski, C. J., et al. 2008, AJ, 136, 2391
- Cyganowski et al. (2009) Cyganowski, C. J., Brogan, C. L., Hunter, T. R., & Churchwell, E. 2009, ApJ, 702, 1615
- De Buizer & Vacca (2010) De Buizer, J. M., & Vacca, W. D. 2010, AJ, 140, 196
- Dutra et al. (2003) Dutra, C. M., Ortolani, S., Bica, E., Barbuy, B., Zoccali, M., & Momany, Y. 2003, A&A, 408, 127
- Ellingsen (2005) Ellingsen, S. P. 2005, MNRAS, 359, 1498
- Ellingsen et al. (2007) Ellingsen, S. P., Voronkov, M. A., Cragg, D. M., Sobolev, A. M., Breen, S. L., & Godfrey, P. D. 2007, IAU Symposium, 242, 213
- Fazio et al. (2004) Fazio, G. G., et al. 2004, ApJS, 154, 10
- Fontani et al. (2010) Fontani, F., Cesaroni, R., & Furuya, R. S. 2010, arXiv:1004.3689
- Foster et al. (2011) Foster, J. B., Jackson, J. M., Chambers, E. T., & Stojimirovic, I. 2011, ApJ, in prep.
- Goedhart et al. (2004) Goedhart, S., Gaylard, M. J., & van der Walt, D. J. 2004, MNRAS, 355, 553
- Green et al. (2009) Green, J. A., et al. 2009, MNRAS, 392, 783
- Huettemeister et al. (1993) Huettemeister, S., Wilson, T. L., Bania, T. M., & Martin-Pintado, J. 1993, A&A, 280, 255
- Jacoby & Van de Steene (2004) Jacoby, G. H., & Van de Steene, G. 2004, A&A, 419, 563
- Kalenskiĭ et al. (2006) Kalenskiĭ, S. V., Promyslov, V. G., Slysh, V. I., Bergman, P., & Winnberg, A. 2006, Astronomy Reports, 50, 289
- Kalenskiĭet al. (2010) Kalenskii, S. V., Johansson, L. E. B., Bergman, P., Kurtz, S., Hofner, P., Walmsley, C. M., & Slysh, V. I. 2010, MNRAS, 405, 613
- Kennicutt (1998) Kennicutt, R. C., Jr. 1998, ARA&A, 36, 189
- Kurtz et al. (2004) Kurtz, S., Hofner, P., & Álvarez, C. V. 2004, ApJS, 155, 149
- Law & Yusef-Zadeh (2004) Law, C., & Yusef-Zadeh, F. 2004, ApJ, 611, 858
- Lis & Carlstrom (1994) Lis, D. C., & Carlstrom, J. E. 1994, ApJ, 424, 189
- Lis & Menten (1998) Lis, D. C., & Menten, K. M. 1998, ApJ, 507, 794
- Lis et al. (2001) Lis, D. C., Serabyn, E., Zylka, R., & Li, Y. 2001, ApJ, 550, 761
- Liszt (2009) Liszt, H. S. 2009, arXiv:0905.1412
- Maršálková (1974) Maršálková, P. 1974, Ap&SS, 27, 3
- Martín-Pintado et al. (2000) Martín-Pintado, J., de Vicente, P., Rodríguez-Fernández, N. J., Fuente, A., & Planesas, P. 2000, A&A, 356, L5
- Menten (1991) Menten, K. M. 1991, ApJ, 380, L75
- Minier et al. (2003) Minier, V., Ellingsen, S. P., Norris, R. P., & Booth, R. S. 2003, A&A, 403, 1095
- Morimoto et al. (1985) Morimoto, M., Kanzawa, T., & Ohishi, M. 1985, ApJ, 288, L11
- Morris & Serabyn (1996) Morris, M., & Serabyn, E. 1996, ARA&A, 34, 645
- Muzerolle et al. (2004) Muzerolle, J., et al. 2004, ApJS, 154, 379
- Odenwald & Fazio (1984) Odenwald, S. F., & Fazio, G. G. 1984, ApJ, 283, 601
- Oka et al. (2005) Oka, T., Geballe, T. R., Goto, M., Usuda, T., & McCall, B. J. 2005, ApJ, 632, 882
- Pierce-Price et al. (2000) Pierce-Price, D., et al. 2000, ApJ, 545, L121
- Plambeck & Menten (1990) Plambeck, R. L., & Menten, K. M. 1990, ApJ, 364, 555
- Pratap et al. (2008) Pratap, P., Shute, P. A., Keane, T. C., Battersby, C., & Sterling, S. 2008, AJ, 135, 1718
- Ramírez et al. (2008) Ramírez, S. V., Arendt, R. G., Sellgren, K., Stolovy, S. R., Cotera, A., Smith, H. A., & Yusef-Zadeh, F. 2008, ApJS, 175, 147
- Rathborne et al. (2005) Rathborne, J. M., Jackson, J. M., Chambers, E. T., Simon, R., Shipman, R., & Frieswijk, W. 2005, ApJ, 630, L181
- Rathborne et al. (2006) Rathborne, J. M., Jackson, J. M., & Simon, R. 2006, ApJ, 641, 389
- Rieke et al. (2004) Rieke, G. H., et al. 2004, ApJS, 154, 25
- Riquelme et al. (2010) Riquelme, D., Bronfman, L., Mauersberger, R., May, J., & Wilson, T. L. 2010, A&A, 523, A45
- Robitaille et al. (2006) Robitaille, T. P., Whitney, B. A., Indebetouw, R., Wood, K., & Denzmore, P. 2006, ApJS, 167, 256
- Robitaille et al. (2007) Robitaille, T. P., Whitney, B. A., Indebetouw, R., & Wood, K. 2007, ApJS, 169, 328
- Sharpless (1959) Sharpless, S. 1959, ApJS, 4, 257
- Stolovy et al. (2006) Stolovy, S., et al. 2006, Journal of Physics Conference Series, 54, 176
- Slysh et al. (1994) Slysh, V. I., Kalenskii, S. V., Valtts, I. E., & Otrupcek, R. 1994, MNRAS, 268, 464
- Val’tts et al. (2000) Val’tts, I. E., Ellingsen, S. P., Slysh, V. I., Kalenskii, S. V., Otrupcek, R., & Larionov, G. M. 2000, MNRAS, 317, 315
- Van de Steene & Jacoby (2001) Van de Steene, G. C., & Jacoby, G. H. 2001, A&A, 373, 536
- Voronkov et al. (2006) Voronkov, M. A., Brooks, K. J., Sobolev, A. M., Ellingsen, S. P., Ostrovskii, A. B., & Caswell, J. L. 2006, MNRAS, 373, 411
- Voronkov et al. (2010) Voronkov, M. A., Caswell, J. L., Ellingsen, S. P., & Sobolev, A. M. 2010, MNRAS, 405, 2471
- Walsh et al. (2001) Walsh, A. J., Bertoldi, F., Burton, M. G., & Nikola, T. 2001, MNRAS, 326, 36
- Whitney et al. (2003a) Whitney, B. A., Wood, K., Bjorkman, J. E., & Cohen, M. 2003, ApJ, 598, 1079
- Whitney et al. (2003b) Whitney, B. A., Wood, K., Bjorkman, J. E., & Wolff, M. J. 2003, ApJ, 591, 1049
- Whitney et al. (2004) Whitney, B. A., Indebetouw, R., Bjorkman, J. E., & Wood, K. 2004, ApJ, 617, 1177
- Yusef-Zadeh et al. (2007) Yusef-Zadeh, F., et al. 2007, IAU Symposium, 242, 366
- Yusef-Zadeh et al. (2009) Yusef-Zadeh, F., et al. 2009, ApJ, 702, 178
G1.0410.072
G0.9550.786

G0.8680.697
G0.7800.740
G0.8260.211
G0.7080.408
G0.6930.045

G0.6790.037, G0.6670.037, G0.6670.035


G0.6650.053


G0.5420.476
G0.5170.657


G0.4830.701


G0.4770.727
G0.4080.504

G0.3760.040
G0.3150.201


G0.1670.445
G0.0910.663


G0.0840.642
G359.9720.459

G359.9390.170

G359.9320.063
G359.9070.303
G359.8410.080

G359.6180.245


G359.5990.032

G359.570.270
G359.4370.102


G359.300.033

G359.1990.041


G358.9800.084


| Source | Galactic | 24 m | Mass | 6.7 GHz | 44 GHz | ||
|---|---|---|---|---|---|---|---|
| Number | (∘) | (∘) | Location | Emission | (M⊙) | Maser | Maser |
| g0 | 1.0407 | 0.0714 | GC | Y | 16.1 3.5 | N | N |
| g1 | 0.9555 | 0.7853 | FG | Y | 2.4 0.6 | N | N |
| g2 | 0.8679 | 0.6963 | FG | Y | 5.5 1.3 | N | N |
| g3 | 0.8262 | 0.2108 | GC | Y | 10.6 0.0 | N | N |
| g4 | 0.7800 | 0.7395 | FG | Y | 6.9 1.9 | N | N |
| g5 | 0.7062 | 0.4075 | FG | Y | 6.0 3.0 | N | N |
| g6 | 0.6934 | 0.0451 | GC | Y | 29.9 8.2 | N | N |
| g7 | 0.6796 | 0.0376 | GC | Y | 9.4 1.2 | N | N |
| g8 | 0.6670 | 0.0370 | GC | Y | – | Y | Y |
| g9 | 0.6667 | 0.0352 | GC | Y | 21.7 7 | Y | Y |
| g10 | 0.6655 | 0.0535 | GC | N | 9.5 0.7 | N | N |
| g11 | 0.5418 | 0.4759 | FG | N | 5.2 2.5 | N | N |
| g12 | 0.5172 | 0.6569 | FG | Y | 2.1 1.2 | N | Y |
| g13 | 0.4835 | 0.7004 | FG | Y | 9.9 1.7 | N | Y |
| g14 | 0.4771 | 0.7268 | FG | Y | 7.4 1.7 | N | N |
| g15 | 0.4084 | 0.5042 | FG | Y | 14.3 4.2 | Y | N |
| g16 | 0.3763 | 0.0402 | GC | Y | 10.1 0.6 | Y | N |
| g17 | 0.3153 | 0.2010 | FG | N | 12.7 2.6 | Y | N |
| g18 | 0.1667 | 0.4455 | FG | Y | 14 4.3 | Y | N |
| g19 | 0.0915 | 0.6624 | FG | Y | 5.5 1.3 | Y | Y |
| g20 | 0.0842 | 0.6415 | FG | Y | 7.3 1.3 | N | N |
| g21A | 359.9700 | 0.4554 | FG | Y | 11.8 2.5 | N | N |
| g21B | 359.9695 | 0.4573 | FG | Y | 23.8 6.6 | Y | N |
| g22 | 359.9386 | 0.1709 | FG | Y | 4.9 1.8 | Y | N |
| g23 | 359.9316 | 0.0626 | GC | N | 12.0 3.2 | N | N |
| g24 | 359.9072 | 0.3026 | FG | N | 6.3 2.5 | N | N |
| g25 | 359.8412 | 0.0793 | GC | Y | 10.3 1.2 | N | N |
| g26 | 359.6148 | 0.2438 | FG | Y | 7.1 0.9 | Y | Y |
| g27 | 359.5995 | 0.0316 | GC | Y | 17.5 3 | N | Y |
| g28 | 359.5701 | 0.2704 | FG | N | 4.0 1.3 | N | N |
| g29 | 359.4362 | 0.1017 | GC | N | 14.1 2.4 | Y | Y |
| g30 | 359.3009 | 0.0334 | GC | Y | 8.9 0.7 | N | N |
| g31 | 359.1994 | 0.0419 | GC | Y | 14.4 4.6 | N | N |
| g32 | 358.9795 | 0.0840 | GC | Y | 10.5 6 | Y | N |
| Green Source | Right Ascension | Declination | Velocity | Peak Intensity |
|---|---|---|---|---|
| Field | (J2000) | (J2000) | (km s-1) | (Jy beam-1) |
| g6 | 17:47:24.7 | 28:21:44.2 | 68.9 | 12.2 |
| g7, g8, g9 | 17:47:19.3 | 28:22:16.4 | 73.8 | 1.3 |
| g7, g8, g9 | 17:47:20.1 | 28:23:14.0 | 60.6 | 1.9 |
| g7, g8, g9 | 17:47:20.1 | 28:23:48.2 | 52.4 | 1.9 |
| g7, g8, g9 | 17:47:18.7 | 28:22:56.0 | 71.1 | 10.3 |
| g7, g8, g9 | 17:47:20.1 | 28:22:42.2 | 58.5 | 2.5 |
| g10 | 17:47:22.1 | 28:24:43.6 | 51.3 | 1.2 |
| g10 | 17:47:18.6 | 28:24:25.6 | 49.7 | 19.6 |
| g10 | 17:47:21.1 | 28:24:19.3 | 48.6 | 5.5 |
| g15 | 17:48:33.4 | 28:50:51.9 | 26.0 | 0.6 |
| g17 | 17:47:9.1 | 28:46:16.0 | 18.4 | 26.1 |
| g17 | 17:47:9.3 | 28:46:16.9 | 20.0 | 2.3 |
| g19 | 17:48:25.9 | 29:12:6.2 | 22.2 | 13.7 |
| g22 | 17:44:48.6 | 28:53:59.4 | 0.8 | 0.7 |
| g26 | 17:45:39.1 | 29:23:30.8 | 22.8 | 13.8 |
| g29 | 17:44:40.6 | 29:28:15.7 | 46.4 | 46.4 |
| g29 | 17:44:40.1 | 29:28:13.0 | 56.3 | 0.8 |
| g31 | 17:43:37.4 | 29:36:10.3 | 4.1 | 1.4 |
| Green Source | Right Ascension | Declination | Velocity | Peak Intensity |
|---|---|---|---|---|
| Field | (J2000) | (J2000) | (km s-1) | (Jy beam-1) |
| g12 | 17:49:24.431 | 28:50:01.86 | 16.8 | 3.2 |
| g12 | 17:49:25.177 | 28:50:04.24 | 15.5 | 1.4 |
| g13 | 17:49:31.301 | 28:53:16.04 | 12.8 | 3.4 |
| g19 | 17:48:26.095 | 29:12:17.76 | 16.6 | 7.2 |
| g26 | 17:45:39.408 | 29:23:33.48 | 18.9 | 15.4 |
| g26 | 17:45:39.386 | 29:23:33.06 | 20.2 | 9.0 |
| g27 | 17:44:47.163 | 29:17:40.70 | 71.9 | 2.9 |
| g29 | 17:44:40.385 | 29:28:08.64 | 65.8 | 2.7 |
| Total | With 6.7 GHz | With 44 GHz | |
|---|---|---|---|
| Number | Masers | Masers | |
| All green sources aaExcludes the three planetary nebulae (g1, g2, and g4). | 31 | 12 (39 11%) | 8 (26 9%) |
| Foreground sources | 16 | 7 (44 17%) | 4 (25 13%) |
| Galactic center sources | 15 | 5 (33 15%) | 4 (27 13%) |
| Sources with 24 m emission | 24 | 11 (46 14%) | 7 (29 11%) |
| Sources with no 24 m emission | 7 | 2 (29 20%) | 1 (14 14%) |
| FG Sources | GC Sources | |||
|---|---|---|---|---|
| Number | PercentaaCalculated using the total number of foreground sources, which is 16 (excluding the three PNe). | Number | PercentbbCalculated using the total number of Galactic center sources, which is 15. | |
| 6.7 GHz CH3OH Maser | 7 | 44 17 % | 5 | 33 15 % |
| 44 GHz CH3OH Maser | 4 | 25 13 % | 4 | 27 13 % |
| 24 m emission | 12 | 75 22 % | 12 | 80 23 % |
| Associated with IRDC | 16 | 100 25 % | 14 | 93 25 % |
| Median Mass (Mass Range) | 7.3 M⊙ (2.1 to 23.8 M⊙) | 12.0 M⊙ (8.9 to 29.9 M⊙) | ||