Modelling dynamic route choice of pedestrians to assess the criticality of building evacuation
Abstract
This paper presents an event-driven way finding algorithm for pedestrians in an evacuation scenario, which operates on a graph-based structure. The motivation of each pedestrian is to leave the facility. The events used to redirect pedestrians include the identification of a jam situation and/or identification of a better route than the current. This study considers two types of pedestrians: familiar and unfamiliar with the facility. Four strategies are modelled to cover those groups. The modelled strategies are the shortest path (local and global); They are combined with a quickest path approach, which is based on an observation principle. In the quickest path approach, pedestrians take their decisions based on the observed environment and are routed dynamically in the network using an appropriate cost benefit analysis function. The dynamic modelling of route choice with different strategies and types of pedestrians considers the manifold of influences which appears in the real system and raises questions about the criticality of an evacuation process. To address this question criteria are elaborated. The criteria we focus on in this contribution are the evacuation time, the individual times spent in jam, the jam size evolution and the overall jam size itself. The influences of the different strategies on those evaluation criteria are investigated. The sensibility of the system to disturbances (e.g. broken escape route) is also analysed.
keywords:
pedestrian dynamics , routing, quickest path, evacuation, jam, critical states.1 Introduction
In recent years pedestrian dynamics has gained more importance and a lot of attention due to continuously growing urban population and cities combined with an increase of mass events. This sets new challenges to architects, urban planners and organizers of mass events. One of the main goals is an effective use of the designed facility, for instance by minimizing jams thereby optimizing the traffic flow. In this context pedestrian simulations are already used, e.g. for escape route design [1, 2, 3, 4]. However the approaches used in these simulations are only the first step to model the manifold influences on human beings during an evacuation process. Major issues in this area include orientation and way finding: Given a set of possible routes, which criteria influence pedestrians choice for a particular route? This is essential for reproducing route choice in computer models and is difficult due to the many underlying subjective influences on this choice. The manner by which pedestrians choose their way has a direct influence not only on the overall evacuation time but also on the average time pedestrians spend in a jam. In this paper we restrict ourselves to the case where pedestrians all have the same motivation, to leave the facility.
The approaches of modelling pedestrians motion fall into two main groups: microscopic and macroscopic models. Microscopic models are further categorized in spatially discrete (e.g. Cellular Automata [5, 6, 7]) and spatially continuous models (e.g. Social Force Model [8], Generalized Centrifugal Force Model [9]). For a detailed overview we refer to [10]. CA models use floor fields (static and/or dynamic) to direct pedestrians to a destination point. Route choice in continuous models can be achieved by means of a network which consists of a set of destination points. This type of way finding is known as graph-based routing [11, 12, 13, 14, 15]. The destination points can be pre-determined (exits for instance) or adjustable (crossings, turning point at the end of a corridor for instance). The minimal network is usually a a visibility graph (see [16] for more details) which ensures that any location on the facility is within the visibility range of at least one node. The initial network can be refined by adding more adjustable points converging to CA [17]. This graph can be extended to a navigation graph by adding more adjustable points. The generation of such graph is a complex process, some efficient methods are presented in [18, 19]. Once built the shortest path is usually determined using well established algorithms such as Dijkstra [20] or Floyd warshall [21]. Such networks are widely spread in motion planning by robots as well.
The intrinsic behaviour of humans in the case of an evacuation is generally to follow the seemingly (self estimated) quickest path. This is indeed a subjective notion as it depends on some prerequisites, e.g. whether or not the pedestrian is familiar with the facility. The modelling of the quickest path is achieved by systematically avoiding congestions. In CA this is achieved by means of dynamic floor fields [22] where pedestrians moving increase the probability of using that path thereby making it more attractive for other pedestrians. This implicitly leads to congestion avoidance. The density in front of the moving pedestrians within their sight range is also considered [23] as well as the payload at exits [24]; other approaches include navigation fields [25, 26]. Continuous models usually optimize the travel time in the constructed network. In [27], pedestrians minimize their travel time by solving the Hamilton-Jacobi-Bellman equation yielding to the optimal pedestrians path at each time step. A combination of a graph-based routing with CA is presented in [18] where the fastest path for pedestrians is computed using a heuristic algorithm [28].
In this contribution an event driven way finding in a graph-based structure is introduced. The approach is based on an observation principle, pedestrians observe their environment and take their final decision based on the obtained data. With this observation the quickest path is achieved. The modelled strategies are the local shortest path (LSP), the global shortest path (GSP), the local shortest combined with the quickest path (LSQ) and finally the global shortest combined with the quickest path (GSQ).
An important point less discussed is given by the criticality of an evacuation process, first and foremost the meaning of criticality for an evacuation process. Evaluation criteria like the building itself, the population size and the initial distribution of the evacuees, the evacuation time are discussed in [29]. More individual criteria like the individual travel time and waiting time are investigated in [30]. The most used criteria are the overall evacuation time and a visualisation of the evacuation process at specific times. In this paper we elaborate other criteria to address the criticality of an evacuation simulation. The analysed criteria are the individual time spent in jam, the jam size evolution over time and the total jam size defined as the area under the jam size evolution. We give a special credit to the time pedestrians spend in jam as well as the jam size. This is of particular importance. In the case of the Hermes project [31], there are congestions that vary (in place and size) depending on the type of people attending the events. We try to reproduce this observed phenomenon for the forecast of the evacuation dynamic. In order to achieve this, route choice has to be individually modelled. Those events involve pedestrians familiar and unfamiliar with the facility. The four previously mentioned strategies are proposed to reproduce their route choice. Their influences on the previous mentioned criteria are investigated.
The modelling approaches are presented in the second section. The third section describes the evacuation assessment criteria. The analysis of the results including simulation, distribution of the evacuation time and distribution of the individual times spent in jam using different initial conditions are discussed in the fourth section.
2 Modelling
The framework used for describing pedestrian traffic can be divided in a three-tiers structure. One distinguishes between the strategic, the tactical and the operational level [27]. In our model the operational level of the pedestrian walking is described by the Generalized Centrifugal Force Model [9] which operates in continuous space. In this model pedestrians are described by ellipses. The semi-axes of the ellipses are velocity dependent, faster ellipses need more space in the moving direction. The fundamental diagram is reproduced by the model at corridors making it adequate for the analysis presented here. In this paper we focus on the strategic level only, i.e. the pedestrians are solely given the next destination point, which is the next intermediate destination for the self estimated optimal route. This is also the direction of the driven force. We simulate pedestrians that are familiar with the facility and pedestrians unfamiliar with the facility. For those two groups we identify criteria to reproduce their route choice. Those criteria are the local/global shortest path and the quickest path. The dynamic change of the strategies is modelled. This emulates the internal state of the pedestrians and the strategies are subject to change during the evacuation process. In addition one of the challenges consists of finding a good balance between the number of parameters and the numbers of criteria. The model should be as simple as possible with the parameter space kept as small as possible while considering as many criteria as required. This is important for model understanding and stability.
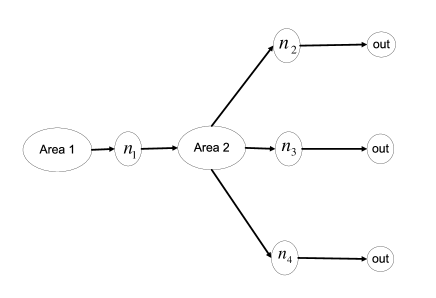
In the framework used here, pedestrians move from one decision area to the next one. The decision areas are connected with nodes, which will be interchangeable with destination points. A decision area is a place where the pedestrian decides which way to go or change their current destination. In this work a decision area is an abstraction for rooms and corridors, in addition we restrict ourselves to the case where the destination points are exits and corridors end. Fig. 1 illustrates this principle and is a mapping of the facility presented in Fig. 2. The pedestrians will be moving from the decision area 1 to the decision area 2. The two areas are connected with one node . The network is automatically generated from the facility based on the inter-visibility of the exits. The Euclidean distance between the nodes is used as weights.
2.1 Shortest Path
The most straight-forward routing approach is the local shortest path. Once a node in the network is reached, the local nearest node is chosen as next destination. The global shortest path is determined by running the Floyd Warshall algorithm with path reconstruction [21] on the built graph network. The runtime of is not an issue since we only have a small amount of nodes. From every node on the graph, the global shortest path to reach the outside can be determined. Pedestrians familiar with the facility have the global map i.e. the constructed network and may approximate the global shortest path to their final destination independently of their current location. They have a better analysis possibility of the current situation. Other pedestrians without any global information choose the local shortest path.
2.2 Quickest Path
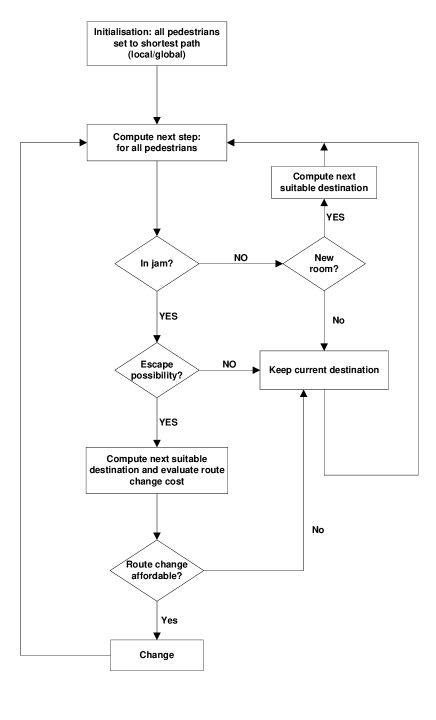
In contrast to the shortest path, the quickest path is dynamic and changes with time throughout the simulation. The business logic of the routing algorithm is shown in Fig. 3. The main events used in this routing algorithm to redirect pedestrians are the entering a new room and the identification of a jam situation. The pedestrians are first routed using the shortest path, global or local depending on theirs affiliations [32]. The key elements of a quickest path routing approach are the estimation of the travel time, the estimation of the gain and an assessment of this gain. Three functions are developped in this paper to model those key elements. We first define four values which will be used throughout this section.
Definition 2.1
Re-routing time
The re-routing time for a pedestrian with position is the time where one of the following conditions holds:
where is the threshold jam velocity, the patience time and the minimal distance to the node to consider it as reached.
Definition 2.2
Reference pedestrian
Let and be two pedestrians with positions and .
is a reference pedestrian to with respect to the node of the graph and is defined as:
, where is the jamming queue at the node . If more than one pedestrian satisfy the condition, one is randomly chosen.
Definition 2.3
Jamming queue
Let be a node in the navigation graph,
the jamming queue at the node is defined as
where is the threshold jam velocity.
Definition 2.4
Visibility range
represents the set of all nodes
within the visibility range of the pedestrian considering the actual location in the facility and other pedestrians.
It is determined using the Algorithm 1.
At any time (see Definition in 2.1) during the simulation, a new orientation process is started for the pedestrian . A reference pedestrian (see Definition 2.2) is selected from the queue (see Definition 2.3) and observed during an observation time . At the end of the observation, the expected travel time via all nodes in the visibility range (see Definition 2.4) is approximated using Eq. 1.
| (1) |
| (2) |
is the average velocity of the reference pedestrian over the observation time defined by Eq. 2. is randomly chosen between 1 and 3 seconds, the minimal distance is set to 0.20 and the minimal jam velocity is 0.2 . The estimated travel time is converted to a gain using Eq. 3.
| (3) |
The cost benefit analysis (cba) function defined in Eq. 4 determines whether it is worth changing the current destination. and are the gains calculated with Eq. 3. is always the current destination and the other evaluated alternatives. The benefit returned should be greater than a threshold () in order for the pedestrian to consider the change. The thresholds taken here are 0.20 for familiar and 0.15 for unfamiliar pedestrians.
| (4) |
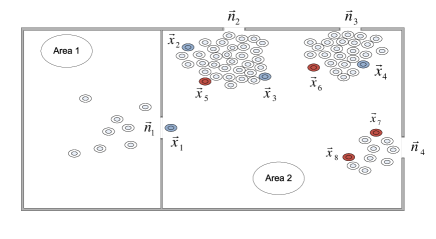
When a pedestrian is caught in a jam for a period (patience time) which varies depending on the pedestrian, he/she looks for alternatives in the decision area and in the sight range as described in Fig. 2. The initial value for is 10 seconds. It is increased by 1 second with any unsuccessful attempt to escape the jam. The value is kept until the room is changed. This amortizes the number of routes changes in the same room.
The process of selecting a reference pedestrian is explained in Fig. 2. The pedestrian has entered a new room. The pedestrians , and have identified a jam situation. Pedestrian selects the reference pedestrians , and for the exits , and respectively. The pedestrian has a restricted visibility and will have only as reference. There is no possibility for to change. The references selection is based on the Euclidean distance and visibility range. The visibility is implemented by drawing a line from the concerned pedestrian to the pedestrians in the queue, there should not be any intersections with other pedestrians or walls in the room. It is important to mention here, that the queue size does not play a major role, more important is the processing speed of the queue.
Input: Pedestrian
Output:
Unlike other algorithms, the approach presented here is not specialized to a particular case (asymmetric exits choice for instance), i.e. not bounded to the geometry. It is also not dependent on the initial distribution of the pedestrians.
3 Evacuation assessment
Usually evacuation processes are assessed with a visual proof and evacuation time within a feasible range. One less discussed question is the criticality of an evacuation process. The state of an evacuation can be critical for a certain group of the population, aged persons for example, but rather harmless for a different group. Also the same results can be interpreted differently depending on the surrounding conditions. In this section we address three criteria to assess an evacuation scenario.
3.1 Evacuation time
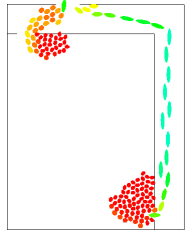
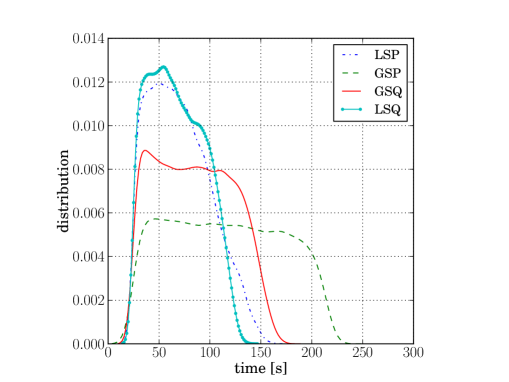
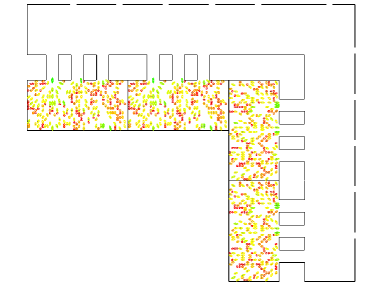
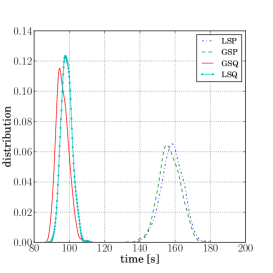
The evacuation time is given by the last person leaving the facility. Another definition can be a clearance of the building up to 95% of the occupants. We consider the former definition here. A visual assessment of the evacuation dynamics for a simple scenario after 60 seconds is given by Fig. 4. The colour of the pedestrians is correlated to their current velocity. Red means slow and represents congestions areas. Green corresponds to the maximum desired velocity of the pedestrians. The desired velocities are Gaussian distributed with mean and standard deviation . The evacuation times distribution is presented in Fig. 5a. The smallest variance is achieved by the GSP. This is quite normal as the GSP remains the same for all pedestrians independent of their initial positions. The largest variance is given by the LSP. The dynamics brought by the quickest path leads not only to a reduction of the overall evacuation time and a reduction of the width but also to realistic shapes in the simulation.
3.2 Jamming time
Up to now little importance has been brought to jam analysis itself i.e. how long pedestrian stay in jam. This is strongly coupled with the implemented routing strategy. The keyword jam is unfortunately not well defined in pedestrian dynamics. A rather crude definition would be to have an absolute zero velocity over a minimal time interval. The minimal time interval is needed to avoid very short velocity reduction at sharp turn for instance. We consider pedestrians moving at a speed lower than [33] for a period of at least 10 seconds as being in a jam situation. The total time in jam is recorded for each pedestrian and a distribution of the recorded times is calculated. The jamming time distribution for the simulation scenario given by Fig. 4 is presented in Fig. 5b. As expected the width of the distribution is smaller for the quickest path.
3.3 Jam size
The jam size and its evolution cannot directly be derived from the evacuation time and/or the individual times spent in jam.
It has to be analysed separately and for each exit individually. Short-lived jams are rather uncritical, the same holds for short-sized jams.
We are particularly interested in big jams with a long lifetime. They can be dangerous and should be
checked against the characteristics of the evacuees for instance their ages, but also against the environmental conditions,
the temperature for instance.
The jam size is calculated by summing up the effective areas occupied by the pedestrians in jam at each time step.
This is easily done by summing up the ellipses areas representing the pedestrians in the GCFM. Another method could be to build the envelope of the pedestrians
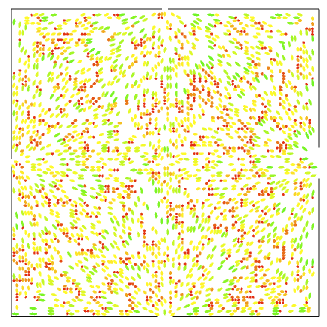
and calculate the area of the resulting polygon. Fig. 6a shows a
straight forward example of a jam size analysis scenario after the first time step (0.01 second). The colour corresponds to the states.
Red pedestrians are waiting for a possibility to move. Other pedestrians are already moving. The initial density is on average 1 .
The corresponding average jam areas are presented in Table 1. The values for the global and local shortest path are the same.
There as some difference in their corresponding combination with the quickest path.
At a first look the values for the different routing strategies do not differ much from each other, but one has to consider
the difference in the evacuation time, which is more than one minute in this case. There is a distribution of
the overall load from the congested exits to the non congested ones.
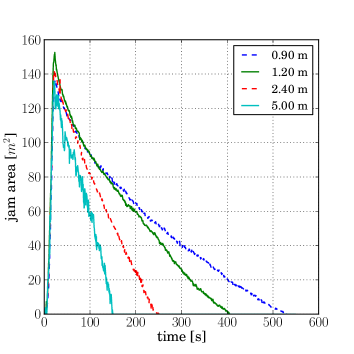
The jam size evolution at the different exits using the quickest path is shown in Fig. 6b.
There is a sharp increase at the beginning of the simulation. Peaks of approximately 150 are reached at all exits.
The values then decrease with a slope correlated with the routing strategy used. The slope is constant with the static strategies. The quickest path shows a less constant slope due to the fact that some pedestrians are changing their destinations.
| Door width | Jam area | |||
|---|---|---|---|---|
| LSP | GSP | GSQ | LSQ | |
| 0.90 | 53.7 | 53.7 | 48.8 | 49.3 |
| 1.20 | 52.8 | 52.8 | 48.2 | 42.5 |
| 2.40 | 27.4 | 27.4 | 31.3 | 28.1 |
| 5.00 | 13.2 | 13.2 | 20.3 | 18.1 |
4 Simulation and Analysis
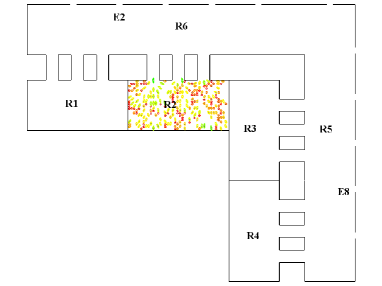
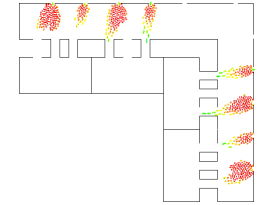
The strategies discussed in the previous section are tested on the structure described in Fig. 7 with different initial distributions. The simulation area is a simplified model of a section of the ESPRIT arena in Düsseldorf, Germany which holds up to 50.000 spectators. The room R1 to R4 are the grandstand with dimensions 10 x 20 . The tunnels are 2.40 wide and 5 long. The exits are 1.20 wide. The rooms R4 and R6 are 10 wide. The criteria used to evaluate the simulation results are presented in the previous section.
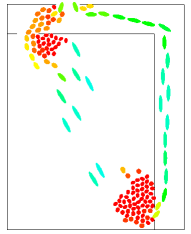
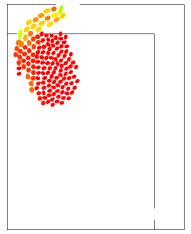
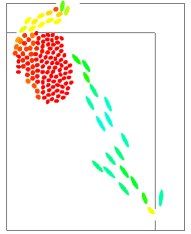
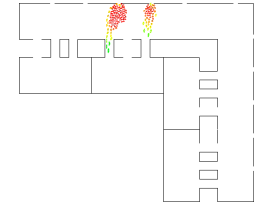
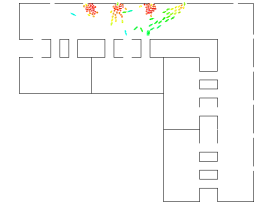
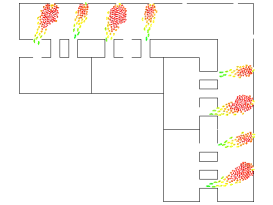
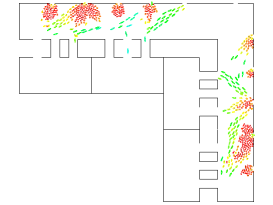
In the first simulation case we are interested in the evacuation of a single block of the stadium. Fig. 7a shows the initial homogeneous distribution of this test with 250 pedestrians. The dynamic of the evacuation after 60 seconds for the four strategies is presented in Fig. 8. With the shortest path only two exits are effectively used whereas the quickest path approach takes advantage of fours exits leading to a faster evacuation.
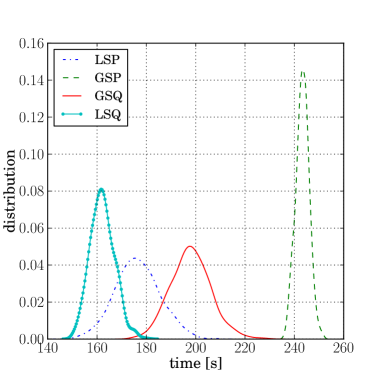
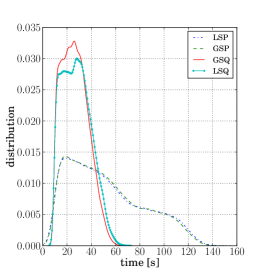
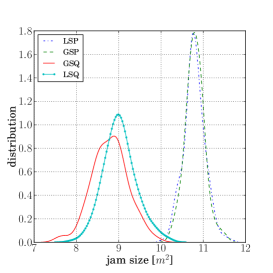
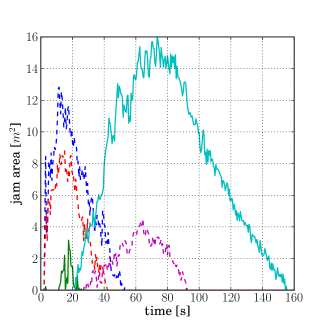
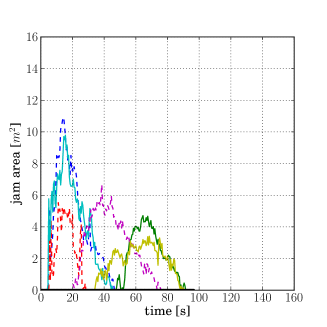
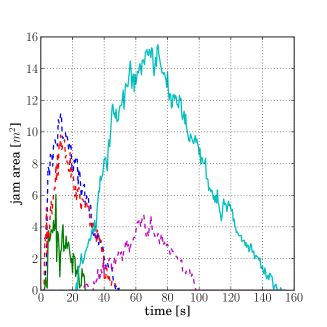
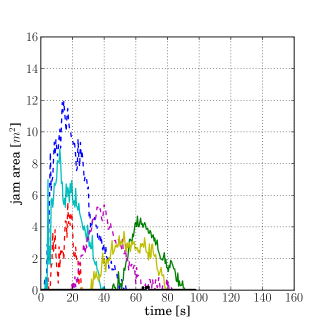
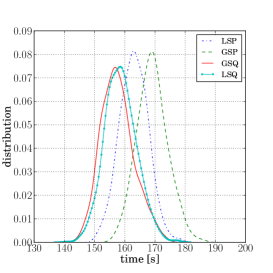
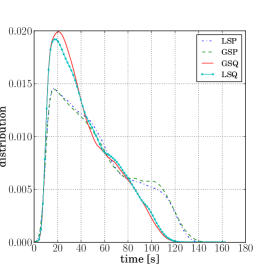
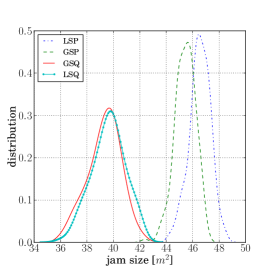
The results of the evacuation time analysis are summarized in Fig. 9a. 1000 runs are performed for the evaluation. The dynamic brought by the quickest path leads to a faster evacuation, on average 1 minute faster. As depicted in Fig. 8 other (less congested or free) exits are used, as will be expected in a real evacuation scenario. There is not much difference between the results given by the global and the local shortest path, this is due to the shape of the investigated facility. The second value analysed is the individual distributions of time spent in jam. The results are presented in Fig. 9b. As expected the results are correlated to the evacuation time. With the quickest path, pedestrians spend less time in jam, 30 seconds on average. This time is almost tripled using the static strategies. Fig. 10 shows the evolution of the jam size at different exits. Exits without congestions have been left out. The static strategies shows five long lasting jams. The quickest path alternatives shows more jams but short lived. The later ones are less critical. The total jam size distribution is taken from Fig. 9c. The average jam size for the static strategies is 11 and 9 for the quickest path.


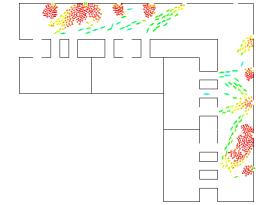
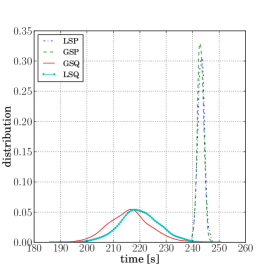
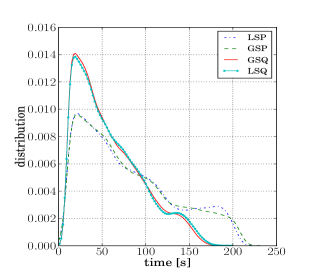
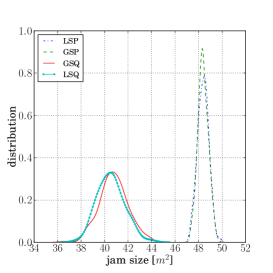
The second test consists of the simulation of the evacuation of the complete facility with 1000 pedestrians. The initial distribution is shown in Fig. 7b. A snapshot of the simulation after 60 seconds is shown in Fig. 11. The results of the jamming time and the evacuation time are summarized in Fig. 12a and Fig. 12b respectively. There is no much difference between the mean values of the distributions as in the previous case. This is due to the highly congested situation. There is no such ”quickest path” in this case and most of the pedestrians just have to follow the flow. Those results are confirmed by the time in jam distribution. The total jam size distribution is taken from Fig. 12c. The mean jam sizes are 46 for the static and 40 for the dynamic strategies.
In the third simulation scenario, the response of the system to a disturbance is simulated. The exits E2 and E8 (see Fig. 7a) are broken and cannot longer be used (see Fig. 7b). The results of evacuation time and time in jam are presented in Fig. 13a and Fig. 13b respectively. There is now a certain asymmetry in the escape route scheme and this is reproduced by the modelling approach. The quickest path lead to a faster evacuation and to less time in jam. This behaviour is also the expected one. The total jam size distribution is taken from Fig. 13c. All mean values are lower than the previous case without disturbance.
5 Summary
The approach presented in this paper offers the possibility to assess a given building structure considering the manifold of possible route choices. Four strategies have been presented in a combination of quickest and shortest path. The quickest path approach, which is based on an observation principle, is not sensitive to initial distribution of pedestrians or special topologies like symmetric exits, making it quite general. Furthermore it leads to a more realistic dynamics in the evacuation simulation. In addition criteria to assess the criticality of an evacuation simulation have been elaborated. We investigated the evacuation time distribution, the time in jam distribution and average jam size of pedestrians using a quickest and shortest path routing approaches in a graph-based way finding algorithm. The approaches have been tested on different scenarios with different complexities involving symmetric, asymmetric or even broken escape routes. Similarities between the distributions, their meanings and impacts on different evacuation scenarios have been quantitatively analysed.
Acknowledgements
This work has been performed within the program “Research for Civil Security” in the field “Protecting and Saving Human Life” funded by the German Government, Federal Ministry of Education and Research (BMBF). The project is granted under the Grant-Nr.: 13N9952.
References
- [1] E. R. Galea, S. Gwynne, P. Lawrence, L. Filippidis, D. Blackspields, D. Cooney, buildingEXODUS V 4.0 - User Guide and Technical Manual, www.fseg.gre.ac.uk (2004).
- [2] TraffGo HT GmbH, Handbuch PedGo 2, PedGo Editor 2, www.evacuation-simulation.com (2005).
- [3] I.S.T. Integrierte Sicherheits-Technik GmbH, Benutzerhandbuch Aseri, Version 4.6.
- [4] P. A. Thompson, E. W. Marchant, A Computer Model for the Evacuation of Large Building Populations, Fire Safety Journal 24 (1995) 131–148. doi:10.1016/0379-7112(95)00019-P.
- [5] A. Kirchner, H. Klüpfel, K. Nishinari, A. Schadschneider, M. Schreckenberg, Simulation of competitive egress behavior: Comparison with aircraft evacuation data, Physica A 324 (2003) 689–697. doi:10.1016/S0378-4371(03)00076-1.
- [6] V. J. Blue, J. L. Adler, Cellular automata microsimulation for modeling bidirectional pedestrian walkways, Transportation Research Part B 35 (2001) 293–312. doi:10.1016/S0191-2615(99)00052-1.
- [7] K. Nishinari, K. Sugawara, Kaza, Modelling of self-driven particles: Foraging ants and pedestrians, Physica A 372 (1) (2006) 132–141. doi:doi:10.1016/j.physa.2006.05.016.
-
[8]
D. Helbing, P. Molnár,
Social force model for
pedestrian dynamics, Phys. Rev. E 51 (1995) 4282–4286.
doi:10.1103/PhysRevE.51.4282.
URL http://link.aps.org/abstract/PRE/v51/p4282 -
[9]
M. Chraibi, A. Seyfried, A. Sachdschneider,
Generalized
centrifugal force model for pedestrian dynamics, Physical Review E 82
(2010) 046111.
doi:10.1103/PhysRevE.82.046111.
URL http://pre.aps.org/abstract/PRE/v82/i4/e046111 - [10] A. Schadschneider, W. Klingsch, H. Klüpfel, T. Kretz, C. Rogsch, A. Seyfried, Encyclopedia of Complexity and System Science, Vol. 5, Springer, Berlin, Heidelberg, 2009, Ch. Evacuation Dynamics: Empirical Results, Modeling and Applications, pp. 3142–3176.
- [11] R. Geraerts, M. H. Overmars, The corridor map method: A general framework for real-time high-quality path planning., Computer Animation and Virtual Worlds 18 (2007) 107–119.
- [12] J. Barraquand, L. Kavraki, J.-C. Latombe, T.-Y. Li, R. Motwani, P. Raghavan, A random sampling scheme for path planning, International Journal of Robotics Research 16 (1996) 759–774.
- [13] J. Dijkstra, H. Timmermans, Towards a multi-agent model for visualizing simulated user behavior to support the assessment of design performance, Automation in Construction 11 (2) (2002) 135–145. doi:doi:10.1016/S0926-5805(00)00093-5.
- [14] P. Molnár, Modellierung und Simulation der Dynamik von Fußgängerströmen, Dissertation, Universität Stuttgart (1995).
- [15] G. Løvås, Modelling and simulation of pedestrian traffic flow, Transpn. Res. B 28 (1998) 429–443.
-
[16]
M. de Berg, O. Cheong, M. van Kreveld, M. Overmars,
Computational Geometry: Algorithms and
Applications, 3rd Edition, Springer, 2008.
URL http://www.cs.uu.nl/geobook/ - [17] M. Asano, T. Iryo, M. Kuwahara, Microscopic pedestrian simulation model combined with a tactical model for route choice behaviour, Transportation Research Part C: Emerging TechnologiesArticle in Press, Corrected Proof.
- [18] M. Höcker, V. Berkhahn, A. Kneidl, A. Borrmann, W. Klein, Graph-based approaches for simulating pedestrian dynamics in building models, in: 8th European Conference on Product & Process Modelling (ECPPM), University College Cork, Cork, Ireland, 2010, http://zuse.ucc.ie/ECPPM/.
-
[19]
H. Alt, E. Welzl, Visibility graphs
and obstacle-avoiding shortest paths, Mathematical Methods of Operations
Research 32 (1988) 145–164, 10.1007/BF01928918.
URL http://dx.doi.org/10.1007/BF01928918 -
[20]
E. W. Dijkstra,
A
note on two problems in connexion with graphs., Numerische Mathematik 1
(1959) 269–271.
URL http://gdzdoc.sub.uni-goettingen.de/sub/digbib/loader?d%id=D196313 - [21] R. W. Floyd, Algorithm 97: shortest path, Communications of the ACM 5-6 (1962) 345.
- [22] A. Kirchner, A. Schadschneider, Simulation of evacuation processes using a bionics-inspired cellular automaton model for pedestrian dynamics, Physica A 312 (2002) 260–276. doi:10.1016/S0378-4371(02)00857-9.
- [23] E. S. Kirik, T. B. Yurgel’yan, D. V. Krouglov, The Shortest Time and/or the Shortest Path Strategies in a CA FF Pedestrian Dynamics Model, Journal of Siberian Federal University. Mathematics & Physics 2 (3) (2009) 271–278.
- [24] H. Zhao, Z. Gao, Reserve capacity and exit choosing in pedestrian evacuation dynamics, Journal of Pysics A: Mathematical and Theoretical 43.
- [25] T. Kretz, Pedestrian traffic: on the quickest path, Journal of Statistical Mechanics: Theory and Experiment P03012. doi:10.1088/1742-5468/2009/03/P03012.
- [26] D. Hartmann, Adaptive pedestrian dynamics based on geodesics, New Journal of Physics 12 (2010) 043032.
- [27] S. P. Hoogendoorn, P. Bovy, W. Daamen, Microscopic Pedestrian Wayfinding and Dynamics Modelling, in: M. Schreckenberg, S. Sharma (Eds.), Pedestrian and Evacuation Dynamics, 2002, pp. 123–155.
- [28] S. Russell, P. Norvig, Artificial Intelligence: A Modern Approach, 2nd Edition, Prentice-Hall, Englewood Cliffs, NJ, 2003.
- [29] G. Løvås, On the importance of building evacuation system components, IEEE Transact. on Eng. Man. 45 (1998) 181–191.
-
[30]
Z. Fang, Q. Li, Q. Li, L. D. Han, D. Wang,
A proposed pedestrian waiting-time model for
improving space-time use efficiency in stadium evacuation scenarios,
Building and Environment In Press, Accepted Manuscript (2011) –.
doi:DOI:10.1016/j.buildenv.2011.02.005.
URL http://www.sciencedirect.com/science/article/B6V23-526M%S05-1/2/a4fcec14fa891398b43d0f03c3a554e3 - [31] A. Seyfried, M. Chraibi, J. Mehlich, A. Schadschneider, Runtime optimization of force based models within the hermes project, in: Pedestrian and Evacuation Dynamics 2010, to appear in 2011.
- [32] A. U. Kemloh Wagoum, A. Seyfried, Optimizing the evacuation time of pedestrians in a graph-based navigation, in: M. Panda, U. Charraraj (Eds.), Developments in Road Transportation, Macmillian Publishers India Ltd, 2010, pp. 188–196.
- [33] A. Seyfried, A. Portz, A. Schadschneider, Phase coexistence in congested states of pedestrian dynamics, in: S. Bandini, S. Manzoni, H. Umeo, G. Vizzari (Eds.), Cellular Automata, Vol. 6350 of Lecture Notes in Computer Science, 9th International Conference on Cellular Automata for Reseach and Industry, ACRI 2010 Ascoli Piceno, Italy, September 2010, Springer-Verlag Berlin Heidelberg, 2010.