2 Dip. di Fisica, Univ. di Roma “Tor Vergata”, Via della Ricerca Scientifica 1, I-00133 Roma, Italy
3 INAF/IASF–Roma, Via Fosso del Cavaliere 100, I-00133 Roma, Italy
4 INAF, Oss. Astronomico di Torino, Via Osservatorio 20, I-10025 Pino Torinese (Torino), Italy
5 ENEA–Frascati, Via E. Fermi 45, I-00044 Frascati (Roma), Italy
6 NASA / Goddard Space Flight Center, Greenbelt, MD 20771, USA
7 INAF, Oss. Astronomico Brera, Via Bianchi 46, I-23807 Merate (LC), Italy
8 INAF/TNG Fundación Galileo Galilei, Rambia José Ana Fernández Pérez 7, 38712 Brena Baja, Tenerife Spain
9 INAF-Istituto di Radioastronomia, Via P. Gobetti 101, I-40129, Bologna, Italy
10 Scuola Normale Superiore, Piazza dei Cavalieri 7, I-56126 Pisa, Italy
11 INAF Osservatorio Astronomico di Trieste, Via G. Tiepolo 11, I-34143
12 Dip. di Fisica and INFN Trieste, Via Valerio 2, I-34127 Trieste, Italy
13 INFN–Pavia, Via Bassi 6, I-27100 Pavia, Italy
14 Dip. di Fisica Nucleare e Teorica, Univ. di Pavia, Via Bassi 6, I-27100 Pavia, Italy
15 INAF/IASF–Bologna, Via Gobetti 101, I-40129 Bologna, Italy
16 INAF/IASF–Milano, Via E. Bassini 15, I-20133 Milano, Italy
17 Dip. di Fisica Generale dell’Universitá, Via P. Giuria 1, I-10125 Torino, Italy
18 ENEA–Bologna, Via dei Martiri di Monte Sole 4, I-40129 Bologna, Italy
19 INFN–Roma “La Sapienza”, Piazzale A. Moro 2, I-00185 Roma, Italy
20 INFN–Roma “Tor Vergata”, Via della Ricerca Scientifica 1, I-00133 Roma, Italy
21 INAF–Oss. Astronomico di Cagliari, loc. Poggio dei Pini, strada 54, I-09012 Capoterra (CA), Italy
22 Dip. di Fisica, Univ. dell’Insubria, Via Valleggio 11, I-22100 Como, Italy
23 Institute for Astrophysical Research, Boston University, 725 Commonwealth Avenue, Boston, MA 02215, USA
24 Instituto de Astrofísica de Andalucía, CSIC, Apartado 3004, 18080 Granada, Spain
25 Department of Astronomy, University of Michigan, Ann Arbor, MI 48109, USA
26 Pulkovo Observatory, Russian Academy of Sciences, 196140, St.-Petersburg, Russia
27 MPIfR, D-53121 Bonn, Germany
28 Instituto de Astronomia, Universidad Nacional Autonoma de Mexico, Mexico, D. F. Mexico
29 Tuorla Observatory, Department of Physics and Astronomy, University of Turku, Väisäläntie 20, 21500 Piikkiö, Finland
30 Astron. Inst., St.-Petersburg State Univ., 198504 St.-Petersburg, Russia
31 INAF–Osservatorio Astrofisico di Catania, Via S. Sofia 78, I-95123 Catania, Italy
32 Institute of Astronomy, National Central University, Taiwan
33 Lulin Observatory, Institute of Astronomy, National Central University, Taiwan
34 INAF, Osservatorio Astronomico di Roma, Via di Frascati 33, I-00040, Monte Porzio Catone, Italy
35 INAF, Osservatorio Astronomico di Collurania, Via Mentore Maggini, I-64100 Teramo, Italy
36 Agrupació Astronòmica de Sabadell, Spain
37 Harvard-Smithsonian Center for Astrophysics, Cambridge, Garden st. 60, MA 02138, USA
38 School Of Cosmic Physics, Dublin Institute For Advanced Studies, Ireland
39 ZAH, Landessternwarte Heidelberg, Königstuhl, D-69117 Heidelberg, Germany
40 Instituto de Astronomia, Universidad Nacional Autonoma de Mexico, 2280 Ensenada, B.C. Mexico
41 Aalto University Metsähovi Radio Observatory, Metsähovintie 114, FIN-02540 Kymälä, Finland
42 Department of Physics, Purdue University, 525 Northwestern Ave., West Lafayette, IN 47907, USA
43 Abastumani Observatory, 383762 Abastumani, Georgia
44 Isaac Newton Institute of Chile, St.-Petersburg Branch
45 School Of Cosmic Physics, Dublin Institute For Advanced Studies, Ireland
46 Department of Physics and Astronomy, University of Southampton S017 1BJ, UK
47 Finnish Centre for Astronomy with ESO (FINCA), University of Turku, FI-21550 Piikkiö, Finland
48 ASI–ASDC, Via G. Galilei, I-00044 Frascati (Roma), Italy
49 ASI, Viale Liegi 26, I-00198 Roma, Italy
AGILE detection of extreme -ray activity from the blazar PKS 1510-089 during March 2009. Multifrequency analysis††thanks: The radio-to-optical data presented in this paper are stored in the GASP-WEBT archive; for questions regarding their availability, please contact the WEBT President Massimo Villata.
We report on the amazing -ray activity from the flat spectrum radio quasar (FSRQ) PKS 1510089 observed by the AGILE satellite in March 2009. In the same period a radio-to-optical monitoring of the source was provided by the GASP–WEBT and REM facilities. In the radio band we made use also of multi-epoch 15-GHz Very Long Baseline Array data from the MOJAVE Program to get information on the parsec-scale structure. Moreover, several Swift target of opportunity observations were triggered, adding important information on the source behaviour from optical/UV to hard X-rays. We paid particular attention to the calibration of the Swift/UVOT data to make it suitable to the blazars spectra. Simultaneous observations from radio to -rays allowed us to study in detail the correlation among the emission variability at different frequencies and to investigate the mechanisms at work during this high activity state of the source.
In the period 9–30 March 2009, AGILE detected -ray emission from PKS 1510089 at a significance level of 21.5- with an average flux over the entire period of photons cm-2 s-1 for photon energies above 100 MeV, and a peak level of photons cm-2 s-1 on daily integration. The activity detected in -rays occurred during a period of increasing activity from near-infrared to UV, as monitored by GASP–WEBT, REM and Swift/UVOT. A flaring episode on 26-27 March 2009 was detected from near-IR to UV, suggesting that a single mechanism is responsible for the flux enhancement observed at the end of March. By contrast, Swift/XRT observations seem to show no clear correlation of the X-ray fluxes with the optical and -ray ones. However, the X-ray observations show a harder photon index ( 1.3–1.6) with respect to most FSRQs and a hint of harder-when-brighter behaviour, indicating the possible presence of a second emission component at soft X-ray energies. Moreover, the broad band spectrum from radio-to-UV confirmed the evidence of thermal features in the optical/UV spectrum of PKS 1510089 also during high -ray state. On the other hand, during 25-26 March 2009 a flat spectrum in the optical/UV energy band was observed, suggesting an important contribution of the synchrotron emission in this part of the spectrum during the brightest -ray flare, therefore a significant shift of the synchrotron peak.
Key Words.:
gamma-rays: observations – mechanism: non-thermal – quasars: individual (PKS 1510089)1 Introduction
According to the current paradigm (see Urry Padovani 1995) Active Galactic Nuclei (AGNs) are galaxies whose emission is dominated by a bright central core, including a super massive black hole as central engine, surrounded by an accretion disk and by fast-moving clouds under the influence of the strong gravitational field, emitting Doppler broadened lines. Absorbing material in a flattened configuration, idealized as a dust torus, obscures the central parts so that for transverse line of sight only the more distant narrow-line emitting clouds are seen directly. In radio-loud objects we have the additional presence of a relativistic jet, roughly perpendicular to the disk. Within this scheme, blazars represent the fraction of AGNs with their jet at smaller angles with respect to our line of sight, which causes relativistic aberration and emission amplification (Blandford Rees 1978).
Blazars are the most enigmatic subclass of AGNs, characterized by the emission of strong non-thermal radiation across the entire electromagnetic spectrum, from radio to very high -ray energies. Because of their peculiar properties and amplified emission, blazars offer the unique possibility to probe the central region of AGNs, and shed light on the mechanism responsible for the extraction of energy from the central black hole and for the acceleration and collimation of relativistic electrons into jets. With the detection of several blazars in the -rays by EGRET (Hartman et al. 1999) the study of this class of objects has made significant progress but, despite the big efforts devoted to the investigation of the mechanisms responsible for the emission in blazars, the definitive answer is still missing. The new generation of high-energy space missions, the Astrorivelatore Gamma a Immagini LEggero (AGILE) and Fermi Gamma-ray Space Telescope (GST) satellites, have to address some of the fundamental issues that were left unresolved by EGRET.
PKS 1510089 is a nearby (z=0.361) blazar belonging to the class of the flat spectrum radio quasars (FSRQs) with radiative output dominated by the -ray emission, while the synchrotron emission peaks around IR frequencies, below a pronunced UV bump, likely due to the thermal emission from the accretion disk (Malkan Moore 1986; Pian Treves 1993; D’Ammando et al. 2009a).
Its radio emission exhibits very rapid, large amplitude variations in both total and polarized flux (Aller, Aller, Hughes 1996). Moreover, the radio jet shows superluminal motion with an apparent velocity higher than 20, among the fastest of all blazars observed thus far (Jorstad et al. 2005), with the parsec and kiloparsec scale jets apparently misaligned by 180 degrees (Homan et al. 2002, Wardle et al. 2005).
PKS 1510089 has been extensively observed in the X-rays during the last three decades, since the observations by the Einstein satellite in 1980s (Canizares White 1989). The X-ray spectrum as observed by ASCA in the 2–10 keV band was very hard with photon index of 1.3 (Singh, Shrader George 1997), but steepened ( 1.9) in the ROSAT bandpass (0.1–2.4 keV), suggesting the presence of a spectral break around 1–2 keV, associated with the existence of a soft X-ray excess (Siebert et al. 1998). Subsequent observations by BeppoSAX (Tavecchio et al. 2000) and Chandra (Gambill et al. 2003) confirmed the presence of a soft X-ray excess below 1 keV. Evidence of a similar soft X-ray excess has been detected in other blazars such as 3C 273, 3C 279, AO 0235+164, and 3C 454.3. The origin of this excess is still an open issue, not only for blazars but for all AGNs (see e.g. D’Ammando et al. 2008, and the references therein).
The interest in the peculiar X-ray spectrum of the source led up to a monitoring campaign organized during August 2006 by Suzaku and Swift. The Suzaku observations confirmed the presence of a soft X-ray excess, suggesting that it could be a feature of the bulk Comptonization, whereas the Swift/XRT observations revealed significant spectral evolution of the X-ray emission on timescales of a week: the X-ray spectrum becomes harder as the source gets brighter (Kataoka et al. 2008). Unfortunately no -ray satellites were operating at that time, therefore it was not possible to investigate the correlation between X-ray and -ray behaviour. However, -ray emission from PKS 1510089 had already been detected in the past by EGRET during low/intermediate states and was found to be only slightly variable, with an integrated flux above 100 MeV varying between (13 5) and (49 18) 10-8 photons cm-2 s-1 (Hartman et al. 1999).
Instead, in the last three years PKS 1510089 showed extreme variability over the whole electromagnetic spectrum and in particular very intense -ray activity was detected, intermittently, by the AGILE and Fermi satellites. The monitoring of the source between September 2008 and June 2009 with the Large Area Telescope (LAT) onboard Fermi is summarized in Abdo et al. (2010a). The Gamma-Ray Imaging Detector (GRID) onboard AGILE detected flaring episodes in August 2007 (Pucella et al. 2008) and March 2008 (D’Ammando et al. 2009a). Subsequently, an extraordinary -ray activity was detected in March 2009, with several flaring episodes and a flux that reached 700 10-8 photons cm-2 s-1. Preliminary results were presented in D’Ammando et al. (2009b), Pucella et al. (2009), Vercellone et al. (2009). Recently, Marscher et al. (2010) studying the flux behaviour at different frequencies, linear optical polarization, and parsec-scale structure of PKS 1510089 found a correspondence between the rotation of the optical polarization angle and the -ray activity during the first six months of 2009.
In this paper we discuss the results of the analysis of the multiwavelength data of PKS 1510089 collected by GLAST-AGILE Support Program (GASP) of the Whole Earth Blazar Telescope (WEBT), Rapid Eye Mount (REM), Swift and AGILE during March 2009 and their implications for the emission mechanisms at work in this source. The paper is organized as follows. Section 2 briefly introduces the multiwavelength coverage on PKS 1510089. In Sections 3 through 7 we present the analysis and results of AGILE, Swift, GASP-WEBT, REM, and Very Long Baseline Array (VLBA) data, respectively. In Section 8 we discuss the contribution of the thermal emission in the low-energy part of the spectrum and the correlation between the emission at different energy bands. Finally, in Section 9 we draw our conclusions.
Throughout this paper the quoted uncertainties are given at 1- level, unless otherwise stated, and the photon indices are parameterized as (ph cm-2 s-1 keV-1 or MeV-1 ) with ( being the spectral index).
2 The multiwavelength coverage
The high -ray activity observed by AGILE during March 2009 triggered 15 Swift ToO observations, starting from 11 March 2009, for a total of 46 ks. Moreover, the monitoring by GASP–WEBT in February–March 2009 provided important information from radio-to-optical band and, together with the data collected in near-IR and optical bands by REM during March 2009, allowed us to also obtain an excellent coverage in the low-energy part of the broad band spectrum of the source. Finally, high resolution radio VLBI data at 15 GHz were obtained by monitoring the source within the Monitoring of Jets in Active galactic nuclei with VLBA Experiment (MOJAVE) project.
A summary of the complete multiwavelength data set on PKS 1510089 presented in this paper can be found in Table 1.
| Waveband | Observatory | Frequency/Band |
| Radio | SMA | 230 GHz |
| Noto | 43 GHz | |
| Metsähovi | 37 GHz | |
| VLBA | 15, 43 GHz | |
| UMRAO | 8.0, 14.5 GHz | |
| Medicina | 5, 22 GHz | |
| Near-IR | REM | , , |
| Campo Imperatore | , , | |
| Roque (Liverpool) | ||
| Optical | Abastumani | |
| Calar Alto | ||
| Castelgrande | , , , | |
| L’Ampolla | ||
| La Silla (MPG/ESO) | , , , | |
| Lulin (SLT) | ||
| Roque (KVA and Liverpool) | ||
| San Pedro Martir | ||
| St. Petersburg | , , , | |
| Valle d’Aosta | ||
| REM | , , | |
| Swift/UVOT | , , | |
| UV | Swift/UVOT | , , |
| X-ray | Swift/XRT | 0.3–10 keV |
| Swift/BAT | 15–50 keV | |
| Gamma-ray | AGILE GRID | 100 MeV – 30 GeV |
3 AGILE observations: data analysis and results
The AGILE scientific instrument (Tavani et al. 2009) is very compact and combines four detectors that provide broad band coverage from hard X-rays to -rays: a Silicon Tracker (ST) optimized for -ray imaging in the 30 MeV – 30 GeV energy range (Prest et al. 2003; Barbiellini et al. 2001); a co-aligned coded-mask X-ray imager sensitive in the 18–60 keV energy range (SuperAGILE; Feroci et al. 2007); a non-imaging CsI(Tl) Mini-Calorimiter sensitive in the 0.3–100 MeV energy range (MCAL; Labanti et al. 2009); and a segmented anticoincidence system (ACS; Perotti et al. 2006). The combination of ST, MCAL and ACS forms the GRID that assures the -ray detection.
The AGILE satellite observed PKS 1510089 between 1 March 2009 00:01 UT and 31 March 2009 11:41 UT (JD 2454891.5-2454921.0), for a total of 325 hours of effective exposure time, during which the source moved from to off the AGILE pointing direction.
AGILE-GRID data were analyzed, starting from the Level–1 data, using the AGILE Standard Analysis Pipeline and the AGILE Scientific Analysis Package. Counts, exposure, and Galactic background -ray maps, the latter based on the diffuse emission model developed for AGILE (Giuliani et al. 2004), were generated with a bin size of for photons with energies E 100 MeV. We selected only the events flagged as confirmed -ray events, and not collected during the South Atlantic Anomaly or whose reconstructed directions form angles with the satellite-Earth vector smaller than 80∘, in order to reduce the -ray Earth albedo contamination.
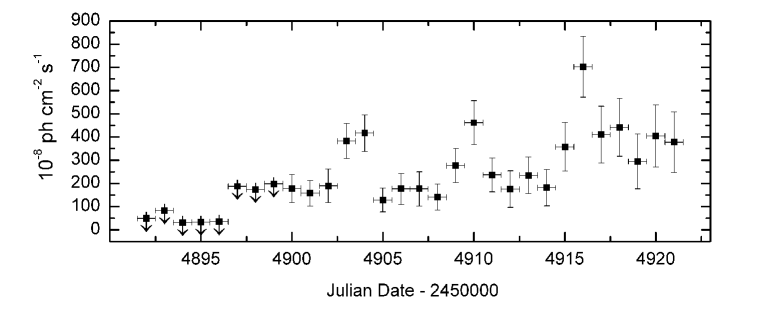
PKS 1510089 was detected over the period 1–30 March 2009 at a significance level of 19.9-, with an average -ray flux of = (162 12) 10-8 photons cm-2 s-1. Figure 1 shows the -ray light curve of March 2009 with 1-day resolution for photons with energy higher than 100 MeV. The average -ray flux as well as the daily values were derived by the maximum likelihood analysis, according to the procedure described in Mattox et al. (1993): first, the entire period was analyzed to determine the diffuse emission parameters, then the source flux density was estimated independently for each of the 1-day periods with the diffuse parameters fixed at the value obtained in the first step. At the beginning of the observation period the source was not so active in -rays as later. AGILE-GRID does not detect PKS 1510089 at a significance level higher than 3- between 1 and 8 March 2009 and only upper limits at 95 confidence level are obtained111When the significance level of the detection obtained by the maximum likelihood analysis is 3- an upper limit at 95 confidence level is calculated (see Mattox et al. 1996).. Instead, in the period 9–30 March 2009 (JD 2454899.5–2454921.5) different flaring episodes were detected and considering only this time interval the significance of detection slightly increases to 21.5-, with an average flux of (311 21) 10-8 photons cm-2 s-1.
In the period 9–30 March 2009 the AGILE 95 maximum likelihood contour level barycenter of the source is l = 351.278∘ b = 40.058∘, with a distance between the -ray position and the radio position (l = 351.289∘, b = 40.139∘) of 0.08∘ and an overall AGILE error circle of radius r = 0.15∘.
The -ray light curve shows a complex structure with outbursts having a duration of 4–5 days and approximately symmetrical profile that could be an indication that the relevant timescale is the light crossing time of the emitting region. The peak level of activity with daily integration was = (702 131) 10-8 photons cm-2 s-1 on 25 March 2009 (JD 2454916.0)222Integrating between 0:00 UT and 23:59 UT for each day.. This is the highest -ray flux observed from this source on daily timescale and one of the highest fluxes detected from a blazar. We note that the increasing of the error on the flux estimation throughout the whole observation period is related to the fact that with the increase of the off-axis angle between the center of the field of view of the GRID and the position of the source, the possible background contamination and the GRID calibration uncertainties become slightly higher. Despite the different energy range and Tstart of the daily light curves, the AGILE results are in agreement with the Fermi-LAT results presented in Abdo et al. (2010a).
Unfortunately, the source was located substantially off-axis in the SuperAGILE field of view during the whole observation period, thus preventing us to extract a constraining upper limit in the 18–60 keV energy band with SuperAGILE.
The -ray spectrum during the first period of high activity detected by AGILE (9–16 March 2009; JD 2454899.5–2454907.5) can be fitted with a power law of photon index = 1.95 0.15. The photon index is calculated with the weighted least squares method by considering four energy bins: 100–200 MeV, 200–400 MeV, 400 MeV–1 GeV, and 1–3 GeV. A similar value of the photon index ( = 1.96 0.24) is estimated also in the period of the highest activity (23–27 March 2009; JD 2454913.5–2454918.5). Considering that during this second period the source was far off-axis with respect to the center of the GRID field of view, the energy bin 1–3 GeV is not considered in order to reduce the possible background contamination for high off-axis angles at these energies. Comparing with the average photon index measured by EGRET ( = 2.47 0.21, Hartman et al. 1999) and that measured by Fermi-LAT over the first eleven months of observations ( = 2.41 0.01; Abdo et al. 2010b), the values observed by AGILE confirm a hardening of the -ray spectrum during the very high activity detected in March 2009. A similar hard -ray spectrum of PKS 1510089 was observed by AGILE during the flaring episode of March 2008 (D’Ammando et al. 2009a).
The correlation between the flux level and the spectral slope in the -ray energy band was extensively studied by means of the analysis of all the EGRET data, but a firm result for the blazars is not found (Nandikotkur et al. 2007). A ‘harder-when-brighter’ behaviour in rays of PKS 1510089 was detected by Fermi-LAT over a long timescale (August 2008–June 2009) considering only flux levels of F (E 200 MeV) 2.4 10-7 photons cm-2 s-1 (Abdo et al. 2010a). A similar trend was observed in the EGRET era only for 3C 279 (Hartman et al. 2001) and marginally for PKS 0528134 (Mukherjee et al. 1996), but this could be due to the fact that these were the only objects for which a long-term monitoring in -rays was performed by EGRET. At present, with AGILE and Fermi we are able to follow a large number of blazars on very long timescales and investigate this behaviour on a larger sample of objects. In this context, considering the long period of high activity recently observed in -rays, PKS 1510089 is one of the best test cases, together with 3C 454.3 (see e.g. Vercellone et al. 2010).
4 Swift observations: data analysis and results
The Swift satellite (Gehrels et al. 2004) performed 15 ToOs on PKS 1510089 between 11 and 30 March 2009, triggered by the high -ray activity of the source. The observations were performed with all the three onboard instruments: the X-ray Telescope (XRT; Burrows et al. 2005, 0.2–10.0 keV), the UltraViolet Optical Telescope (UVOT; Roming et al. 2005, 170-600 nm), and the Burst Alert Telescope (BAT; Barthelmy et al. 2005, 15–150 keV).
4.1 Swift/BAT data
As part of its normal operations, BAT collects data over a wide area of the sky in its survey mode. The survey data in the 15–50 keV band is used to produce sky images in which hard X-ray sources can be detected using the standard Swift analysis software, following the procedures described in Krimm et al. (2008, and the reference therein; see also333http://swift.gsfc.nasa.gov/docs/swift/results/transients.).
During March 2009, we detected two short flaring episodes from PKS 1510089. The first covered approximately 2 days beginning on 8 March 2009 (JD 2454899.0), with an average count rate of (0.006 0.002) counts s-1 cm-2 (15–50 keV), which corresponds to 28 mCrab and peaking on 9 March 2009 at 40 mCrab (Krimm et al. 2009). A second weaker episode occurred on 29 March 2009 (JD 2454920.0), where the average count rate was (0.003 0.001) counts s-1 cm-2, corresponding to 15 mCrab.
As a comparison we report that during the period before the March 2008 -ray flare detected by AGILE (D’Ammando et al. 2009a), Swift/BAT recorded flaring episodes from PKS 1510089 on 16 February 2008 (JD 2454513.0), 21 February 2008 (JD 2454518.0) and 24 February 2008 (JD 2454521.0), with count rates of approximately (0.005 0.002) counts s-1 cm-2 on each of those observations.
4.2 Swift/XRT data
The XRT data were processed with standard procedures (xrtpipeline v0.12.4), filtering, and screening criteria by using the Heasoft package (v.6.8). The source count rate was low during the whole campaign (count rate counts s-1), so we only considered photon counting (PC) data and further selected XRT event grades 0–12. Pile-up correction was not required. Source events were extracted from a circular region with a radius between 15 and 20 pixels (1 pixel ), depending on the source count rate, while background events were extracted from a circular region with radius 40 pixels away from background sources. Ancillary response files were generated with xrtmkarf, and account for different extraction regions, vignetting and PSF corrections. We used the spectral redistribution matrices v011 in the Calibration Database maintained by HEASARC. Considering the very low number of photons collected on 26 and 27 March we summed the data of these two consecutive days in order to have enough statistics to obtain a good spectral fit.
All spectra were rebinned with a minimum of 20 counts per energy bin to allow fitting within XSPEC (v12.5.1; Arnaud 1996). We fit the individual spectra with a simple absorbed power law, with a neutral hydrogen column fixed to its Galactic value ( cm-2; Kalberla et al. 2005). The fit results are reported in Table 2. The comparison between our results and those presented by Abdo et al. (2010a) reveals some differences, which we ascribe to their using a lower number of counts per bin than generally adopted to allow fitting ( 20 counts/bin). Indeed, these differences increase when the number of counts decreases.
| Start Time | Stop Time | Exp. Time | Photon Index | Flux 0.3–10.0 keVa | (d.o.f.) |
|---|---|---|---|---|---|
| (yyyy-mm-dd hh:mm:ss) | (yyyy-mm-dd hh:mm:ss) | (sec) | ( 10-12 erg cm-2 s-1 ) | ||
| 2009-03-11 15:07:49 | 2009-03-11 23:25:56 | 4891 | 0.919 (35) | ||
| 2009-03-12 15:13:44 | 2009-03-12 20:29:50 | 4842 | 0.867 (38) | ||
| 2009-03-17 04:29:17 | 2009-03-17 11:07:56 | 4869 | 1.041 (31) | ||
| 2009-03-18 00:02:10 | 2009-03-18 08:03:56 | 4777 | 1.009 (27) | ||
| 2009-03-19 19:14:17 | 2009-03-19 22:39:56 | 2501 | 1.074 (15) | ||
| 2009-03-20 22:34:29 | 2009-03-21 02:00:58 | 2010 | 0.884 (11) | ||
| 2009-03-22 01:30:19 | 2009-03-22 06:38:57 | 2242 | 0.843 (12) | ||
| 2009-03-22 03:05:15 | 2009-03-22 03:48:27 | 2580 | 0.913 (13) | ||
| 2009-03-23 11:25:24 | 2009-03-23 16:32:57 | 2640 | 0.705 (15) | ||
| 2009-03-24 03:27:22 | 2009-03-24 22:57:57 | 1972 | 0.768 (10) | ||
| 2009-03-25 13:23:14 | 2009-03-25 22:58:57 | 2447 | 1.102 (15) | ||
| 2009-03-26 16:27:40 | 2009-03-27 08:43:56 | 5003 | 0.871 (22) | ||
| 2009-03-28 05:18:45 | 2009-03-28 08:48:58 | 2657 | 0.997 (17) | ||
| 2009-03-30 10:18:41 | 2009-03-30 12:12:57 | 2544 | 1.230 (16) |
During the 15 ToOs performed in March 2009, Swift/XRT observed the source with a 0.3–10.0 keV flux in the range (0.8 – 1.1) 10-11 erg cm-2 s-1, a somewhat fainter state with respect to the high flux level observed in August 2006 (Flux = (1.1 – 1.8) 10-11 erg cm-2 s-1). Instead, a hint of spectral trend seems to be present in the X-ray data. Figure 2 shows the XRT photon indexes as a function of the X-ray fluxes in the 0.3–10 keV: a possible hardening of the spectrum with the increase of the flux is observed, in spite of the large errors. A similar harder-when-brighter behaviour in X-rays was observed for PKS 1510089 in August 2006 (Kataoka et al. 2008), March 2008 (D’Ammando et al. 2009a), and over the period January–June 2009 (Abdo et al. 2010a).
The significant spectral evolution observed by XRT, with the photon index changing from 1.3 to 1.6, is not usual for FSRQs, for which only little X-ray variability is detected both on short and long timescales. Moreover, the average X-ray photon index observed over March 2009 for this object ( = 1.48 0.03) is lower than that of the radio-loud quasars ( = 1.66 0.07; Lawson et al. 1992, Cappi et al. 1997) and is more similar to that of the high-redshift (z 2) quasars (e.g. Page et al. 2005). Since usually in FSRQs the X-ray energy range samples the low-energy tail of the external Compton (EC) component, as already discussed in Kataoka et al. (2008) and Abdo et al. (2010a), such hard spectral indexes in X-rays should imply a very flat energy distribution, challenging the standard shock models of particle acceleration. In a standard shock model these hard X-ray spectra produce relativistic electrons with an energy spectrum harder than the canonical power law distribution N() -2, or alternatively, as discussed in Sikora et al. (2002), another mechanism (e.g. instabilities driven by shock-reflected ions, Hoshino et al. 2002; or magnetic reconnection, Romanova Lovelace 1992) should energize the low energies electrons that typically produce the X-ray emission in the EC model.

4.3 Swift/UVOT data
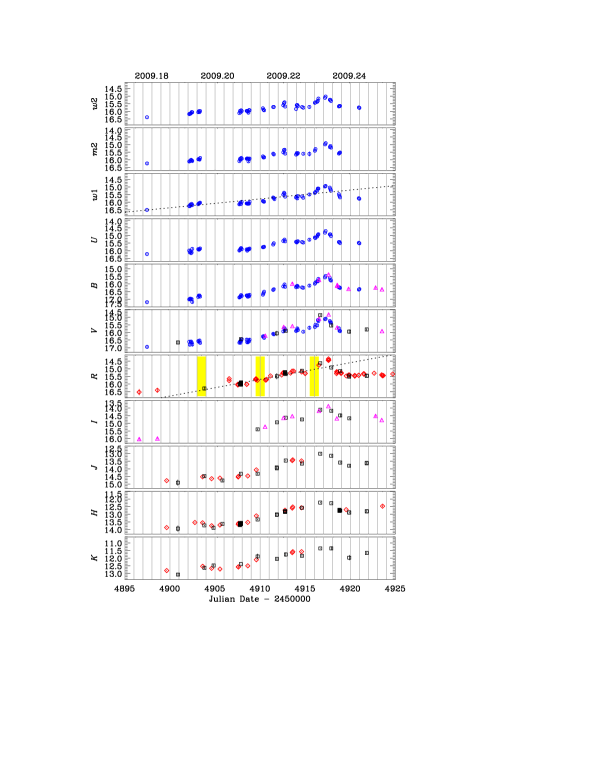
UVOT observed PKS 1510089 in all its optical (, , and ) and UV (, , and ) photometric bands. Data were reduced with the uvotmaghist task of the HEASOFT package. Source counts were extracted from a circular region of 5 arcsec radius, centred on the source, while the background was estimated from a surrounding annulus with 8 and 18 arcsec radii. In Fig. 3 UVOT magnitudes are displayed with blue circles.
5 GASP observations in radio, near-IR and optical bands: data analysis and results
The GLAST-AGILE Support Program (Villata et al. 2008, 2009a) is a project born from the Whole Earth Blazar Telescope444http://www.oato.inaf.it/blazars/webt. in 2007. It is aimed at providing long-term monitoring in the optical (-band), near-IR, and radio bands of 28 -ray-loud blazars during the lifetime of the two -ray satellites.
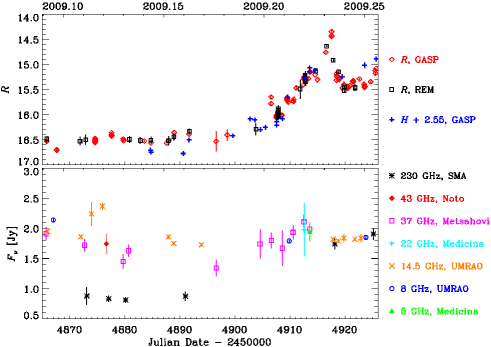
The -band GASP observations of PKS 1510089 in the period considered in this paper were performed by the following observatories: Abastumani, Calar Alto555Calar Alto data were acquired as part of the MAPCAT project http://www.iaa.es/ iagudo/research/MAPCAT., Castelgrande, L’Ampolla, La Silla (MPG/ESO), Lulin (SLT), Roque de los Muchachos (KVA and Liverpool), San Pedro Martir, St. Petersburg, and Valle d’Aosta. These data were calibrated with respect to stars 2–6 by Raiteri et al. (1998). The GASP observation in -band showed that after a low intensity period in February 2009, with the source observed constantly at 16.5 mag, the optical activity of the source greatly increased in March 2009 (Villata et al. 2009b) with an intense flare on 27 March (JD 2454917.6), after a brightening by almost 1 mag in 3 days, reaching = 14.35 0.03 mag (Larionov et al. 2009; see Fig. 3 and Fig. 4). Near-IR data in , and bands are from Campo Imperatore and Roque de los Muchachos (Liverpool), whereas WEBT data in , , and bands were taken at Castelgrande, La Silla and St. Petersburg. Data collected by GASP and WEBT observatories during March 2009 are reported in Fig. 3 with red diamonds and magenta triangles, respectively.
Radio fluxes were measured at: Submillimeter Array666These data were obtained as part of the normal monitoring program initiated by the SMA (see Gurwell et al. 2007). (SMA, 230 GHz), Medicina (22 and 5 GHz), Metsähovi (37 GHz), Noto (43 GHz), and UMRAO (14.5 and 8.0 GHz). The radio data are shown in Fig. 4, together with the optical (-band) and near-IR (-band) light curve of PKS 1510089 in February–March 2009.
We point out that in those cases where different datasets were present in the same band, we performed a careful data analysis to determine possible offsets and corrected for them to get homogeneous light curves, as usually done for GASP–WEBT data (see e.g. Villata et al. 2002, Raiteri et al. 2005).
6 REM observations: data analysis and results
During March 2009 photometric near-IR and optical observations were carried out with REM (Zerbi et al. 2004), a robotic telescope located at the ESO Cerro La Silla observatory (Chile). The REM telescope has a Ritchey-Chretien configuration with a 60 cm f/2.2 primary and an overall f/8 focal ratio in a fast moving alt-azimuth mount providing two stable Nasmyth focal stations. At one of the two foci, the telescope simultaneously feeds, by means of a dichroic, two cameras: REMIR for the near-IR (Conconi et al. 2004) and ROSS (Tosti et al. 2004) for the optical. Both cameras have a field of view of 10 10 arcmin and imaging capabilities with the usual near-IR (z, , , and ) and Johnson-Cousins filters. The REM software system (Covino et al. 2004) is able to manage complex observational strategies in a fully autonomous way. All raw near-IR/optical frames obtained with the REM telescope were then corrected for dark, bias, and flat field following standard recipes. Instrumental magnitudes were obtained via aperture photometry and absolute calibration has been performed by means of secondary standard stars in the field (see Raiteri et al. 1998; Smith and Balonek 1998). The data presented here were obtained by GO program for AOT19 (PI: F. D’Ammando). REM data in , , , , , and bands are reported in Fig. 3 with black squares.
7 VLBA observations: data analysis and results
When observed with the high spatial resolution provided by the Very Long
Baseline Interferometer (VLBI) technique, PKS 1510089 shows a radio
structure dominated by the core region from which the pc-scale jet emerges
forming an angle of 28∘, i.e. in the north-west
direction. Monitoring campaigns pointed out the ejection of new superluminal components, and followed their evolution throughout several observing epochs
(see Marscher et al. 2010).
As part of the MOJAVE program (Lister et al. 2009), PKS 1510089 is
frequently observed with the VLBA at 15 GHz (see Fig. 5). To study
variations in the source structure, we retrived the uv-datasets and we
imported them into NRAO AIPS package. Final images both in total intensity and
polarization have been produced after a few phase-only self-calibration
iterations (for more details on calibration and image analysis see Orienti et
al. 2010). From the analysis of the multi-epoch observations obtained between
2007 and 2010 it was possible to follow the separation between the core
region, considered stationary, and three emitted knots. From linear regression
fits we obtain highly superluminal apparent separation velocities between
16 and 20, consistent with the separation speed derived for other knots
(e.g. Homan et al. 2002), and at different frequency (Marscher et al. 2010),
indicating an intrinsic separation velocity and an orientation with the line of sight .
From the pc-scale resolution images we could separate the core flux density
from the jet emission, in order to study the lightcurve and polarization
properties of each of them. Between 2007 and 2010, three main episodes of
enhanced radio luminosity have been detected, successively followed by marked
flux density decreases. By contrast, no obvious trend of the polarization
percentage has been found.
After March 2009, the flux density of the core region, that was in a minimum,
started to increase, while the flux density of the jet component did not show
any significant luminosity changes. A remarkable aspect observed just after
the March 2009 flare is the abrupt change of about 75∘ in the
polarization angle of the core, whereas the fractional polarization remains
constant. More details on the long-term radio monitoring of this source are presented in Orienti et al. (2010).

8 Discussion
8.1 Thermal signatures in the radio-to-UV spectrum
Evidence of thermal emission in blazars has been detected in a limited number of objects until now, and usually observed during low activity states (e.g. 3C 279, Pian et al. 1999; 3C 273, Grandi Palumbo 2004; 3C 454.3, Raiteri et al. 2007; AO 0235164, Raiteri et al. 2008; NRAO 150, Acosta-Pulido et al. 2010). This is because, contrary to the other AGNs, in blazars the jet emission at small angles with respect to the line of sight of the observer is strongly amplified due to the relativistic beaming effect, overwhelming all the thermal contributions. However, these thermal features are less prominent in blazars but not absent, at least for FSRQs, which present a radiatively efficient accretion disk and broad emission lines.
The knowledge of these thermal features could have important consequences not only for the low-energy part of the spectrum, in which the thermal emission could be directly observed, but also for the high-energy part of the spectrum, because the photons produced by the accretion disk, directly or through the reprocessing by the broad line region (BLR) or the dusty torus, can become the main source of seed photons for the EC mechanism that usually dominates the -ray emission of FSRQs (Ghisellini et al. 1998).
In this context PKS 1510089 seems to be peculiar. Since the synchrotron peak of this source is usually observed in mid-infrared band (see Bach et al. 2007; Nieppola et al. 2008), the optical/UV part of the spectrum is not dominated by the non-thermal jet emission, allowing us to observe directly the thermal manifestation of both the accretion disk (the so-called “big blue bump”, e.g. Laor 1990) and of the BLR (the so-called “little blue bump”, e.g. Wills et al. 1985) also during high activity states, like in mid-March 2008 (see D’Ammando et al. 2009a). Moreover, an excess at far-IR wavelengths was observed in PKS 1510089 by IRAS (Tanner et al. 1996), likely due to dust radiation from the torus. Recently, Spitzer observations of PKS 1510089 produced only an upper limit of 2 1045 erg s-1 to the thermal emission from dust torus (Malmrose et al. 2011).
In order to distinguish between non-thermal and thermal emission contributions, we built spectral energy distributions (SEDs) from radio to UV with GASP-WEBT, REM and Swift/UVOT data. Conversion of magnitudes into de-reddened flux densities was obtained by adopting the Galactic absorption value = 0.416 from Schlegel et al. (1998), the extinction laws by Cardelli et al. (1989) and the magnitude-flux calibrations by Bessell et al. (1998).
As for the Swift/UVOT data, we noticed that PKS 1510089 has a b-v 0.3 that is out of the validity range indicated by Poole et al. (2008) for their flux calibrations in the UV bands. Hence, following Raiteri et al. (2010, 2011) we calculated effective wavelengths , count rate to flux density conversion factors , and amount of Galactic extinction for each UVOT band, by folding the quantities of interest with the source spectrum and effective areas of UVOT filters. The results are shown in Table 3.
| Filter | |||
|---|---|---|---|
| Å | mag | ||
| 5422 | 2.61 | 0.33 | |
| 4346 | 1.47 | 0.43 | |
| 3466 | 1.65 | 0.52 | |
| 2633 | 4.21 | 0.73 | |
| 2251 | 8.45 | 0.90 | |
| 2059 | 6.31 | 0.86 |
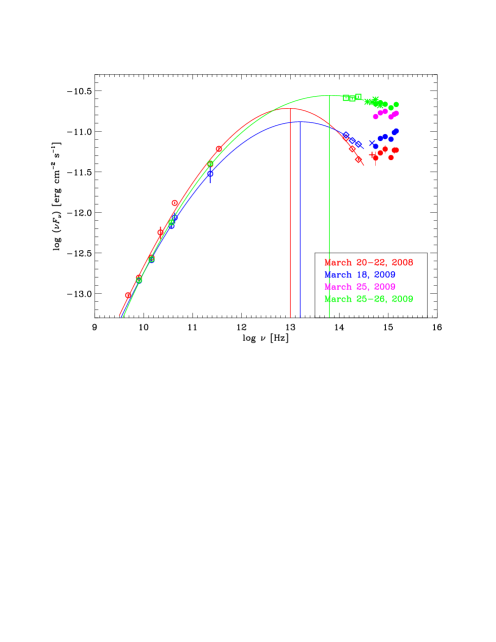
UVOT count rates were thus converted into flux densities and then corrected for Galactic extinction adopting the and reported in Table 3. In Figure 6 we display three SEDs of March 2009 as well as the March 2008 SED already published by D’Ammando et al. (2009a). The comparison between the March 2008 SED obtained with standard calibrations (Figure 3 of D’Ammando et al. 2009a) and the same SED obtained by applying the procedure described above reveals that the dip in the band remains, though it is now less pronounced. This means that it is not due to calibration problems, but likely reflects a true intrinsic feature. Indeed, we expect the little blue bump due to BLR emission (MgII, FeII, and Balmer lines) to peak in the – frequency range. Near-IR to UV spectra of PKS 1510089 in March 2009 have also been presented by Abdo et al. (2010a), but for a different choice of epochs, which prevents a detailed comparison with our results. However, as expected, we notice a deeper dip than that we obtained with our more accurate calibrations.
In other FSRQs, such as 3C 454.3, the presence of the little and big blue bumps was detected only during low activity state of the source (see Raiteri et al. 2008, Vercellone et al. 2010). Instead, the SED of PKS 1510089 collected on 18 March 2009 confirmed the evidence of thermal signatures in the optical/UV spectrum of the source also during high -ray states, with a contribution in the optical part likely due to the little blue bump and a significant rise of the spectrum at UV due to the accretion disk emission, as already observed on 20–22 March 2008. On the other hand, the broad band spectrum of PKS 1510089 from radio-to-UV during 25–26 March 2009 shows a flat spectrum in the optical/UV energy band, suggesting an important contribution of the synchrotron emission in this part of the spectrum during the brightest -ray flaring episode and therefore a significant shift of the synchrotron peak, usually observed in this source in the infrared band. We derived an estimate of the frequency of the synchrotron peak in the three SEDs applying a cubic polynomial fit (see e.g. Kubo et al. 1998) to the radio and IR data, which are likely due to pure synchrotron, as shown in Fig. 6. The synchrotron peak shifted from = 1.5 1013 Hz to = 6.5 1013 Hz between 18 and 26 March 2009. Similarly to the harder-when-brighter behaviour observed in X-rays, this is a typical behaviour of high-frequency-peaked BL Lacs (HBLs) and not so commonly observed in FSRQs such as PKS 1510089, even if this could be partially due to the fact that it is more difficult to obtain a long term monitoring of the synchrotron peak of FSRQs in the IR band with respect to the optical/UV and X-ray band.
Abdo et al. (2010a) analyzing the UVOT data of PKS 1510089 with standard calibrations (and thus with possible biases in the results, see above) found an anticorrelation between UV flux and UV hardness ratio in the period January-June 2009, suggesting a different level of contamination in UV by the high-energy branch of synchrotron emission depending on the activity level. This is in agreement with our results, even if the importance of the increase of the synchrotron emission observed at the end of March 2009 seems to be much higher with respect to the general trend.
The UVOT data reported in the SED of 25–26 March 2009 are collected at JD = 2454916.46, instead the BVRI data are collected by St. Petersburg at JD = 2454916.51-53, thus the separation in time between UVOT and BVRI data is about 1 hour. This rules out the possible bias related to the optical/UV variability of the object, confirming the flat optical/UV spectrum. The NIR data for the same SED are collected by REM at JD = 2454916.66, about 3.5 hrs after the optical data and 4.5 hrs after the UVOT data. In this case it is not possible to completely rule out a mismatch due to the possible rapid optical/UV variability, but by comparison with the NIR data collected during 20-22 March 2008 and 18 March 2009, it is evident the change of the NIR spectrum, in agreement with what we observed also in optical/UV. Moreover the comparison between the optical/UV data collected by UVOT on 25 March 2009, during the first UVOT exposure (, orange squares in Fig. 6) and those taken about 9–10 hours after (, green triangles), reveals a noticeable spectral and flux variation. Considering that the accretion disk is slowly variable on such short timescales, this is another proof of the fact that the rapid increase of the optical emission started on 25 March and peaking on 27 March is mainly due to the synchrotron mechanism. This is also in full agreement with the simultaneous rapid increase of the degree of optical polarization shown in Marscher et al. 2010 (see in particular their Fig. 4). Thermal emission is unpolarized as it reflects the random walk of atoms and ions within the emitting region, therefore such increase of the degree of polarization is a clear signature of a rapid and strong increase of the contribution in the optical band of a non-thermal mechanism such as the synchrotron emission.
8.2 Light curve behaviour and correlations
By comparing the source behaviour observed in -rays by AGILE with the ones observed from optical-to-UV by GASP-WEBT, REM and Swift/UVOT during March 2009 we noted that while the -ray light curve shows evidence of different outbursts of increasing entity, the optical and UV light curves seem to show a gradual increase of the flux in time with a rapid flux enhancement after JD 2454915.0 and a single major outburst occurred between JD 2454917.25 and JD 2454917.60. A variation of 0.48 mag in 9 days (JD 2454906-2454915) was detected in the -band light curve, followed by a more rapid variation of 0.95 mag in 2 days. The light curve shows a similar behaviour, with a variation of 0.43 mag in 7 days and 0.78 mag in the following 2 days. The larger increase observed in -band with respect to band is in agreement with a larger contribution of the synchrotron emission in the optical than in the UV band. A linear fit applied to the -band and -band light curves in Fig. 3 shows a change of slope after JD = 2454915. The optical/UV peak seems to be delayed with respect to the brightest -ray peak by 1–2 days, although we cannot exclude a very rapid optical/UV flare occurred during the gap in the optical and UV light curves before JD 2454917.25.
Another possibility is that the delay between optical and -ray emission is due to our choice of the used for building the -ray daily light curve. To investigate the influence of the on the determination of the -ray peak we constructed three different light curves, considering an integration interval of 1 day and shifting the of T1 = 8 hours and T2 =16 hours with respect to our initial choice ( = 0:00 UT). In Fig. 7 the optical (-band), UV ( filter) and the three -ray light curves built with the different in the period 21–31 March 2009 (labelled as I, II and III) are shown. For each -ray light curve we assign a weight “1” to the three fractional 8-hours bins that constitute the total 1-day bin with the highest flux and a weight “0” to the other fractional bins. Combining the information derived from the three light curves we can build a probability function and estimate the fractional bin that corresponds with the highest probability to the emission peak. In this way we estimated the -ray emission peak at JD = 2454916.33 1.00, leading to a reduced delay between -ray and optical/UV emission, in accordance also with the delay between the Fermi-LAT and optical light curve peaks showed in Abdo et al. (2010a) for the same period. Moreover, we note that a recent investigation of the -LAT data of PKS 1510089 collected in the first half of 2009 by Tavecchio et al. (2010) showed significant -ray variability on timescales of 6 hours and a flux peak on JD = 2454917.25, compatible with our result.

However, a significant increase of the optical/UV emission is detected only for the brightest -ray flare, whereas the optical/UV activity before JD 2454915 was increasing but only slowly, according to a dominant contribution of the thermal emission, over which a subsequent rapid variability of the synchrotron emission is superimposed (see Sec. 8.1). A progressive increase of the source activity, similar to the behaviour of the optical light curve collected by GASP-WEBT, was observed also in the near-IR and optical bands by the REM telescope (Fig. 3), suggesting that the synchrotron is the dominant mechanism responsible for the flux enhancement observed from near-IR to UV at the end of March 2009. In this context, the lag of 131 days between the -ray and the optical peaks reported in Abdo et al. (2010a) could suggest a different origin of the dominant component in optical band during the January and April 2009 flares with respect to the flare occurred at the end of March 2009. This is another clue in favour of a more complex correlation between the optical and -ray emission in the FSRQs, in which the optical emission could be due to the contribution of both the synchrotron emission and the thermal accretion disk emission. Despite the different dominant contribution in the optical part of the spectrum, a similar photon index was observed by AGILE in the -ray spectrum during the first activity period (9–16 March) and the highest activity period (23-27 March), suggesting that the same radiation mechanism is responsible for the high energy emission of the source over the whole observing period.
Moreover, it is worth noting that the variability amplitude observed at the end of March 2009 is similar in optical (a factor of 3) and rays (a factor of 3–4). If the rays were produced by inverse Compton scattering of photons reprocessed by the BLR, as suggested by Abdo et al. (2010a), the -ray emission would be proportional to the number of the emitting electrons, like the synchrotron flux. Therefore, the nearly linear correlation observed between optical and rays may be due to the variation of the electron number in the jet. In this context, the lag of 1 day of the optical peak with respect to the -ray one could be only an upper limit due to the lack of data before the observed optical peak.
Compared to the optical and -ray activity, the X-ray flux is not very variable and does not seem to be correlated with the high -ray activity (see Fig. 7, panel c). The lack of evident X-ray/-ray correlation is not so surprising. In fact, Marscher et al. (2010) already reported that the long-term X-ray light curve of PKS 1510089 collected during the 2006–2009 period by Rossi X-ray Timing Explorer is significantly correlated with the 14.5 GHz one rather than with the -ray emission. This evidence could be justified by the fact that the X-ray photons are likely to originate mostly in the low-energy part of the EC emission. Therefore the X-ray spectral index seems to reflect the change in the low-energy tail of the electron distribution, whereas a change in the high-energy part of the electron distribution should be the driver of the variation of the -ray flux, as already pointed out by Abdo et al. (2010a). Moreover, as already discussed in Kataoka et al. (2008) and D’Ammando et al. (2009a), the spectral evolution of PKS 1510089 could be justified by the contamination at low energies of a second emission component with respect to the EC emission. In this case the X-ray spectral shape of the EC component should remain almost constant, regardless of the activity level, but its flux should vary. Therefore the amount of contamination of the second component should change, being more important when the source is fainter and almost hidden by the EC component when the source is brighter. Possible origins proposed for this second component are the soft X-ray excess, the bulk Comptonization or a more significant contribution of the SSC component in any activity states. A possible hint of increase of activity in X-rays is detected by XRT on 28 March and this could be an indication of an enhancement of the contribution of the synchrotron self Compton (SSC) emission, strictly related to the optical/UV outburst observed on 27 March. The strength of the SSC with respect to EC emission depends on the ratio between the synchrotron and the external radiation energy density, as measured in the comoving frame, . Taking into account that, under the assumption that the dissipation region is within the BLR, depends on the injected power, the size of the emission and the magnetic field, a larger magnetic field can lead to a larger SSC contribution together with an increase and a shift of the synchrotron peak. By contrast, an increase of the SSC emission should lead to a not negligible contribution of this component, which usually shows a photon index of 2 in X-rays for the FSRQs, and therefore a softening of the total X-ray spectrum. Instead a hard X-ray spectrum was observed by XRT ( = 1.31 0.14 on 28 March), confirming that also during a contemporaneous synchrotron flare the SSC contribution is not significant in the X-ray spectrum of PKS 1510089, as already observed by Suzaku during a low state of the source in 2009 (Abdo et al. 2010c).
An alternative scenario is that the electrons radiating at 14.5 GHz produce X-rays via IC scattering of the IR photons from a dust torus. This interpretation favours the “far dissipation” scenario recently proposed again for the emission of FSRQs by Sikora et. (2008) and Marscher et al. (2010), in which the high energy peak is mainly due to the EC scattering of the IR seed photons produced by the torus. In particular, Marscher et al. (2010) identified the dissipation zone with a moving superluminal knot before and after passing the core, which is interpreted as the first recollimation shock visible at millimeter wavelengths in the jet.
It is crucial to discriminate between these two scenarios in order to understand where the plasma blob dissipates in the jet. In fact, the energy density of the different sources of seed photons varies with the distance from the central black hole, therefore the dominant population of target photons depends on the site of the dissipation region that produces the flaring episode. The determination of the location of the emitting region in the jet of blazars is an open issue, in particular for FSRQs. However, the rapid variability observed in the -ray light curve of PKS 1510089 collected by AGILE in March 2009 (even more remarkable in the Fermi-LAT light curves on timescales of hours, Abdo et al. (2010a), Tavecchio et al. 2010) puts severe constraints on the size of the emitting region, leading to a very compact region difficult to be explained if the -ray emission is produced far away from the central black hole. This seems to disfavour the “far dissipation” scenario. On the other hand, the recent detection of this source at TeV energies by H.E.S.S. (Wagner and Behera 2010) suggests possible complex scenarios. We can envisage that more than one emission region is simultaneously active and located at different distance from the central black hole in a spine-sheath (Tavecchio and Ghisellini 2008) or jet-in-jet structure (Giannios et al. 2009).
It is worth noting that the outburst detected by Swift/BAT on 8–9 March 2009 occurred just at the beginning of the -ray activity observed by AGILE. On the other hand, no significant activity is detected by BAT simultaneously with the -ray flares detected by AGILE.
Finally, as shown in Figure 4, no clear sign of strong activity in radio bands is observed during March 2009, although the radio coverage is sparse. However, the SMA data show an increase of about a factor of two between February and March 2009 at millimeter wavelengths, similarly to the optical behaviour even if with a minor variation amplitude. Moreover, the radio data acquired at Metsähovi at 37 GHz on a longer timescale show that the increase of activity marginally observed also in Fig. 4, which starts at the beginning of March 2009 (JD 2454910), has continued gradually in April–May 2009, reaching a peak flux density of 4.02 Jy on 15 May 2009 (JD 2454969.4; see Abdo et al. 2010a). The increase of flux density observed at 37 and 230 GHz confirms that the mechanism producing the -ray flaring events also interested the mm/cm emitting region with difference in time likely related to opacity effects, as already observed in March–April 2008 during the period soon after the previous -ray flare of PKS 1510089 detected by AGILE (D’Ammando et al. 2009a).
In addition, the VLBA data show a minimum of the flux density of the core in March 2009 and since the rotation of the polarization angle of the core was very mild in March relative to next 50 days, it is unlikely that the March -ray flaring episodes are related to the the blob associated with later flares as in the Marscher et al. (2010) model.
9 Summary and concluding remarks
We reported on the detection by AGILE-GRID of -ray activity from the FSRQ PKS 1510089 during March 2009. AGILE data showed an amazing -ray activity, with several flaring episodes and a flux that reached on daily integration 700 10-8 photons cm-2 s-1, the highest flux detected from this source until now and one of the highest detected from a blazar. No significant spectral changes are observed between the different -ray flares in March 2009, indicating that the same mechanism is dominant for the high energy emission of the source over all the period.
This -ray activity triggered simultaneous multiwavelength observations, which provided us a wide dataset for studying the correlation between the emission properties from radio to rays. An increasing activity in near-IR and optical was observed, with a strong flux enhancement after 24 March and a flaring episode on 26-27 March 2009 observed by GASP-WEBT and REM, almost simultaneous to the brightest -ray flare. By contrast, no clear signs of simultaneous high activity were detected from near-IR to UV during the other -ray flares observed by AGILE.
The broad band spectrum from radio-to-UV collected on 18 March confirmed the evidence of thermal signatures, the little and big blue bumps, in the optical/UV spectrum of PKS 1510089 also during high -ray states, and not only during low activity states as observed in other blazars. The radio-to-UV spectrum on 25-26 March showed a flat spectrum in the optical/UV energy band, suggesting an important contribution of the synchrotron emission in this part of the spectrum during the brightest -ray flare and therefore a significant shift of the synchrotron peak, in agreement with the rapid variation detected by UVOT and the drastic change of polarization angle observed in VLBA data simultaneously with the optical flare. The optical/UV spectra presented here clearly show the different contribution of the thermal and non-thermal components in the various phases of the -ray activity of the source, with consequent theoretical implications on the modeling of the broad band spectrum to investigate. It will be important to continue the monitoring of the source from IR to UV to know if the shift of the synchrotron peak observed in March 2009 is a rare event or not.
The Swift/XRT observations show no clear correlation between the X-ray and -ray emission. This could be due to the fact that X-rays and -rays are originated by EC emission of different parts of the electron distribution with different variability. On the other hand, a hint of harder-when-brighter behaviour was detected from the XRT observations suggesting the presence of a second component in the soft X-ray part of the spectrum that could be associated with the soft X-ray excess rather than to the variation of the SSC contribution in different activity states of the source.
Moreover, the radio data show that an increase of the activity related to the -ray activity started in March and peaked in April-May 2009, confirming that the mechanism producing the -ray flare interested also the mm/cm emitting zone, with some delay likely due to opacity effects.
In conclusion, the -ray emission of PKS 1510089 shows a complex correlation with the other wavelengths, leading to different scenarios when modeling its broad band spectrum at different epochs. The multifrequency observations presented here give new clues, but also offer new questions on the astrophysical mechanisms at work in this object. Further IR observations can be important to test the “far dissipation” scenario in which the IR photons are the dominant seed photons for the IC mechanism that produces the -rays, and in this context the launch of Herschel (Pillbratt et al. 2010) opened a new window on the infrared Universe and it will be very important also for the study of blazars (Gonzalez-Nuevo et al. 2010). Finally, the study of the correlation between the -ray activity and the variability of optical polarization provided new information on the jet structure, the location and the causes of the high-energy emission in PKS 1510089. A further piece of the puzzle can be added with the launch of a X-ray polarimeter onboard any future X-ray missions (e.g. the New Hard X-ray Mission, Pareschi et al. 2010) giving us a final answer to the real nature of the X-ray spectrum of this puzzling object.
Acknowledgements.
The AGILE Mission is funded by the Italian Space Agency (ASI) with scientific participation by the Italian Institute of Astrophysics (INAF) and the Italian Institute of Nuclear Physics (INFN). We thank the Swift Team for making these observations possible, particularly the duty scientists and science planners. The Submillimeter Array is a joint project between the Smithsonian Astrophysical Observatory and the Academia Sinica Institute of Astronomy and Astrophysics and is funded by the Smithsonian Institution and the Academia Sinica. UMRAO is funded by a series of grants from the NSF and NASA and by the University of Michigan. This research has made use of data from the MOJAVE database that is maintained by the MOJAVE team (Lister et al. 2009, AJ, 137, 3718). Acquisition of the MAPCAT data is supported in part by MICIIN (Spain) grants AYA2007-67627-C03-03 and AYA2010-14844, and by CEIC (Andalucía) grant P09-FQM-4784. Abastumani Observatory team acknowledges financial support by the Georgian National Science Foundation through grant GNSF/ST08/4-404. The Liverpool Telescope is operated on the island of La Palma by Liverpool John Moores University in the Spanish Observatorio del Roque de los Muchachos of the Instituto de Astrofisica de Canarias, with funding from the UK Science and Technology Facilities Council. The Metsähovi team acknowledges the support from the Academy of Finland to our observing projects (numbers 212656, 210338, and others). St. Petersburg University team acknowledges support from Russian RFBR foundation via grant 09-02-00092. This paper is partly based on observations carried out at the German-Spanish Calar Alto Observatory, which is jointly operated by the MPIA and the IAA-CSIC. Some of the authors acknowledge financial support by the Italian Space Agency through contract ASI-INAF I/088/06/0 and I/009/10/0 for the Study of High-Energy Astrophysics. Facilities: AGILE, Swift, WEBT, REM, UMRAO, and VLBA.References
- (1) Abdo, A. A., et al. 2010a, ApJ, 721, 1425
- (2) Abdo, A. A., et al. 2010b, ApJ, 715, 429
- (3) Abdo, A. A., et al. 2010c, ApJ, 716, 835
- (4) Acosta-Pulido, J. A., Agudo, I., Barrena, R., et al. 2010, AA, 519, 5
- (5) Aller, M. F., Aller, H. D., Hughes, P. A. 1996, ASP CS-110, 193
- Arnaud (1996) Arnaud, K. A. 1996, ‘Astronomical Data Analysis Software and Systems V’, eds. Jacoby G. and Barnes J., ASP Conf. Series, 101, 17
- Bach, Raiteri Villataet al. (2007) Bach, U., Raiteri, C. M., Villata, M., et al. 2007, AA, 464, 175
- Barbiellini et al. (2001) Barbiellini, G., et al. 2001, Amer. Inst. Phys. Conf. Series, Vol. 587, Gamma 2001: Gamma-Ray Astrophysics, ed. S. Ritz, N. Gehrels, & C. R. Shrader, 754
- Barthelmy, Barbier Cummingset al. (2005) Barthelmy, S. D., Barbier, L. M., Cummings, J. R., et al. 2005, Space Science Reviews, 120, 143
- Bessell, et al. (1998) Bessell, M. S., Castelli, F., & Plez, B. 1998, AA, 333, 231
- Blandford, Rees (1978) Blandford, R. D., & Rees, M. J. 1978, in BL Lac Objects ed A.M Wolfe (Univ. Pittsburgh Press), 328
- Burrows et al. (2005) Burrows, D. N., Hill, J. E., Nousek, J. A., et al. 2005, Space Science Reviews, 120, 165
- (13) Canizares, C. R., White, J. L. 1989, ApJ, 339, 27
- Cappi, Matsuoka, Comastri, et al. (1997) Cappi, M., Matsuoka, M., Comastri, A., et al. 1997, ApJ, 478, 492
- Cardelli, et al. (1989) Cardelli, J. A., Clayton, G. C., & Mathis, J. S. 1989, ApJ, 345, 245
- Conconi et al. (2004) Conconi, P., Cunniffe, R., D’Alessio, F., et al. 2004, SPIE, 5492, 1602
- (17) Covino, S., Stefanon, M., Fernandez-Soto, A., et al. 2004, SPIE, 5492, 1613
- D’Ammando, et al. (2008) D’Ammando, F., Bianchi, S., Jiménez-Bailón, E., et al. 2008, AA, 482, 499
- (19) D’Ammando, F., Pucella, G., Raiteri, C. M., et al., 2009a, AA, 508, 181
- D’Ammando, Vercellone, Tavani et al. (2009) D’Ammando, F., Vercellone, S., Tavani, M., et al., 2009b, Astronomer’s Telegram, 1957
- Feroci et al. (2007) Feroci, M., Costa, E., Soffitta, P., et al. 2007, Nucl. Instr. Meth. Phys. Res. A, 581, 728
- (22) Gambill, J. K., Sambruna, R. M., Chartas, G., et al. 2003, AA, 401, 505
- Gehrels et al. (2004) Gehrels, N., Chincarini, G., Giommi, P., et al. 2004, ApJ, 611, 1005
- (24) Ghisellini, G., Celotti, A., Fossati, G., et al. 1998, MNRAS, 301, 451
- (25) Giannios, D., Uzdensky, D. A., Begelman, M. C. 2009, MNRAS, 395, L29
- Giuliani,et al. (2004) Giuliani, A., et al. 2004, Mem. Soc. Astron. Italiana Suppl., 5, 135
- (27) Gonzalez-Nuevo, J., de Zotti, G., Andreani, P., et al. 2010, AA, 518, L38
- Grandi, Palumbo (2004) Grandi, P., and Palumbo, G. 2004, Science, 306, 998
- (29) Gurwell, M. A., Peck, A. B., Hostler, S. R., et al. 2007,Astronomical Society of the Pacific Conference Series, 375, 234
- Hartman et al. (1999) Hartman, R. C., Bertsch, D. L., Bloom, S. D., et al. 1999, ApJS, 123, 79
- Hartman et al. (2001) Hartman, R. C., Böttcher, M., Aldering, G., et al. 2001, ApJ, 553, 683
- (32) Homan, D. C., Ojha, R., Wardle, J. F. C., et al 2002, ApJ, 549, 840
- (33) Hoschino, A., Arons, J. Gallant, Y. A., et al 2002, ApJ, 390, 454
- Jorstad, Marscher, Lister, et al. (2005) Jorstad, S. G., Marscher, A. P., Lister, M. L., et al. 2005, AJ, 130, 1418
- Kalberla, Burton, Hartmann et al. (2005) Kalberla, P. M. W., Button, W. B., Hartmann, D., et al. 2005, AA, 440, 775
- Kataoka,Madejski, Sikora et al. (2008) Kataoka, J., Madejski, G., Sikora, M., et al. 2008, ApJ, 672, 787
- Krimm et al. (2008) Krimm, H. A., Barthelmy, S. D., Cummings, J. R., & Swift/BAT Team 2008, in AAS/High Energy Astrophysics Division, Vol. 10, AAS/High Energy Astrophysics Division, #07.01
- (38) Krimm, H. A., Barthelmy, S. D., Baumgartner, W., et al. 2009, Astronomer’s Telegram, 2330
- (39) Kubo, H., Takahashi, T., Madjeski, G., et al. 1998, ApJ, 504, 693
- Labanti et al. (2009) Labanti, C., Marisaldi, M., Fuschino, F., et al. 2009, Nucl. Instr. Meth. Phys. Res. A, 598, 470
- (41) Laor, A. 1990, MNRAS, 246, 369
- (42) Larionov, V. M., Villata, M., Raiteri, C. M., et al. 2009, Astronomer’s Telegram 1990
- Lawson, Turner Williams et al. (1992) Lawson, A. J., Turner, M. J., Williams, O. R., et al. 1992, MNRAS, 259, 743
- Lister, Homan, Kadler, et al. (2009) Lister, M. L., Homan, D. C., Kadler, M., et al. 2009, ApJ, 696, L22
- Malkan & Moore (1986) Malkan, M. A., & Moore, R. L. 1986, ApJ, 300, 216
- (46) Malmrose, M. P., Marscher, A. P., Jorstad, S. G., et al. 2011, ApJ accepted, arXiv:1103.1682
- (47) Marscher, A. P., Jorstad, S. G., Larionov, V. M., et al. 2010, ApJ, 710, L126
- Mattox (1993) Mattox, J. R. 1993, ApJ, 410, 609
- Mattox Bertsch Chiang (1996) Mattox, J. R., Bertsch, D. L., Chiang, J., et al. 1996, ApJ, 461, 396
- (50) Mukherjee, R., Dingus, B. L., Gear, W. K., et al. 1996, ApJ, 470, 831
- (51) Nandikotkur, J., Jahoda, K. M., Hartman, R. C., et al. 2007, ApJ, 657, 706
- Nieppola, Valtoja, Tornikoski, et al. (2008) Nieppola, E., Valtoja, E., Tornikoski, M., et al. 2008, AA, 488, 867
- (53) Page, K. L., Reeves, J. N., O’Brien, P. T., et al. 2005, MNRAS, 364, 195
- (54) Pareschi, G., Tagliaferri, G., Argan, A., et al. 2010, AIPC, 1248, 567
- Perotti Fiorini Incorvaia et al. (2006) Perotti, F., Fiorini, M., Incorvaia, S., et al. 2006, Nucl. Instr. Meth. Phys. Res. A, 556, 228
- Pian & Treves (1993) Pian, E., & Treves, A. 1993, ApJ, 416, 130
- Pian et al. (1999) Pian, E., et al. 1999, ApJ, 521, 112
- (58) Pilbratt, G. L., Riedinger, J. R., Passvogel, T., et al. 2010, AA, 518, L1
- Poole Breeveld Page (2008) Poole, T. S., Breeveld, A. A., Page, M. J., et al. 2008, MNRAS, 383, 627
- Prest et al. (2003) Prest, M., Barbiellini, G., Bordignon, G., et al. 2003, Nucl. Instr. Meth. Phys. Res. A, 501, 280
- Pucella, Vittorini, D’Ammando et al. (2008) Pucella, G., Vittorini, V., D’Ammando, F., et al. 2008, AA, 491, L21
- Pucella, D’Ammando, Tavani et al. (2009) Pucella, G., D’Ammando, F., Tavani, M., et al., 2009, ATel, 1968
- Raiteri et al. (1998) Raiteri, C. M., Villata, M., Lanteri, L., et al. 1998, AAS, 130, 495
- Raiteri et al. (2005) Raiteri, C. M., Villata, M., et al. 2005, AA, 438, 39
- Raiteri et al. (2007) Raiteri, C. M., Villata, M., Larionov, V. M., et al. 2007, AA, 473, 819
- Raiteri et al. (2008) Raiteri, C. M., Villata, M., Larionov, V. M., et al. 2008, AA, 491, 755
- Raiteri et al. (2010) Raiteri, C. M., Villata, M., Bruschini, L., et al. 2010, AA, 524, 43
- (68) Romanova, M. M., Lovelace, R. V. E. 1992, AA, 262, 26
- Roming et al. (2005) Roming, P. W. A., Kennedy, T. E., Mason, K. O., et al. 2005, Space Science Reviews, 120, 95
- (70) Schlegel, D. J., Finkbeiner, D. P., Davis, M. 1998, ApJ, 500, 525
- Siebert,et al. (1998) Siebert, J., Brinkmann, W., Drinkwater, M. J., et al. 1998, MNRAS, 301, 261
- (72) Sikora, M., Blazejowski, M., Moderski, R., and Madejski, G. M. 2002, ApJ, 577, 78
- (73) Sikora, M., Moderski, R., and Madejski, G. M. 2008, ApJ, 675, 71
- Singh, Shrader, George (1997) Singh, K. P., Shrader, C. R., & George, I. M. 1997, ApJ, 491, 515
- (75) Smith, P. S., and Balonek, T. J. 1998, PASP 110, 1164
- Tanner et al. (1996) Tanner, A. M., Bechtold, J., Walker, C. E., et al. 1996, AJ, 112, 62
- Tavani, et al. (2009) Tavani, M., Barbiellini, G., et al. 2009, AA, 502, 995
- (78) Tavecchio, F., Maraschi, L., Ghisellini, G., et al. 2000, ApJ, 543, 535
- (79) Tavecchio, F., and Ghisellini, G. 2008, MNRAS98, L102
- (80) Tavecchio, F., Ghisellini, G., Bonnoli, G., Ghirlanda, G. 2010, MNRAS, 405, L94
- Tosti et al. (2004) Tosti, G., Bagaglia, M., Campeggi, C., et al. 2004, SPIE, 5492, 689
- Urry, Padovani (1995) Urry, C. M., & Padovani, P. 1995, Publication of the Astronomical Society of the Pacific. J Phys., 107, 803
- Vercellone, D’Ammando, Pucella et al. (2009) Vercellone, S., D’Ammando, F., Pucella, G., et al. 2009, ATel, 1976
- (84) Vercellone, S., D’Ammando, F., Vittorini, V., et al. 2010, ApJ, 712, 405
- Villata et al. (2002) Villata, M., Raiteri, C. M., et al. 2002, AA, 390, 407
- Villata et al. (2008) Villata, M., Raiteri, C. M., Larionov, V. M., et al. 2008, AA, 481, L79
- Villata et al. (2009) Villata, M., Raiteri, C. M., Gurwell, M. A., et al. 2009a, AA, 504, L9
- Villata et al. (2009) Villata, M., Raiteri, C. M., Larionov, V. M., et al. 2009b, Astronomer’s Telegram, 1988
- (89) Wagner, S. J., and Behera, B. 2010, BAAS, 41, 660
- Wardle, Homan, Cheung et al. (2005) Wardle, J. F. C., Homan, D. C., Cheung, C. C., et al. 2005, ASPC, 340, 67
- Wills et al. (1985) Wills, B. J, Netzer, H., Wills, D. 1985, ApJ, 288, 94
- Zerbi et al. (2004) Zerbi, F. M., Chincarini, G., Ghisellini, G., et al. 2004, SPIE, 5492, 1590