A detailed study of the H ii region M 43 and its ionizing star††thanks: The INT and WHT telescopes are operated on the island of La Palma by the RGO in the Spanish Roque de los Muchachos Observatory of the Instituto de Astrofísica de Canarias.
Abstract
Aims. We have selected the Galactic H ii region M 43, a close-by apparently spherical nebula ionized by a single star (HD37061, B0.5 V) to investigate several topics of recent interest in the field of H ii regions and massive stars. In a series of two papers, we perform a combined, comprehensive study of the nebula and its ionizing star by using as many observational constraints as possible.
Methods. We collected for this study a set of high-quality observations, including the optical spectrum of HD 37061, along with nebular optical imaging and long-slit spatially resolved spectroscopy. The first part of our study comprises a quantitative spectroscopic analysis of the ionizing star, and the empirical analysis of the nebular images and spectroscopy. All the information obtained here will be used to construct a customised photoionization model of the nebula in Paper II.
Results. We determine the stellar parameters of HD 37061 and the total number of ionizing photons emitted by the star. We find observational evidence of scattered light from the Huygens region (the brightest part of the Orion nebula) in the M 43 region. We show the importance of an adequate correction of this scattered light in both the imagery and spectroscopic observations of M 43 in accurately determining the total nebular H luminosity, the nebular physical conditions. and chemical abundances. We perform a detailed nebular empirical analysis of nine apertures extracted from a long-slit located to the west of HD 37061 (east-west direction), obtaining the spatial distribution of the physical conditions and ionic abundances. For three of the analyzed elements (O, S, and N), we determine total abundances directly from observable ions (no ionization correction factors are needed). The comparison of these abundances with those derived from the spectrum of the Orion nebula indicates the importance of the atomic data and, specially in the case of M 42, the considered ionization correction factors.
Key Words.:
ISM: HII regions – ISM: individual: M 43 – ISM: abundances – Stars: early-type – Stars: fundamental parameters – Stars: atmospheres – Stars: individual: HD 37061 –1 Introduction
M 43 (NGC1982) is an apparently spherical H ii region several arcmin to the northeast of the well-known Orion nebula. HD 37061 (NU Ori, Par 2074, Brun 747), an early B-type star with broad lines located at the center of the nebula, is the main ionizing source of M 43. The spectral classifications found in the literature for HD 37061 range between B0.5 V and B1 V, probably because of the difficulty in detecting the faint He ii 4541 line when using low resolution spectra and photographic plates. Up to three components have been identified within this stellar system (Abt et al., 1991; Preibisch et al., 1999). The primary star is known to be a spectroscopic binary (SB1) with an estimated stellar mass ratio / 0.19 (Abt et al., 1991). Using bispectrum speckle interferometry, Preibisch et al. (1999) found a third companion at 470 mas with a flux ratio in the K-band of 0.03 0.02, implying a stellar mass ratio / 0.07. Although the less massive components may affect the spectrum of the primary, they can be neglected in terms of ionization of the nebula.
M 43 belongs to the same molecular complex as the Orion nebula (Goudis, 1982). In particular, M 43 is located at the northeast border of the extended Orion nebula (EON), a large elliptical structure surrounding the Huygens region (corresponding to the central, brighter part of the Orion nebula). Although the precise structure of the EON is still unknown, recent studies (O’Dell & Goss, 2009; O’Dell & Harris, 2010) have associated the diffuse111The H surface brightness in the EON is two orders of magnitude lower than the brightest regions in M 42. and extended emission arising from this region with scattered light, produced by dust reflecting the stellar continuum emission from the Trapezium cluster stars and the nebular line emission from the Huygens region. A dust lane defines the outer northern boundary of the EON and separates M 43 from the Huygens region. As inferred from the optical polarization map of the M 43 region obtained by Khallesse et al. (1980), this dust lane is not a foreground obscuration but a wall of dense material between M 42 and M 43. This wall of material ensures that it is quite unlikely that ionizing light from the Trapezium cluster stars reaches the nebular material ionized by HD 37061; however, owing to the proximity of M 43 to the assumed northern boundary of the EON, a scattered light contribution (similar to the one described above) may still affect affect the nebular emission received from M 43.
Most studies of M 43 have been performed at radio and far-infrared wavelengths. These studies were centered on the investigation of the global properties of the nebula (i.e. geometry, and , Mills & Shaver, 1968; Thum et al., 1978; Thronson et al., 1986; Subrahmanyan, 1992), and the characteristics of the dust re-radiation inside the nebula (Thum et al., 1978; Smith et al., 1987). As for optical images, radio continuum observations indicate that M 43 has a circular shape (Subrahmanyan, 1992). In addition, images at 60 m published by Thronson et al. (1986), and the kinematical study by Hänel (1987) allow one to associate the nebula with a shell-shaped cavity on the side of a dense molecular ridge.
Its proximity222The distance to HD 37061 and M 43 can be assumed to be similar to that of its
companion nebula M 42. Two different studies using
Very Long Baseline Array observations (Menten et al., 2007; Sandstrom et al., 2007) determined the distance to
some stellar objects in M 42 to be 414 7 pc and 389 pc, respectively.
These new measurements are 10% lower than the 450 pc distance
often assumed for the Orion nebular cloud (ONC). We refer the reader to Menten et al. (2007)
for a discussion of the different distances that have been determined
using different methods (viz. Jeffries (2007): 392 pc,
based on the statistical properties of rotation in pre-MS-stars;
Goudis (1982): 480 pc, for a long time considered the canonical distance).,
relatively high surface brightness, simple geometry, and
isolated ionizing source make the Mairan’s nebula an ideal object
to investigate several topics of interest in the field of H ii regions and massive stars.
To this aim, we collected a set of high quality observations comprising
the optical spectrum of HD 37061, along with optical imaging and long-slit
spatially resolved spectroscopy of M 43. These observations were used to
perform a comprehensive study of M 43 and its ionizing star, which is presented
in two parts. In this first paper, we (1) obtain the stellar parameters of HD 37061,
(2) investigate the presence of the scattered light in the region of M 43 and
its effect on the derived nebular properties, and (3) determine the physical conditions
and nebular abundances in M 43 obtained at various distances to the center of the nebula.
All this information is then used in a second paper (Simón-Díaz et al., Paper II, in prep.)
to construct a specialized photoionization model of the nebula using as many
observational constraints as possible. The main drivers of this second part of our study
are to (1) test the reliability of the ionizing spectral energy distributions (SEDs)
provided by the modern stellar atmosphere codes using nebular constraints, (2)
investigate the effect of stellar pumping (Ferland, 1999; Luridiana et al., 2009) on the nebular
emission arising from the inner part of this H ii region, and (3) test our
understanding of the nebular energy budget temperature distribution.
This paper is structured as follows. The observational data set is presented in Sect. 2. A quantitative spectroscopic analysis of the optical spectrum of HD 37061 is performed in Sect. 3. The morphological characteristics of the nebula, along with its physical conditions and nebular abundances are determined in Sects. 4 and 5 by analyzing of the H, H, [O iii], and [S ii] narrow-band images, and the nebular spectra, respectively. Both nebular analyses also allow us to find several indications of an extended nebular emission, not directly related to M 43, which must be adequately subtracted for a correct interpretation of the nebular images and spectroscopy. Finally, we outline the main results of this study in Sect. 6.
2 The observational data set
2.1 Nebular imaging
| Nebular imaging | ||||
| Instrument | Filter | # | (Å) | FWHM (Å) |
| (Telescope) | ||||
| WFC | H | 197 | 6568 | 95 |
| (INT) | H redsh. | 228 | 6805 | 93 |
| (0.33 arcsec/pix) | H narrow | 225 | 4861 | 30 |
| H broad | 224 | 4861 | 170 | |
| [O iii] | 196 | 5008 | 100 | |
| [S ii] | 212 | 6725 | 80 | |
| Nebular spectroscopy | ||||
| Grid | (Å) | Spect. range (Å) | (Å/pix) | |
| ISIS | R600B | 4368 | 3386–5102 | 0.45 |
| (WHT) | R600R | 6718 | 6064–7585 | 0.49 |
| Stellar spectroscopy | ||||
| Grid | (Å) | Spect. range (Å) | (Å/pix) | |
| IDS | H 2400B | 4320 | 4060 - 4590 | 0.24 |
| (INT) | H 2400B | 4800 | 4550 - 5070 | 0.24 |
| H 1800V | 6400 | 6090 - 6760 | 0.31 | |
The Wide Field Camera333http://www.ing.iac.es/Astronomy/instruments/wfc/ (WFC) attached to the Isaac Newton Telescope (INT) at the Roque de los Muchachos Observatory (La Palma, Spain) was used to obtain several narrow-band filter images of M 43 in 2004 February 16, and 2006 October 21. The WFC-INT consists of four thinned EEV 2kx4k CCDs located at the primary focus of the telescope. Each CCD yields a field of view of 11.2’ 22.4’, which results in a edge to edge limit of the mosaic (neglecting the 1 arcmin inter-chip spacing) of 34.2 arcmin. The pixel size is 13.5 m corresponding to 0.33 arcsec/pixel.
We centered M 43 on chip#4 of the WFC, and obtained images of the region using the narrow-band filters H, [O iii] 5007, H, and [S ii] 6716+30. The log of the observations, along with the characteristics of the various filters can be found in Table 1. While the [O iii] and [S ii] images were only obtained to provide some qualitative information about the nebula, we wished to produce pure emission-line, flux-calibrated images for H and H. We hence obtained these images during a photometric night, and included the H redshifted, and H broad filters in our set of observations, to correct the H and H images for the adjacent continuum. The exposure times considered for the images in the various filters were 460 s for H, 4120 s for H continuum, 3120 s for H, 3180 s for H continuum, 512 s for [O iii], and 512 s for [S ii].
The reduction of the images was performed following the standard procedures (trimming, bias subtraction, flat-fielding, and alignment) with IRAF444IRAF is distributed by NOAO which is operated by AURA Inc., under cooperative agreement with NSF. H and H images were flux calibrated using observations of the spectrophotometric standard star BD +28∘4211 (Landolt & Uomoto, 2007) at different airmasses. We obtained the continuum-subtracted H and H images following the procedure described in López-Sánchez & Esteban (2008).
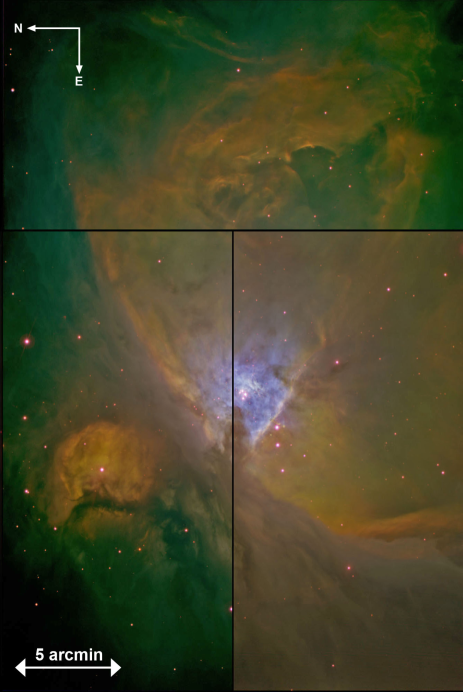
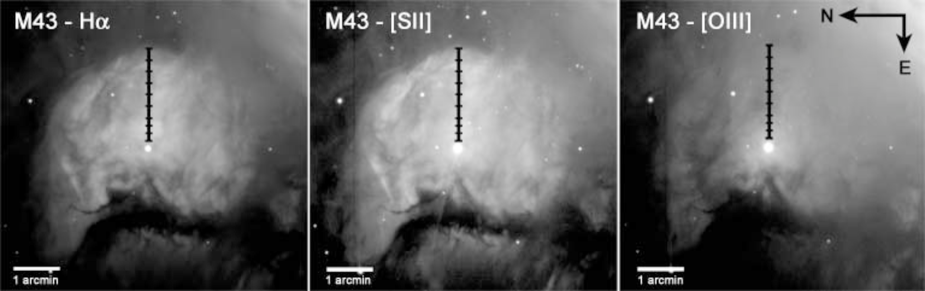
The large field of view of the WFC also allowed us to include M 42 in the images. A color-composite image of the M 43+M 42 region obtained from a combination of the [O iii] (blue), H (green), and [S ii] (red) images is presented in Fig. 1. Individual images in each one of these three filters, showing a square region of 6 arcmin centered in M 43, are presented in Fig. 2.
2.2 Stellar spectroscopy

The spectroscopic observations of HD 37061 were carried out with the INT on 2006 August 30 and September 5. The Intermediate Dispersion Spectrograph (IDS) was used with the 235 mm camera and two different gratings (see Table 1). We observed the spectral region between 4000 and 5050 Å using the H2400B grating, which resulted in an effective resolving power R 7500 (equivalent to a 0.24 Å/pixel resolution and 2.6 pixel fwhm arc lines). For the H region ( 6090 – 6760 Å), the H1800V grating was used, resulting in a similar spectral resolution (0.31 Å/pixel, R 8000). With these configurations, three exposures were needed to cover the whole range. We obtained spectra with exposure times of 180 s and 70 s for the blue (2) and red (1) configurations, respectively, and obtained two spectra per spectral range. A large number of flat fields and arcs for the data reduction process were obtained.
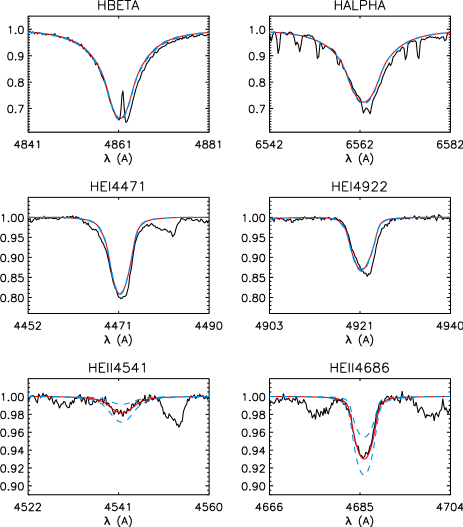
The reduction and normalization of the spectra was made following standard techniques, with IRAF and our own software developed in IDL. The signal-to-noise ratio of the reduced spectra is about 300 – 400, depending on the spectral range. Fig. 3 shows the global stellar spectrum, along with the H i and He i-ii lines used for the quantitative spectroscopic analysis.
2.3 Nebular spectroscopy

A long-slit, intermediate-resolution spectrum of M 43 was obtained on 2006 December 23 with the Intermediate dispersion Spectrograph and Imaging System (ISIS) spectrograph attached to the 4.2m William Herschel Telescope (WHT) at Roque de los Muchachos Observatory (La Palma, Spain). The 3.7′ 1.02′′ slit was located to the west of HD 37061, along the E-W direction (PA=90∘, see Fig. 2). Two different CCDs were used at the blue and red arms of the spectrograph: an EEV CCD with a configuration 4096 2048 pixels at 13.5 m, and a RedPlus CCD with 4096 2048 pixels at 15.0 m, respectively. The dichroic used to separate the blue and red beams was centered on 5400 Å. The gratings R600B and R600R were used for the blue and red observations, respectively (see log of the observations in Table 1). These gratings give a reciprocal dispersion of 33 Å mm-1 in both cases, and effective spectral resolutions of 2.2 and 2.0 Å, respectively. The blue spectra cover from 3386 to 5102 Å and the red ones from 6064 to 7585 Å. The spatial scales are 0.20′′ pixel-1 and 0.22′′ pixel-1, respectively. The seeing during the observations was between 0.5′′ and 0.8′′. The exposure times were 3300 s, in both the blue and red observations (obtained at the same time).
The spectra were wavelength calibrated with a CuNe+CuAr lamp. The correction for atmospheric extinction was performed using the average curve for continuous atmospheric extinction at Roque de los Muchachos Observatory. The absolute flux calibration was achieved by observations of the standard stars HD 19445, H 600, and HD 84937. We used the standard IRAF TWODSPEC reduction package to perform bias correction, flat-fielding, cosmic-ray rejection, wavelength, and flux calibration. Fig. 4 shows an illustrative example of the global appearance of our nebular spectroscopic observations, also indicating the main nebular lines used in this study.
3 Quantitative spectroscopic analysis of HD 37061
The stellar parameters of the star were derived by visually comparing the observed optical H i, He i, and He ii line profiles with the synthetic ones resulting from the stellar atmosphere code FASTWIND (Santolaya-Rey et al., 1997; Puls et al., 2005), which is an established technique. Similar analyses, along with some notes on the methodology, can be found in Herrero et al. (2002), Repolust et al. (2004), Simón-Díaz et al. (2006), and references therein.
To this aim, we constructed a grid of FASTWIND models with , and log g, ranging from 28000 to 33000 K (500 K steps), and from 3.9 to 4.3 dex (0.1 dex steps), respectively. The microturbulence, the helium abundance, and the wind-strength parameter555. were fixed to characteristic values for an early B dwarf star ( = 5 km s-1, = 0.09, and log Q = -15, respectively) and metal abundances were assumed to be solar (following the set of abundances by Asplund et al., 2009).
This technique requires the projected rotational velocity ( sin ) of the star to be previously established. All metal lines in the spectrum of HD 37061 are blended or very shallow because of the large sin of the star; therefore, we decided to apply the Fourier method (c.f. Gray 1976; see also Simón-Díaz & Herrero 2007 for a recent application to OB-type stars) to the He i lines, and obtained a sin 200 km s-1.
| (K) | 31000 500 | R (R⊙) | 5.7 0.8 |
|---|---|---|---|
| log g(dex) | 4.2 0.1 | logL/L⊙ | 4.42 0.12 |
| (He) | 0.09 (assumed) | M (M⊙) | 19 7 |
| log Q | -15 (assumed) | log Q(H0) | 47.2 0.2 |
The synthetic H i and He i-ii line profiles resulting from the models were then convolved with the corresponding instrumental and rotational profiles and compared with the observations. The best fit was found for = 31000 K and log g = 4.2 dex (see Fig. 5). Given the quality of the spectrum and the sensitivity of the used lines to the variation in and log g for this range of stellar parameters, an accuracy of 500 K and 0.1 dex, respectively, could be achieved. As an example, in Fig. 5 we show the effect of a variation of 1000 K in the FASTWIND models. For this range of stellar parameters, the He ii lines are decisive in constraining the .
We note the poor quality of the fits in the red wings of the H i and He i lines (but not in the He ii lines). These lines are likely affected by the spectrum of the cooler secondary spectroscopic component (see Sect. 1).
Once the stellar parameters have been determined, the stellar radius can be derived from the absolute visual magnitude () and the synthetic spectral energy distribution provided by the stellar atmosphere model. By using =6.84 and =2.09 (Hillenbrand, 1997), and adopting a distance to the star of 40050 pc, we obtained an = -3.30.3, quite consistent with the spectral type of HD 37061. The resulting stellar parameters, along with the total number of ionizing photons are summarized in Table 2.
4 Qualitative and quantitative analysis of the nebular images
Fig. 1 shows a color composite image of the M 42+M 43 region. The object under study, M 43, appears as a roundish H ii region centered around HD 37061, and well-separated from the Orion nebula (M 42) by a dust lane (known as the northeast dark lane). The nebula has a diameter of 4.5 arcmin ( 0.65 pc at a distance of 400 pc), and is crossed by a dark lane oriented N-S in the eastern side (known as the M43 dark lane). This dark cloud is located in front of the nebula, blocking the nebular light coming from behind.
Fig. 2 shows a closer view of the nebula, where three images of M 43, taken through filters isolating H (+[N ii] 6548+84), [S ii] 6716+30, and [O iii] 5007, are presented separately. The images show diffuse and extended emission beyond the limits of the nebula (mainly to the south and west). This emission can be more clearly seen in the [O iii] image. If the entire nebula were spherical with a density of 500 cm-3, the size of the O2+ region would be 25 % of the total size of the nebula666Computed from a simple spherical Cloudy model using the ionizing spectral energy distribution from a FASTWIND model with = 31000 K, and log g = 4.2.; however, Fig. 2 shows that the [O iii] emission originates in a more extended region (i.e. is unlikely to be related777This extended emission is more likely to be associated with the scattered nebular light arising from the EON, described by O’Dell & Goss (2009) and O’Dell & Harris (2010). See a more detailed discussion about this possibility in Sect. 5.9. to nebular material ionized by HD 37061).
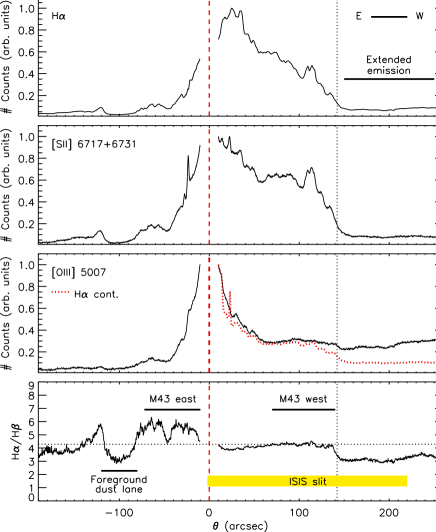
To more clearly illustrate this, we plot in Fig. 6 (three upper panels) the spatial distribution of H, [S ii], and [O iii] emission in a line passing by HD 37061 along the east-west direction, obtained from the corresponding WFC-INT images. Since we are only interested in the relative spatial changes, the three distributions are normalized to their maximum value. In all cases, a faint emission, not expected to be related to M 43, is clearly detected beyond the limits of the nebula. In the [O iii] panel, we also superimpose the spatial distribution derived from the H-continuum image to show that the extended emission observed in the [O iii] image is not associated with the nebular continuum.
4.1 Extinction
The flux-calibrated, continuum-subtracted H and H images (i.e. pure emission) were used to obtain the H/H flux ratio distribution along the diameter in the east-west direction passing by the ionizing star of M 43 (see bottom panel in Fig. 6). Some interesting information about the extinction in the studied region can be extracted by inspecting of this figure:
-
a)
There is a jump in the H/H flux ratio 140 arcsec west of HD37061 (i.e. western boundary of M 43), indicating a clear difference in the type of emission arising from outside the limits of the nebula. We note that the lower H/H ratio found in the “extended emission” region agrees with the hypothesis that this emission is associated with scattered light (see also Sect. 5.9), and is not necessarily an indication of a lower extinction in this region.
-
b)
The H/H ratio in the western region of M 43 is fairly constant, though there is a small decrease close to the star. On the other hand, this ratio is larger in the eastern part.
-
c)
The M 43 dark lane location (labeled as a foreground dust lane in Fig. 6) is clearly represented in the H/H distribution.
Smith et al. (1987) presented a general view of the spatial distribution of dust in the M 43 region. They found three regions where dust reradiation in 60 m is concentrated (see a schematic map of dust features in their Fig 1.c). The first one is associated with the M 43 dark lane (they called it the foreground dust lane), the second one (M 43 east) is located to the east of HD 37061, between the ionizing star and the M 43 dark lane, and a third one (M 43 front + M 43 west) follows the border of the nebula from the north to the west. This third feature of dust emission is separated 60-70 arcsec from the star, leaving a “dust-empty” space in-between. We indicate in the bottom panel of Fig. 6 the location of these dust features using the same nomenclature as Smith et al.
The observed behavior of the H/H flux ratio within M 43 along the west-east direction is perfectly correlated with the dust distribution presented by Smith et al. (1987). It is remarkable that, in contrast to expectations, the amount of extinction indicated by the H/H flux ratio in the foreground dust lane is very low. The explanation is simple. This dark feature obscures the emission from M 43, hence the observed light originates in the material located in front. This emission follows the trend indicated by the region marked as “extended emission”.
4.2 Total nebular H luminosity and surface brightness
To derive the total nebular H luminosity we proceeded as follows. First, the H image was corrected for the effects of distance, extinction, and [N ii] contamination888Note that what we refer to as a ”H image” is actually a ”H+[N ii] 6548+84” image.. Denoting with the nebular flux received at Earth, the corresponding extinction-corrected H luminosity can be derived from:
| (1) |
where is the distance to the nebula, (H) is the reddening coefficient, and is the value of the extinction function in H relative to H.
The analysis of the H/H image (Section 4.1) showed that the extinction is not constant across the nebula. The optimal strategy to follow would be to obtain (H) for every pixel from the H/H images, correct the H image, and then integrate the whole nebula to obtain the total L(H). However, when we attempted to follow this strategy we found that it introduces many sources of uncertainty. In addition, the nebular region hidden by the dark lane cannot be corrected in this way. We therefore decided to follow a different approach, taking into account what we learned from the inspection of the nebular images, and making use of the information extracted from the spectroscopic observations (see Sect. 5). We decided to integrate only the west quadrant of the nebula, and multiply the resulting value by four (i.e. we assume the nebula is symmetric). Extinction in this quadrant is lower and more constant than in the other three. Furthermore, we have information about (H) ( 0.76) and the nitrogen contribution to the H image ([N ii] 6548+84/H 0.59) for this region from the ISIS-WHT spectroscopy (see Sect. 5).
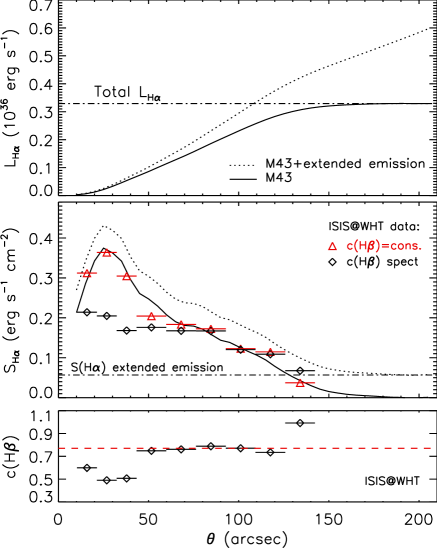
Once the distance, extinction, and nitrogen corrections had been applied to the continuum-subtracted, flux-calibrated H image, we obtained the L(H) inside circles of increasing sizes999Actually, we integrated the mentioned quadrant and multiply the obtained value by four. (centered on the star), and the surface brightness distribution within concentric rings of increasing radii. Fig. 7 shows the measured quantities as a function of distance to the star. Dotted lines show the initial determinations where the images were not corrected for the extended emission contribution. The H surface brightness distribution again shows that outside the limits of the nebula ( 160 arcsec) there remains a non-negligible, more or less constant emission. This implies that L(H) increases continuously, even outside the nebula (top panel in Fig. 7). We therefore assumed a constant101010We note that the H surface brightness of the extended emission is not necessarily constant across the nebula; however, its variation is negligible compared to the H emission from M 43, hence can be considered to be constant for the sake of simplicity. contribution of the extended emission to the surface brightness ( 0.06 erg s-1 cm-2, see middle panel of Fig. 7) and subtracted it from the H image. The resulting L(H) and S(H) distributions, calculated from the corrected images in the same way as described above, are indicated as solid lines in the top and middle panels of Fig. 7. These quantities behave as expected, i.e., the surface brightness becomes zero, and L(H) remains constant for RRneb. The resulting total H luminosity is (3.31.1) x 1035 erg s-1, where the associated uncertainty was calculated by taking into account uncertainties of 12.5%, 10%, and 20% in distance, (H), and (H), respectively.
The bottom panel of Fig. 7 shows the (H) values obtained from the spectroscopic analysis of the 9 apertures extracted from the long-slit ISIS-WHT observations (see Sect. 5.2). As for the H/H images (bottom panel in Fig. 6), we found that (H) is fairly constant for 50 arcsec, but is somewhat smaller in the inner region (close to the star). We also include some information obtained from the spectroscopy in the middle panel of Fig. 7 (surface brightness profile). Red triangles correspond to the calculated S(H) in each aperture assuming a constant (H) of 0.76. The derived values follow the S(H) profile obtained from the H image. The middle panel in Fig. 7 also shows the corresponding S(H) values computed from the actual (H) values derived from the spectroscopic analysis (black diamonds). These values deviate from the constant extinction-corrected values in the inner part of the nebula. We can conclude that the increase in S(H) in the inner part of the nebula is not necessarily caused by an increase in the emission measure or a deviation from the spherical geometry, but is more likely to be an effect of a non-constant extinction or stellar pumping effects on H recombination lines (see Ferland, 1999; Luridiana et al., 2009). The total L(H) we derived above must hence be corrected for this effect, resulting in (3.01.1) x 1035 erg s-1 (about 10% below the previously derived value).
In Sect. 3, we derived the total number of ionizing photons emitted by the central star (Q(H0) = 10 photons s-1). This would imply a maximum nebular H luminosity of (2.51.0) x 1035 erg s-1, a value that is in quite good agreement with the total H luminosity obtained from the analysis of the nebular images. This result is compatible to first order with M 43 being a (mostly) ionization-bounded nebula in which dust does not absorb any significant fraction of the Lyman continuum photons.
We note that the stellar and nebular results would be incompatible if we considered the total nebular H luminosity obtained from the images that are not corrected for the extended emission contribution. The total number of ionizing photons necessary to explain the derived nebular H luminosity would be at least double the value obtained from the analysis of the star.
5 Empirical analysis of the nebular spectra
5.1 More indications of extended nebular emission
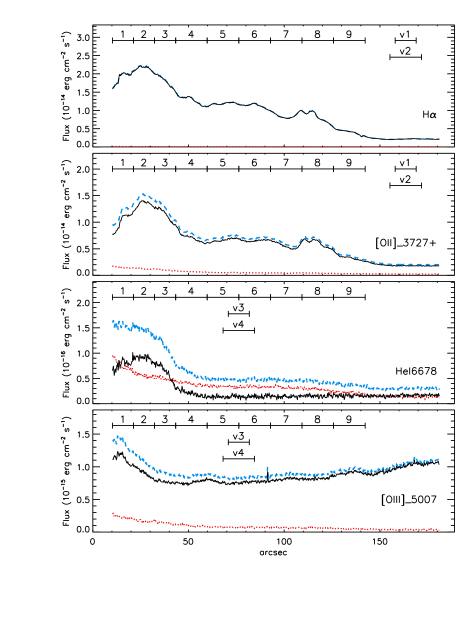
Fig. 8 shows the spatial distribution of the nebular emission in four selected lines (H, [O ii] 3720+30, He i 6678, and [O iii] 5007) and their respective adjacent nebular continua. These distributions were obtained from the ISIS@WHT spectroscopic observations. The colored lines represent the measured line fluxes (blue), the adjacent continuum emission (red), and the continuum-subtracted line fluxes (black). These figures display non-negligible emission beyond the limits of the nebula (150 arcsec), that is not associated with the continuum emission. In most cases, this external emission remains fairly constant in the studied region (e.g. H, [O ii] 3720+30, He i 6678, as well as [N ii], [S ii], and [S iii] lines). However, in some cases (e.g. [O iii]), this emission increases with increasing distance from the star.
5.2 Aperture selection and line flux measurements
We obtained one-dimensional (1D) spectra of regions of the nebula at different distances from the central star by dividing the long-slit used for the ISIS-WHT nebular observations into nine small apertures within the limits of the nebula (150 arcsec) with the aim of obtaining: a) the radial distribution of the physical properties of the nebula, b) information about nebular ionic and total abundances, and c) the radial distribution of critical nebular line ratios used as observational constraints on photoionization models of the nebula.
The size and position of the apertures are summarized in Table 3 and shown in Figs. 2 and 8. It is crucial to correct these spectra for the contribution of the extended emission component to obtain information about M 43 itself. To achieve this aim, spectra from two extra-apertures outside the nebula were extracted to correct the line flux measurements of the apertures for the extended emission component. The size of the extra-apertures was selected to be the same as the corresponding apertures inside the nebula (11 and 16.5 arcsec for the three innermost and the other outer apertures, respectively). Two different locations of these extra-apertures were considered depending on whether the considered nebular emission line had been emitted in the whole nebula (i.e. H i, [O ii], [N ii], [S ii] and [S iii] lines; apertures v1 and v2 in Fig, 8), or only in the inner region (i.e. He i, [O iii], and [Ar iii] lines; apertures v3 and v4 in Fig. 8). For the latter set of lines, it is impossible to use the same apertures (v1 and v2) as for the other lines, since the extended emission in these cases is not constant, but increases far away from the star. We hence considered two apertures as being close to the region where we were confident that the contribution of the nebular emission associated with M 43 had vanished. We expect the spectrum from these apertures to represent the properties of the extended emission close to the region where M 43 is emitting in the given nebular line.
The extraction of 1D spectra from each aperture was performed using the IRAF task . The same zone and spatial coverage was considered in the blue and red spectroscopic ranges.
We detected H i and He i optical recombination lines, along with collisionally excited lines (CELs) of several ions, such as [O i], [O ii], [O iii], [N ii], [S ii], [S iii], [Ne iii], and [Ar iii]. Line fluxes were measured using the SPLOT routine of the IRAF package by integrating all the flux included in the line profile between two given limits and over a local continuum estimated by eye. Although we detected two [Ne iii] lines, these were unsuitable for analysis because they were extremely faint (in the case of 3869) or were severely blended with H i3967. In the case of [O ii] 7330 Å, we corrected the flux for the overlapping telluric emission line OH 8–3 P2 7329.148 Å by estimating its intensity from the observed OH 8–3 P2 7329.148 Å/OH 8–3 P1 7340.885 Å line ratio in standard star exposures.
Each emission line in the spectra from the nine apertures was corrected for the extended emission component by subtracting the corresponding emission measured in the appropriate extra-aperture (v1 to v4). Line intensities were then normalized to a particular H i recombination line present in each wavelength interval (H and H for the blue and red spectra, respectively). To produce a final homogeneous set of line intensity ratios, the red spectra were then rescaled to H using the theoretical H/H ratio I(H)/I(H) = 2.92 obtained for the physical conditions of = 7500 K and = 500 cm-3 (see Sect. 5.5).
| Aperture | |||||||||||
| A1 | A2 | A3 | A4 | A5 | A6 | A7 | A8 | A9 | |||
| Center position (arcsec) | 15.80 | 26.80 | 37.80 | 51.55 | 68.05 | 84.55 | 101.05 | 117.55 | 134.05 | ||
| Size (arcsec) | 11.0 | 11.0 | 11.0 | 16.5 | 16.5 | 16.5 | 16.5 | 16.5 | 16.5 | ||
| (Å) | Ion | Mult. | ()/(H) | ||||||||
| 3726.03 | [O ii] | 1F | 93.51.8 | 99.72.0 | 1062 | 1042 | 1042 | 1082 | 1172 | 1293 | 1503 |
| 3728.82 | [O ii] | 1F | 84.21.7 | 91.51.8 | 98.12.0 | 99.52.0 | 98.92.0 | 1032 | 1142 | 1202 | 1433 |
| 3835.39 | H i | H9(2) | 7.500.75 | 7.940.79 | 8.280.83 | 7.910.79 | 7.830.78 | 7.570.76 | 7.980.80 | 7.370.74 | 7.420.74 |
| 4068.60 | [S ii] | 1F | 1.580.32 | 1.800.36 | 1.860.37 | 2.430.49 | 2.700.54 | 3.300.66 | 3.840.77 | 4.770.95 | 5.630.56 |
| 4076.35 | [S ii] | 1F | 0.640.19 | 0.670.20 | 0.760.23 | 0.740.22 | 0.710.21 | 1.000.30 | 1.160.23 | 1.290.26 | 1.240.25 |
| 4101.74 | H i | H | 26.21.3 | 26.21.3 | 26.01.3 | 25.71.3 | 25.61.3 | 25.61.3 | 25.71.3 | 25.61.3 | 25.81.3 |
| 4340.47 | H i | H | 46.22.3 | 46.22.3 | 46.52.3 | 46.92.3 | 46.92.4 | 47.02.4 | 46.82.3 | 46.92.4 | 46.82.3 |
| 4471.09 | He i | 14 | 1.090.22 | 1.350.27 | 1.020.20 | 0.190.08 | — | — | — | — | — |
| 4861.33 | H i | H | 1002 | 1002 | 1002 | 1002 | 1002 | 1002 | 1002 | 1002 | 1002 |
| 4958.91 | [O iii] | 1F | 2.520.50 | 0.980.29 | 0.150.06 | — | — | — | 0.930.28 | 0.880.26 | 7.590.76 |
| 5006.94 | [O iii] | 1F | 7.860.79 | 2.780.56 | 0.250.10 | — | 0.350.14 | 0.130.05 | 2.780.56 | 3.060.61 | 25.421.27 |
| 6300.30 | [O i] | 1F | 0.640.03 | 0.640.03 | 0.600.03 | 0.860.04 | 1.050.05 | 1.300.06 | 2.470.12 | 3.500.17 | 5.390.27 |
| 6312.10 | [S iii] | 3F | 0.800.04 | 0.700.03 | 0.690.03 | 0.580.03 | 0.470.02 | 0.420.02 | 0.450.02 | 0.380.02 | 0.360.02 |
| 6548.03 | [N ii] | 1F | 36.311.82 | 38.41.9 | 41.32.1 | 41.82.1 | 42.02.1 | 44.22.2 | 45.72.3 | 50.21.0 | 54.11.1 |
| 6562.82 | H i | H | 292.005.84 | 2926 | 2926 | 2926 | 2926 | 2926 | 2926 | 2926 | 2926 |
| 6583.41 | [N ii] | 1F | 107.122.14 | 1132 | 1222 | 1232 | 1242 | 1303 | 1353 | 1483 | 1593 |
| 6678.15 | He i | 46 | 1.110.06 | 1.130.06 | 0.890.04 | 0.200.01 | — | — | — | 0.030.01 | 0.260.01 |
| 6716.47 | [S ii] | 2F | 18.790.94 | 20.21.0 | 22.21.1 | 25.81.3 | 29.41.5 | 36.91.8 | 42.32.1 | 49.12.5 | 58.81.2 |
| 6730.85 | [S ii] | 2F | 20.021.00 | 21.41.1 | 23.01.2 | 26.61.3 | 30.41.5 | 38.71.9 | 42.82.1 | 53.31.1 | 60.81.2 |
| 7065.28 | He i | 10 | 0.920.05 | 0.850.04 | 0.650.03 | 0.150.01 | — | — | 0.060.01 | 0.090.01 | 0.340.02 |
| 7135.78 | [Ar iii] | 1F | 2.900.14 | 2.660.13 | 1.700.08 | 0.310.02 | 0.030.01 | 0.030.01 | 0.190.01 | 0.240.01 | 1.160.06 |
| 7319.19 | [O ii] | 2F | 1.740.09 | 1.670.08 | 1.670.08 | 1.510.08 | 1.520.08 | 1.660.08 | 1.800.09 | 2.530.13 | 2.670.13 |
| 7330.20 | [O ii] | 2F | 1.460.07 | 1.410.07 | 1.340.07 | 1.240.06 | 1.260.06 | 1.390.07 | 1.500.08 | 2.070.10 | 2.200.11 |
| (H) | 0.600.09 | 0.490.08 | 0.510.05 | 0.750.06 | 0.760.06 | 0.790.07 | 0.770.06 | 0.730.06 | 0.990.07 | ||
| (H) | 1.50810-12 | 1.44310-12 | 1.18510-12 | 1.86110-12 | 1.77010-12 | 1.76510-12 | 1.27110-12 | 1.15010-12 | 7.13110-13 | ||
| ([O ii]) | 56050 | 52050 | 50040 | 44040 | 45040 | 45040 | 42040 | 51050 | 46040 | ||
| ([S ii]) | 650170 | 630170 | 570160 | 560150 | 560150 | 600160 | 520150 | 690140 | 58060 | ||
| ([O ii]) | 7850160 | 7600150 | 7360140 | 7260130 | 7270140 | 7420140 | 7440140 | 8070180 | 7810180 | ||
| ([O iii])(3) | 73601700 | 70001650 | 66601600 | — | — | — | — | — | — | ||
| He+/H+ | 10.440.02 | 10.450.03 | 10.340.03 | — | — | — | — | — | — | ||
| O+/H+ | 8.340.05 | 8.450.05 | 8.550.05 | 8.580.05 | 8.580.05 | 8.540.05 | 8.570.05 | 8.420.05 | 8.560.06 | ||
| O2+/H+ | 6.970.20 | 6.640.22 | 5.830.26 | — | — | — | — | — | — | ||
| N+/H+ | 7.630.04 | 7.700.04 | 7.780.04 | 7.800.04 | 7.800.04 | 7.800.04 | 7.810.04 | 7.730.04 | 7.810.04 | ||
| S+/H+ | 6.280.04 | 6.350.04 | 6.430.04 | 6.510.04 | 6.560.04 | 6.640.04 | 6.680.04 | 6.660.04 | 6.770.04 | ||
| S2+/H+ | 6.780.04 | 6.800.04 | 6.870.04 | 6.830.04 | 6.730.04 | 6.640.04 | 6.660.04 | 6.390.05 | 6.440.05 | ||
| Ar2+/H+ | 5.790.16 | 5.820.17 | 5.690.17 | — | — | — | — | — | — | ||
| O/H | 8.360.05 | 8.450.05 | 8.550.05 | 8.580.05 | 8.580.05 | 8.540.05 | 8.570.05 | 8.420.05 | 8.560.06 | ||
| N/H | 7.650.08 | 7.710.08 | 7.780.08 | 7.800.04 | 7.800.04 | 7.800.04 | 7.810.04 | 7.730.04 | 7.810.04 | ||
| S/H | 6.900.04 | 6.930.03 | 7.010.03 | 7.000.03 | 6.960.03 | 6.940.03 | 6.970.03 | 6.850.03 | 6.940.03 | ||
-
(1) The errors in the line fluxes refer only to uncertainties in the line measurements (see text). (H) in erg cm-2s-1; in cm-3; in K; ionic abundances in log (X+i/H+) + 12.
-
(2) Blended with He i 3833.57 line.
-
(3) ([O iii]) obtained using the empirical relation between ([O ii]) and ([O iii]) obtained from the data by García-Rojas & Esteban (2007) (see text).
5.3 Extinction correction
We assume the extinction law derived by Blagrave et al. (2007) for the Orion nebula. Both H ii regions have a deficiency in small particles that produces the relatively grey extinction observed in Orion (Magazzu et al., 1986; Baldwin et al., 1991). Furthermore, Rodríguez (1999, 2002) did not find large extinction variations in her optical spectroscopic studies of the M 42 and M 43 H ii regions.
The reddening coefficient, (H) was obtained by fitting the observed H/H and H/H line intensity ratios – the three lines lie in the same spectral range – to the theoretical ones computed by Storey & Hummer (1995) for = 7500 K and = 500 cm-3. As pointed out by Mesa-Delgado et al. (2009a, b), the use of a Blagrave et al. (2007) law instead of the classical one by Costero & Peimbert (1970) produces slightly higher (H) values and also slightly different dereddened line fluxes depending on the spectral range.
The final set of line intensities corrected for both the extended emission component and the extinction are indicated in Table 3.
5.4 Uncertainties
Several sources of uncertainties must be taken into account to obtain the errors associated with the line intensity ratios. We estimated that the uncertainty111111Although uncertainties in the line flux measurements depend on the line flux instead of on ()/(H), the similarity between the H flux measured in each aperture (see Table 3) makes this approach reasonable. in the line intensity measurement due to the signal-to-noise ratio of the spectra and the placement of the local continuum is typically
-
2% for ()/(H)0.5,
-
5% for 0.1 ()/(H) 0.5,
-
10% for 0.05 ()/(H) 0.1,
-
20% for 0.01 ()/(H)0.05,
-
30% for 0.005 ()/(H)0.01, and
-
40% for 0.001 ()/(H)0.005.
We did not consider any lines of weaker intensity than 0.001 (H). We note that then uncertainties indicated in Table 3 refer inly to this type of errors.
By comparing the resulting flux-calibrated spectra of one of our standard stars with the corresponding tabulated flux, we could estimate that the line ratio uncertainties associated with the flux calibration is 3% when the wavelengths are separated by 500 – 1500 Å and 5% if they are separated by more than that. Where the corresponding lines are separated by less than 500 Å, the uncertainty in the line ratio due to uncertainties in the flux calibration is negligible.
The uncertainty associated with extinction correction was computed by error propagation. The contribution of this uncertainty in the total error is again negligible when line ratios of close-by lines are considered (e.g. [S ii] 6716/[S ii] 6730). The final errors in the line intensity ratios used to derive the physical properties of the nebula were computed by quadratically adding these three sources of uncertainty.
5.5 Physical conditions
The electron temperature () and density () of the ionized gas were derived from classical CEL ratios, using the IRAF task temden of the package nebular (Shaw & Dufour, 1995) with updated atomic data for several ions (see García-Rojas et al., 2009). We computed from the [S ii] 6717/6731 and [O ii] 3729/3726 line ratios and from the nebular to auroral [O ii] (7320+30)/(3726+29) line ratio121212In the case of M 43, ([O ii]) is free of any contamination to [O ii] 7325 by recombination because of the low O 2+ abundance..
We could not directly determine ([O iii]) because the [O iii] 4363 auroral line was not detectedbecause of the low ionization degree of the nebula. As an alternative, we used a empirical relation between ([O iii]) and ([O ii]) obtained from the nebular information published by García-Rojas & Esteban (2007) for a sample of Galactic H ii regions131313The data for NGC3603, a giant Galactic H ii region, was discarded to obtain this relation.
| (2) |
This fit is almost identical to that obtained by Pilyugin et al. (2006) and Garnett (1992) for integrated spectra of giant extragalactic H ii regions and photoionization models of giant extragalactic H ii regions, respectively. We only computed ([O iii]) for the three innermost apertures. For more distant apertures, the O2+ emission (if any) is not associated to M 43 itself, but to the residual emission of the diffuse component (see Sects. 4 and 5.1).
The methodology used to determine the physical conditions was as follows: we assumed a representative initial value of of 10000 K and computed the electron densities. The value of was then used to compute ([O ii]) from the observed line ratios, and ([O iii]) from equation 2. We iterated until convergence to obtain the final values of and . Uncertainties were computed by error propagation. The final ([O ii]), ([S ii]), ([O ii]), ([O iii]) estimate, along with their uncertainties are indicated in Table 3.
In general, densities derived from the [O ii] line ratio are about 100 cm-3 lower than those derived from [S ii] lines, but consistent within the errors.
5.6 Chemical abundances
To derive He+/H+, we used two observed lines of He i at 4471 and 6678. Case B emissivities were taken from the collision less (low-density limit) calculations by Bauman et al. (2005) using an on line available code141414Available at http://www.pauKy.edu/rporter/j-resolved. The collisional-to-recombination contribution was estimated from Kingdon & Ferland (1995), using the interpolation formula provided by Porter et al. (2007). The effective recombination coefficients for H+ were taken from Storey & Hummer (1995)
Ionic abundances of N+, O+, O2+, S+, S2+ and Ar2+ were derived from CELs, using the IRAF task of the package . We assumed a two-zone scheme, in which we adopted ([O ii]) for the low ionization potential ions (N+, O+, S+ and S2+) and the value of ([O iii]) derived from Eq. 2 for the high ionization potential ions (O2+ and Ar2+). In both cases, we assumed ([O ii]) instead of ([S ii]) because the first indicator is more representative of the whole nebula, while ([S ii]) provides insight mostly into the density of the material close to the ionization edge of the nebula. For O2+, Ar2+, and He+, we only have available lines in the three innermost apertures. Owing to the low of the ionizing star, these relatively high ionization species are only present in regions very close to the star.
We then derived the total abundances of O, N, and S for each aperture151515Owing to the low ionization degree of M 43, the ionization correction factors for He+ and Ar2+ are large and very uncertain. We did not compute the total abundances for these two elements.. As a consequence of the low ionization degree of the nebula, M 43 has a very small amount of O2+ in comparison with the dominant species, O+, except in the innermost zones where a non-negligible fraction of O2+ is present. We note that for the intermediate apertures (apertures 4 to 6), the O abundance is given by O+/H+. In the case of S, the abundance of this element is given by the sum of S+ and S2+, because S+3 is not expected to be present in this nebula. Similarly to O2+, N2+ is only expected to be present in the innermost parts of the nebula. For the corresponding apertures (1 – 3), we applied the classical ionization correction factor (ICF) scheme of N (i.e. N+/O+=N/O) to correct for the N2+ abundance (note that this correction is very small). As for O, for the intermediate apertures the N abundance is directly obtained from the N+ abundance.
The ionic abundances of He+ O+, O2+, N+, S+, S2+, and Ar2+, along with the total abundances of O, N, and S are shown in Table 3. We stress again that in this nebula the total abundances of O, N, and S can be obtained directly from observable ions (no ICFs are needed) from the intermediate apertures.
5.7 Comparison of O, N, and S abundances derived in M 43 and the Orion nebula
Given that the ionized gas from both nebulae, M42 and M43, comes from the same molecular cloud, it is reasonable to assume that both have very similar total abundances. In this section, we compare the O, S, and N abundances obtained from our study of M 43 with those determined by García-Rojas & Esteban (2007, GRE07, an update of Esteban et al. 2004) and Simón-Díaz & Stasińska (2010, SDS10) from the analysis of the nebular spectrum of the Orion nebula. Table 4 summarizes the final abundances indicated in the three studies. We note that GRE07, and SDS10 present analyses of the same spectroscopic dataset, but use different atomic data and ICFs. Our study of M 43 uses the same atomic data as that considered by GRE07.
5.7.1 Oxygen
For this element, where the total abundance is obtained directly from observable ions (O + and O ++O 2+ in the case of M 43 and M 42, respectively), good agreement is found within the errors.
5.7.2 Nitrogen
| Element | M 43 | M 42 (GRE07) | M 42 (SDS10) |
|---|---|---|---|
| O | 8.570.05 | 8.540.03 | 8.520.01 |
| S | 6.970.03 | 7.040.04 | 6.870.04 |
| N | 7.800.04 | 7.730.09 | 7.900.09 |
For this element, GRE07 and SDS10 evaluate different values. This discrepancy is caused by the assumed ICF(N+). While GRE07 obtained this ICF from the widely used empirical relation N+/O+=N/O, SDS10 determined the ICF from a model fitted to the data of M 42 (including a detailed description of the ionizing SED of Ori C predicted by the stellar atmosphere code WM-basic, Pauldrach et al., 2001). The GRE07 and SDS10 abundances differ by 0.17 dex. Interestingly, our determination for M 43, in which no ICF is needed produces an intermediate value, and is in perfect agreement with the B-type stars abundance derived by Nieva & Simón-Díaz (2011). This introduces a new important constraint on the nebular CEL/RL abundance conundrum (Simón-Díaz & Stasińska, 2010).
5.7.3 Sulphur
GRE07 and SDS10 derive different values (0.17 dex difference) of the total S abundance in M 42. In this case, the cause of the difference is not, however, the assumed ICF, but the use of different sets of atomic data. Both computations considered the same data for the collision strength (Keenan et al., 1996; Tayal & Gupta, 1999), but different transition probabilities: while GRE07 based their calculation in data from Mendoza & Zeippen (1982a, b) for [S ii] and [S iii], respectively, SDS10 used Froese Fischer (2004) and Froese Fischer & Tachiev (2004) values. For M 43, we obtained 12 + log(S/H)=6.970.04 using the same set of atomic data as GRE07. This value is slightly lower, but in agreement within the errors, than the determination by GRE07, and somewhat higher than the value provided by SDS10. The influence of the atomic data considered for this element is hence relevant.
5.8 Comparison with previous studies of M 43
The only nebular abundance studies found in the literature for M 43 are those of Rodríguez (1999, 2002), who analyzed long-slit optical spectroscopic data for five different slit positions along the nebula, deriving the physical conditions ( and ), and O, S, Cl, N, Ar, He, C, and Fe abundances of the nebular gas. O’Dell & Harris (2010) analyzed a set of optical spectrophotometric observations of M 43 as part of a more general study of the EON, and derived the physical conditions of the nebula. We note that none of these observations were corrected for the diffuse emission component as in our study.
For consistency, we reanalyzed the data of Rodríguez (1999) using the same atomic data as in our work. We obtained ([N ii]) between 7800 K and 8000 K for slit positions similar to ours. O’Dell & Harris (2010) obtained very similar results (([N ii]) between 7780 K and 7940 K) from several aperture extractions of a slit that crosses the nebula in the east-west direction. Both authors derived ([S ii]) 500-600 cm-3, which is very similar to the value derived in this work.
We compared our abundances with those resulting from the reanalysis161616The observations by O’Dell & Harris (2010) do not include [O ii]3727, 7325 lines, hence the determination of the oxygen abundance is not possible. of the observational dataset by Rodríguez (1999). The derived O abundances are 0.14 – 0.23 dex lower than those resulting from the analysis of our spectra. As we indicate in Sect. 5.9, this effect is produced by the contamination of the M 43 emission by the diffuse component.
Finally, we compared our estimated ([O ii]) with previous determinations from radio continuum observations. Subrahmanyan (1992) derived =9000 1700 K by combining 330 MHz and 10.7 GHz continuum observations and a model of an isothermal H ii region; Mills & Shaver (1968) estimated a value of 8000 K from 408 MHz continuum observations; finally, Thum et al. (1978) derived a much lower 6700 K from the HI 91 radio recombination line to continuum ratio. In general, the different estimates, except for Thum et al., agree within the uncertainties.

5.9 Scattered nebular light from the EON affecting the spectrum of M 43?
O’Dell & Goss (2009) and O’Dell & Harris (2010) demonstrated that scattered light from the bright Huygens Region of M 42 can affect the physical conditions derived from emission lines in the EON. O’Dell & Harris (2010) performed a detailed spectroscopic study of several zones of the EON, including the M 43 region. These authors could not find conclusive evidence of signatures of scattered light from the Huygens region affecting the nebular emission from M 43 (except for the case of an aperture located in the M 43 dark lane). Our study (based on more detailed observational dataset) allowed us to observationally prove that there is an extended diffuse emission not produced by ionization of the surrounding material by NU Ori affecting the whole nebula.
To investigate whether this extended emission relates to scattered light from the Huygens region, we compare in Fig. 9 (upper panel) the non-extinction-corrected H/H and H/H line ratios with (C) and without (NC) correction for diffuse emission for apertures from A1 to A9. The H/H line ratio is more affected than H/H. This is consistent with the diffuse extended emission being produced by dust scattered light, a well-know property of this type of emission is that blue lines are more affected than red lines. An additional argument supporting this hypothesis is presented in the bottom panel of Fig. 9. The value of the He i 7065/6678 ratio, obtained from the NC spectra of M 43 outside the He + Strömgen sphere associated with NU Ori agrees with the associated average value in the Huygens region taken from the data of O’Dell & Harris (2010)171717We considered extractions corresponding to slits 2 to 15 that are labeled as ”inner”..
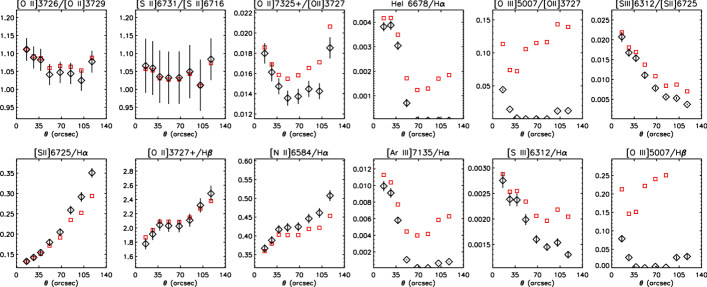
We also investigated the effect that scattered light contaminating the spectrum of M 43 has on line ratios used to determine the physical conditions and chemical abundances (as well as constraints of the photoionization models presented in Paper II). Fig. 10 shows several line ratios obtained from the C and NC spectra. Although the effect is negligible for the density constraints and the S + and O + abundance indicators, the influence of scattered light on the ionization structure constraints and the He +, N +, Ar , S , and O 2+ abundance indicators is not negligible (especially in the outer parts of the nebula). In addition, as already pointed out by O’Dell & Harris (2010), our comparison identifies an important effect on ([O ii]). If the scattered light contribution is not removed, the spectroscopic analysis overestimates the and hence underestimates of the abundances.
To quantitatively illustrate this effect on the computed physical conditions and abundances, we present in Table 5 the results of two empirical analyses of the C and NC spectra from apertures 4 and 5. We also compare the result of the analysis of the NC integrated spectrum (extracting the global long slit spectra). As pointed out before, is basically similar but the NC spectra result in a higher and, consequently lower abundances. In particular, ionic abundances can be affected by 0.05 – 0.15 dex.
An adequate correction of the scattered light contribution in the spectra of M 43 is hence important for a reliable empirical analysis of the nebular spectra of this H ii region.
| Uncorrected | Corrected | Uncorrected | ||||
| A4 | A5 | A4 | A5 | Total Slit | ||
| (cm-3) | [O ii] | 475 | 485 | 440 | 450 | 510 |
| [S ii] | 560 | 565 | 560 | 560 | 600 | |
| (K) | [O ii] | 7650 | 7700 | 7260 | 7270 | 7900 |
| [O iii] | — | — | — | — | 7450 | |
| (X+i) | O+ | 8.45 | 8.44 | 8.58 | 8.58 | 8.38 |
| O++ | — | — | — | — | 7.45 | |
| N+ | 7.71 | 7.70 | 7.80 | 7.80 | 7.66 | |
| S+ | 6.42 | 6.46 | 6.51 | 6.56 | 6.42 | |
| S++ | 6.77 | 6.70 | 6.83 | 6.73 | 6.69 | |
| Ar++ | — | — | — | — | 5.64 | |
| (X) | O | 8.50 | 8.49 | 8.58 | 8.58 | 8.43 |
| N | 7.75 | 7.75 | 7.80 | 7.80 | 7.71 | |
| S | 6.93 | 6.90 | 7.00 | 6.96 | 6.88 | |
-
(1) , ionic, and total abundance values are based on the assumption =([O ii]) as discussed in Sect. 5.6.
6 Summary and conclusions
M 43 is a close-by, bright H ii region of simple geometry, ionized by a single star. These characteristics makes M 43 an ideal object for investigating several topics of interest in the field of H ii regions and massive stars.
In a series of two papers, we present a combined, comprehensive study of
the nebula and its ionizing star using as many observational constraints
as possible. In this first part of the study, we have introduced the observational
dataset, obtained the stellar parameters of HD 37061, obtained useful information
from the nebular images, and analyzed the nebular spectra
extracted from apertures located at various distances from the central star.
All this information is then used in Paper II to construct a customized
photoionization model of the nebula.
In this paper, we have found observational evidence of a diffuse and extended emission in the region where M 43 is located that is not associated to material ionized by HD 37061. Our nebular observations have allowed us to ascertain the most likely origin of this emission (e.g. O’Dell & Goss, 2009; O’Dell & Harris, 2010, and references therein), namely that light emitted in the Huygens region (the central, brightest part of the Orion nebula) is scattered by dust. We have also shown the importance of an adequate correction of this scattered light from the imagery and spectroscopic observations of M 43 to a proper determination of the total nebular H luminosity, the nebular physical conditions, and chemical abundances. In particular, we illustrated that an overestimate of by 400 – 500 K, hence an underestimate of abundances by 0.05 – 0.10 dex, result from the empirical analysis of our spectroscopic dataset when the spectra are not corrected for the scattered light contribution. In addition, the derived total nebular H luminosity may be overestimated by a factor 1.5.
The quantitative analysis of the optical spectrum of HD 37061 with the stellar atmosphere code FASTWIND lead to = 31000500 K, log g = 4.20.1, and log Q(H0) = 47.2 0.2 (assuming a distance of 400 pc).
The analysis of the H and H images indicate a non-constant extinction distribution within the nebula that is well correlated with the dust features indicated by Smith et al. (1987). Once the H image is corrected for extinction and diffuse emission, a total nebular H luminosity of (3.01.1) x 1035 erg s-1 is obtained. This value is compatible with the ionizing flux of the star, implying that the nebula is (mostly) ionization bounded.
We extracted nine apertures from a long-slit located to the west of HD 37061 (east-west direction) to obtain the spatial distribution of the nebular physical conditions (temperature and density) and ionic abundances (He +, O +, O 2+, N +, S +, S 2+, Ar 2+). Since it is important to correct these spectra for the contribution of scattered light from the Huygens region, we also consider two apertures outside the nebula that are used for this aim.
For sulfur, oxygen, and nitrogen, we have been able to determied total abundances directly from observable ions (no ICFs are needed). The derived abundances, 8.57 0.05, 6.97 0.03, and 7.80 0.04, respectively, are compared with previous determinations in the Orion nebula. Although an overall agreement is found, our study illustrates the importance of the atomic data and, specially in the case of M 42, the considered ICFs.
Acknowledgements.
SSD acknowledges the funds by the Spanish Ministerio de Educación y Ciencia under the MEC/Fullbright postdoctoral fellowship program. SSD, JGR, CE, and ARLS acknowledge finantial support by the Spanish MICINN under projects AYA2008-06166-C03-01 and AYA2007-63030. SSD also acknowledges financial support from UNAM/DGAPA PAPIIT IN 112708 (IP: M. Peña) and CONACyT J49737 (IP: C. Morisset) and the members of the Instituto de Astronomía, UNAM for their warm hospitality. JGR acknowledges the support of an UNAM postdoctoral grant. Part of this work was done while CM in sabbatical at IAC founded by CONACyT and PASPA-UNAM grants. This work has also been partially funded by the Spanish MICINN under the Consolider-Ingenio 2010 Program grant CSD2006-00070: First Science with the GTC.References
- Abt et al. (1991) Abt, H. A., Wang, R., & Cardona, O. 1991, ApJ367, 155
- Asplund et al. (2009) Asplund, M., Grevesse, N., Sauval, A. J., & Scott, P. 2009, ARA&A, 47, 481
- Bauman et al. (2005) Bauman, R. P., Porter, R. L., Ferland, G. J., & MacAdam, K. B. 2005, ApJ, 628, 541
- Baldwin et al. (1991) Baldwin, J. A., Ferland, G. J., Martin, P. G., Corbin, M. R., Cota, S. A.; Peterson, B. M., Slettebak, A. 2007, ApJ, 374, 580
- Blagrave et al. (2007) Blagrave, K. P. M., Martin, P. G., Rubin, R. H., Dufour, R. J., Baldwin, J. A., Hester, J. J., & Walter, D. K. 2007, ApJ, 655, 299
- Costero & Peimbert (1970) Costero, R., & Peimbert, M. 1970, Boletin de los Observatorios Tonantzintla y Tacubaya, 5, 229
- Esteban et al. (2004) Esteban, C., Peimbert, M., García-Rojas, J., Ruiz, M. T., Peimbert, A., & Rodríguez, M. 2004, MNRAS, 355, 229
- Ferland (1999) Ferland, G. J. 1999, PASP, 111, 1524
- Froese Fischer (2004) Froese Fischer 2004, http://hf8.vuse.vanderbilt.edu
- Froese Fischer & Tachiev (2004) Froese Fischer C., Tachiev G., 2004, ADNDT, 87, 1
- García-Rojas & Esteban (2007) García-Rojas, J., & Esteban, C. 2007, ApJ, 670, 457
- García-Rojas et al. (2009) García-Rojas, J., Peña, M., & Peimbert, A. 2009, A&A, 496, 139
- Garnett (1992) Garnett, D. R. 1992, AJ, 103, 1330
- Goudis (1982) Goudis, C. 1982, Astrophysics and Space Science Library, 90
- Gray (1976) Gray, D. F. 1976, The Observation and analysis of stellar photosferes. National Research Council of Canada. New York, Wiley-Interscience
- Hänel (1987) Hänel, A. 1987, A&A, 176, 347
- Herrero et al. (2002) Herrero A., Puls J., Najarro F. 2002, A&A, 396, 949
- Hillenbrand (1997) Hillenbrand, L. A. 1997, AJ, 113, 1733
- Jeffries (2007) Jeffries, R. D. 2007, MNRAS, 376, 1109
- Keenan et al. (1996) Keenan F. P., Aller L. H., Bell K. L., Hyung S., McKenna F. C., Ramsbottom C. A., 1996, MNRAS, 281, 1073
- Khallesse et al. (1980) Khallesse, B., Pallister, W. S., Warren-Smith, R. F., & Scarrott, S. M. 1980, MNRAS, 190, 99
- Kingdon & Ferland (1995) Kingdon, J. & Ferland, G. J. 1995, ApJ, 442, 714
- Landolt & Uomoto (2007) Landolt, A.U. & Uomoto, A.L. 2007, AJ, 133, 768
- López-Sánchez & Esteban (2008) López-Sánchez, Á.R.& Esteban, C. 2008, A&A, 491, 131
- Luridiana et al. (2009) Luridiana, V., Simón-Díaz, S., Cerviño, M., González Delgado, R. M., Porter, R. L., Ferland, G. J. 2009, ApJ, 691, 1712
- Magazzu et al. (1986) Magazzu, A.; Baratta, G. A.; Strazzulla, G. 1986, New Insights in Astrophysics. Eight Years of UV Astronomy with IUE, ESA. Ed. E. J. Rolfe, 559
- Mendoza & Zeippen (1982a) Mendoza C., Zeippen C. J., 1982a, MNRAS, 198, 127
- Mendoza & Zeippen (1982b) Mendoza C., Zeippen C. J., 1982b, MNRAS, 199, 1025
- Menten et al. (2007) Menten, K. M., Reid, M. J., Forbrich, J., Brunthaler, A. 2007, A&A, 474, 515
- Mesa-Delgado et al. (2009a) Mesa-Delgado, A., López-Martín, L., Esteban, C., García-Rojas, J, & Luridiana, V. 2009, MNRAS, 394, 693
- Mesa-Delgado et al. (2009b) Mesa-Delgado, A., Esteban, C., García-Rojas, J, Luridiana, V., Bautista, M., Rodríguez, M., López-Martín, L., Peimbert, M. 2009, MNRAS, 395, 855
- Mills & Shaver (1968) Mills, B. Y. Shaver, P. A. 1968, Australian Journal of Physics, 21, 95
- Nieva & Simón-Díaz (2011) Nieva, M. F., Simón-Díaz, S. 2011, A&A, submitted
- O’Dell & Goss (2009) O’Dell, C. R., Goss, W. M. 2009, AJ, 138, 1235
- O’Dell & Harris (2010) O’Dell, C. R., Harris, J. A. 2010, AJ, 140, 985
- Pauldrach et al. (2001) Pauldrach, A. W. A., Hoffmann, T. L., & Lennon, M. 2001, A&A, 375, 161
- Pilyugin et al. (2006) Pilyugin, L. S., Vílchez, J. M., & Thuan, T. X. 2006, A&A, 370, 1928
- Porter et al. (2007) Porter, R. L., Ferland, G. J., & MacAdam, K. B. 2007, ApJ, 657, 327
- Preibisch et al. (1999) Preibisch, T., Balega, Y., Hofmann, K.-H., Weigelt, G., Zinnecker, H. 1999, New Astronomy, 7, 531
- Puls et al. (2005) Puls, J., Urbaneja, M. A., Venero, R., et al. 2005, A&A, 435, 669
- Repolust et al. (2004) Repolust, T., Puls, J., Herrero, A. 2004, A&A, 415, 349
- Rodríguez (1999) Rodríguez M. 1999, A&A, 351, 1075
- Rodríguez (2002) Rodríguez M. 2002, A&A, 389, 556
- Sandstrom et al. (2007) Sandstrom, K. M., Peek, J. E. G., Bower, G. C., Bolatto, A. D., Plambeck, R. L. 2007, ApJ, 667, 1161
- Santolaya-Rey et al. (1997) Santolaya-Rey, A. E., Puls, J., & Herrero, A. 1997, A&A, 323, 488
- Shaw & Dufour (1995) Shaw, R. A., & Dufour, R. J. 1995, PASP, 107, 896
- Simón-Díaz et al. (2006) Simón-Díaz, S., Herrero, A., Esteban, C., & Najarro, F. 2006, A&A, 448, 351
- Simón-Díaz & Herrero (2007) Simón-Díaz, S., & Herrero, A. 2007, A&A, 468, 1063
- Simón-Díaz & Stasińska (2010) Simón-Díaz, S. & Stasińska, G. 2010, A&A, 526, 48
- Smith et al. (1987) Smith, J., Harper, D. A., Loewenstein, R. F. 1987, ApJ, 314, 76
- Subrahmanyan (1992) Subrahmanyan, R. 1992, MNRAS, 254, 291
- Storey & Hummer (1995) Storey, P. J., & Hummer, D. G. 1995, MNRAS, 272, 41
- Tayal & Gupta (1999) Tayal S. S., Gupta G. P., 1999, ApJ, 526, 544
- Thronson et al. (1986) Thronson, H. A. Jr., Harper, D. A., Bally, J. et al. 1986, AJ, 91, 1350
- Thum et al. (1978) Thum, C., Lemke, D., Fahrbach, U., & Frey, A. 1978, A&A, 65, 207