Goonhilly: a new site for e-MERLIN and the EVN
Abstract:
The benefits for the e-MERLIN and EVN arrays of using antennae at the satellite communication station at Goonhilly in Cornwall are discussed. The location of this site - new to astronomy - will provide an almost equal distribution of long baselines in the east-west- and north-south directions, and opens up the possibility to get significantly improved observations of equatorial fields with e-MERLIN. These additional baselines will improve the sensitivity on a set of critical spatial scales and will increase the angular resolution of e-MERLIN by a factor of two. e-MERLIN observations, including many allocated under the e-MERLIN Legacy programme, will benefit from the enhanced angular resolution and imaging capability especially for sources close to or below the celestial equator (where ESO facilities such as ALMA will operate) of including the Goonhilly telescopes. Furthermore, the baselines formed between Goonhilly and the existing stations will close the gap between the baselines of e-MERLIN and those of the European VLBI Network (EVN) and therefore enhance the legacy value of e-MERLIN datasets.
1 Introduction
Half a century ago, visionary engineers and scientists designed and built the world’s first satellite communication station choosing Goonhilly in Cornwall as its location (lat=50.0504 North, lon = 5.1835 West). Since then, Goonhilly has pioneered many of the advances in global communication and inspired budding scientists and engineers. Now in 2011, most needs for satellite and tele-communications are met by using a combination of smaller antennae and undersea cables, and there are plans afoot to use Goonhilly’s valuable assets for a variety of new purposes including radio astronomy. There are three 30-m-class telescopes at Goonhilly, and two of these could straightforwardly be adapted for radio astronomy. Goonhilly-1 (or ”Arthur”) can be most easily incorporated into e-MERLIN as its design was based on the Jodrell Bank MKII Telescope that is already a mainstay of the network. Goonhilly-3 (or ”Guinevere”) is perhaps a more suitable Goonhilly antenna to use for higher-frequency (especially K-band) observations.
Assuming that the chosen antennae can be outfitted with standard e-MERLIN L-, C- or K-band receivers, and connected to the eighth ”spare” input of the correlator (information on e-MERLIN can be found via http://www.e-merlin.ac.uk), the improvements that the addition of a Goonhilly antenna would bring to the enhanced array performance, and consequently the scientific return of the e-MERLIN Legacy observing programmes, are discussed.
2 Including Goonhilly and using the Lovell Telescope in the e-MERLIN array
The imaging capability of an interferometer is related to the distribution of its antennae and their individual sensitivities. Here the UV plane and imaging benefits are discussed if a ”Goonhilly” antenna111Note that in addition to the already mentioned telescopes at the Goonhilly side there is another 30-m-class telescope (Goonhilly 6) available. If all three 30-m-class telescopes could be phased up then the equivalent of a 50-m-class telescope could be delivered by Goonhilly resources. is included in the e-MERLIN array and if the Lovell Telescope (LT) is used.
2.1 UV plane benefits
Generally the angular resolution of an interferometer is determined by the longest ”projected” baseline (the value of which [in radians] is approximately , for which is the observing wavelengh and b is the length of the longest baseline, see e.g. Rohlfs & Wilson 2004). With its current setup, e-MERLIN has a maximum baseline of 217 km which provides an angular resolution of 170 milli-arcsec (mas) at L-band. Introducing one of the telescopes at Goonhilly would increase the maximum baseline to 440 km, thus doubling the angular resolution of e-MERLIN, bringing it to values of 82 mas, 17 mas, and 6 mas at L-, C- and K-band respectively.
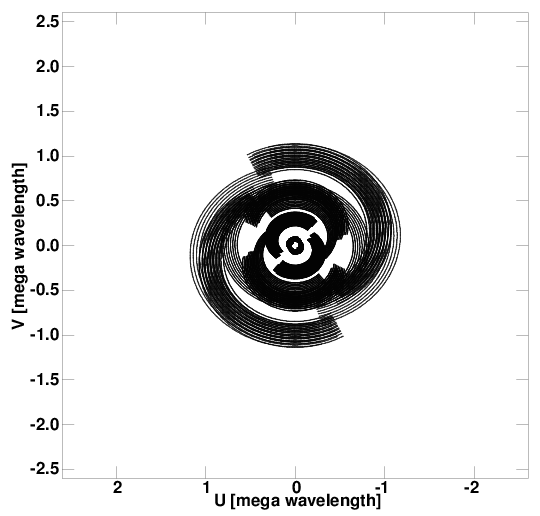
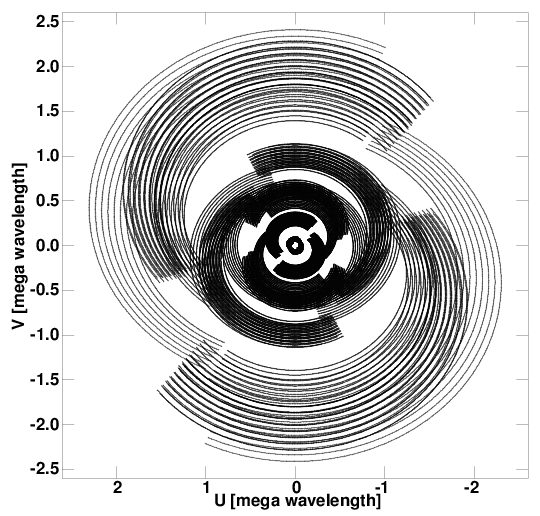
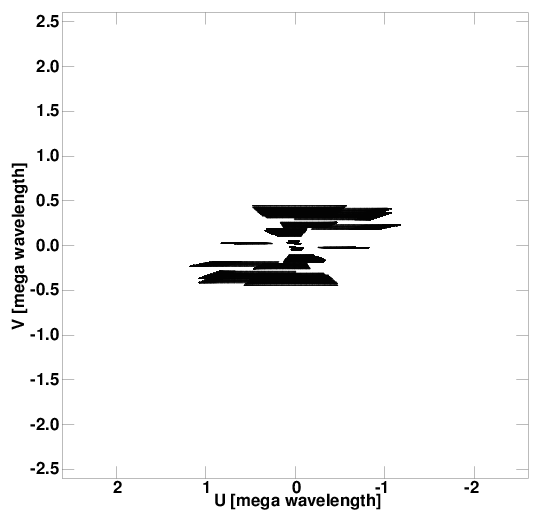
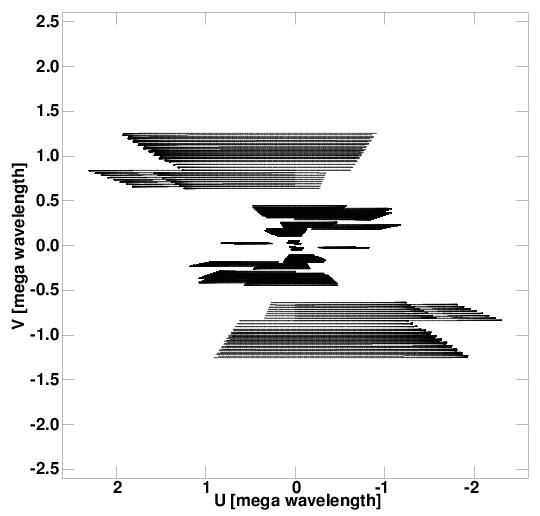
Figure 1 affords a more detailed view on the improved imaging capabilities, showing the L-Band UV coverages of e-MERLIN and e-MERLIN including Goonhilly at two different declinations (60 and 0). The UV coverage is based on a 12-hour synthesis222The UV coverages are derived from an array simulation using the AIPS task UVCON.. For L-band observations the e-MERLIN bandwidth will be of the order of 400 MHz (1.3–1.7 GHz), which is simulated as 8 channels of 50 MHz bandwidth each. At 60 declination the UV coverage is circularly symmetric and would almost fully cover all spatial frequencies up to the longest baselines. Due to the location of Goonhilly the array would have almost equally long east-west and north-south baselines, symmetrically extending the UV-coverage by a factor of 2. Such a configuration would significantly improve the snap-shot imaging capability with respect to the current e-MERLIN configuration. As the declination of an observation moves towards zero the UV coverage becomes increasingly ”squashed” in the north-south direction, which results in an elongated synthesized beam333The UV coverage and synthesised beams are directly coupled in that they are Fourier transforms of one another.. This is a direct result of having ”projected” baselines which directly influences the imaging capability of the e-MERLIN interferometer. For example, a 12-hour observation on the celestial equator and using uniform weighting would result in angular resolutions of 320 mas140 mas for e-MERLIN, and 140 mas72 mas with the additional station at Goonhilly. For further discussion on equatorial imaging using e-MERLIN and telescopes located in Chilbolton and in Goonhilly see Heywood et al. (2008, 2011).
In order to fully exploit such UV coverage new wide-band imaging algorithms must be used. Properly accounting for sources which are morphologically complex and exhibit components with different spectral indices is a major challenge for calibration and imaging. This is not the case for spectral line observations during which the UV coverage advantage gained by multi-frequency synthesis is lost, as each spectral channel will only occupy a narrow region of the UV plane.
2.2 The image sensitivity
Adding a new antenna into an existing array provides enhanced imaging sensitivity and depending on its location it will potentially enhance the spatial sensitivity by adding baselines that traces new sets of spatial scales. Here some basic radio astronomy relationships are presented in order to quantify such benefits.
The baseline sensitivity [in units of Jy] at a single polarisation in the real or the imaginary component of the visibility formed between antennas and is given by:
| (1) |
where is an efficiency term accounting for losses due to digitisation of the signal for correlation, is the system temperature of antenna or respectively [K], and for example is the antenna sensitivity (where ; is the antenna efficiency, is the geometrical area [m2], and is the Boltzmann constant), is the integration time per visibility [s], and is the bandwidth [Hz]. In order to detect a single source, and therefore to calibrate or self-calibrate the data, a sensitivity of 5 is required within the coherence time (Walker 1989). A practical measure of the coherence time is the averaging time at which the scalar- and the vector-averages of the phases or the amplitudes are significantly different (e.g. the amplitude vector average is calculated by and the amplitude scalar average via , where indicate the time averages and and are the real and imaginary component of the visibilities).
The imaging sensitivity [Jy] is closely related to the baseline sensitivity and for an inhomogeneous array can be determined via:
| (2) |
where is the number of polarisation products and is now the total on-source time. In case of a homogeneous array the image sensitivity is given by: , where N is the number of antennae, SEFD is the system equivalent flux density, which is defined by SEFD = . For a full discussion on the derivation of the above equations see Walker (1989) and Wrobel & Walker (1999).
For a basic estimate of the relative improvement in imaging sensitivity the following L-band SEFDs are considered: Lovell Telescope 36 Jy, MKII Telescope 350 Jy, and 220 Jy for the Telescope in Cambridge (these SEFDs are provided in the EVN status table). For all other antennae in the array a SEFD of 350 Jy is assumed. In this case the image sensitivity of e-MERLIN will improve by a factor of 1.9 if the Lovell Telescope is used instead of the MKII Telescope. Furthermore, comparing e-MERLIN including the Lovell Telescope and Goonhilly with e-MERLIN and the MKII Telescope shows an even higher imaging sensitivity of a factor of 2.1 or equivalently allows a reduction in the observing time by a factor of 4.4. An equal sensitivity improvement is expected for C-band observations, because the antennae have similar SEFD values. For K-band observations this situation changes significantly; the effect of adding sensitivity with the Goonhilly Telescopes is of importance and of the order of 20%, as neither the Lovell nor the Defford Telescopes cannot operate at these frequencies. Note that these sensitivity improvements are valid for both continuum and spectral line observations.
In addition, to the imaging sensitivity is the spatial sensitivity of the additional baselines formed by the antennae in Goonhilly. The baselines in the triangle Jodrell-Bank-Cambridge-Goonhilly would build the most sensitive part of the e-MERLIN array and is particular important when the Lovell Telescope is included to increase the long-baseline sensitivity.
2.3 e-MERLIN and the European VLBI Network (EVN)
The combination of e-MERLIN and EVN observations provide a unique view of the nuclear composition of extragalactic sources. The broad range of baselines within the combined datasets correspondingly probe a broad range of important linear size scales in extragalactic sources, from kilo- to (sub-)parsec.
With the anticipated imaging sensitivities of e-MERLIN normal galaxies, starburst galaxies, radio quiet quasars, and hybrid AGN-starburst galaxies will be observable at high redshifts and with mas resolution. It is of vital importance to disentangle the nuclear composition of these galaxies e.g. in order to determine the AGN contribution to the total radio luminosity (Klöckner et al. 2009). However there is observational evidence that radio emission can be missed between the baselines of the EVN and e-MERLIN. For example, observations of the AGN-starburst system J123642621331 at redshift z=4.424 (Muxlow et al. 2005, Garrett et al. 2001) show that the radio flux density does not change from arcsecond to subarcsecond resolution between the baselines provided by the WSRT (489 Jy), the VLA-A (467 Jy), and the MERLIN (472 Jy) arrays, but it clearly changes at the higher EVN resolution (248 Jy). The missing-flux effect is not only seen in continuum observations; it has also been noted for spectral line emission, e.g. for the OH Megamaser emission in Mrk 273 (Yates et al. 2000, Klöckner & Baan 2004).
Currently the only method available to compensate for such an effect is to perform EVN observations which include the Lovell/MKII and the Cambridge Telescopes from the e-MERLIN array. Obviously the time available to be allocated to such projects is rather limited. If such an observation is not possible, the only option one has is to combine both datasets by scaling the visibilities according to the Effelsberg - Westerbork baseline (270 km) and the MERLIN flux. In practice, the scaling factor is determined via the flux density in the image plane and applied to both datasets before combination (e.g. via the AIPS task DBCON). Such a technique is only reliable if the source structure is close to a point source. However if the target source exhibits more complicated structure the reliability of such combined MERLIN (or in future e-MERLIN) and EVN data sets is questionable.
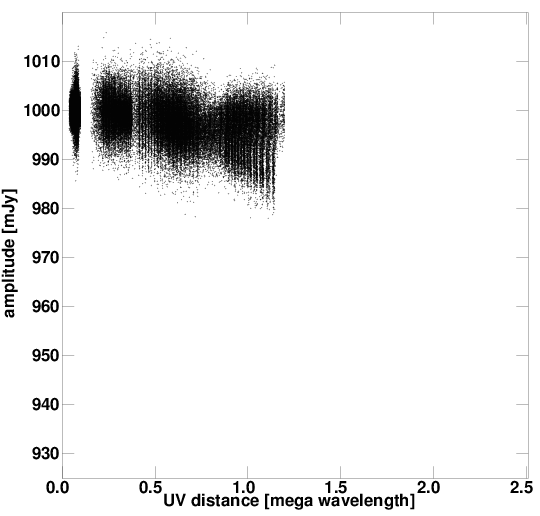
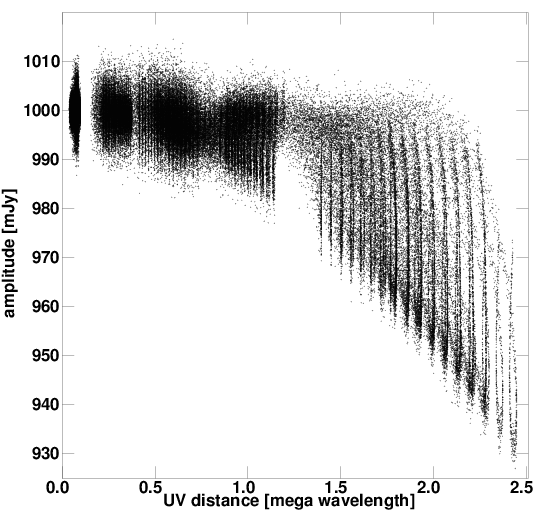
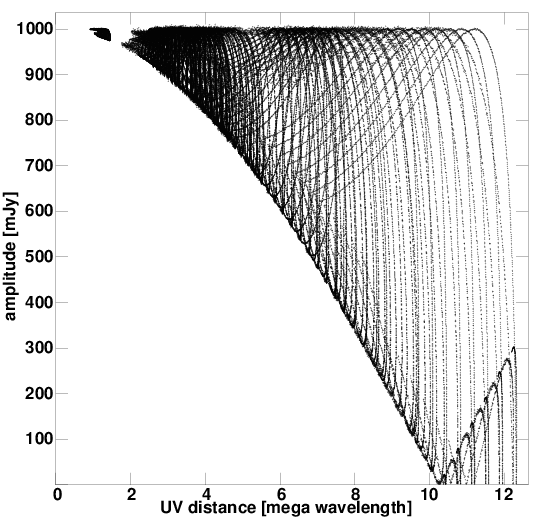
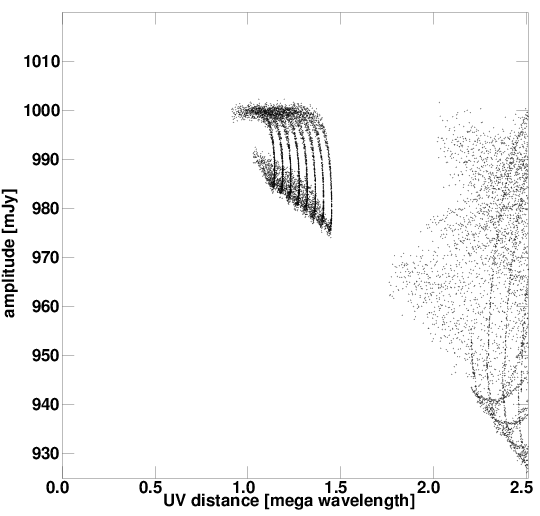
Figure 2 illustrates the potential dangers of ill-defined flux density measurement in both arrays. These amplitude versus UV-distance plots are based on e-MERLIN and EVN simulations of two point sources separated by 9 mas and with a flux density of about 0.5 Jy each. Such a model would not be resolved by e-MERLIN as shown in the top left-hand plot of Figure 2, but when Goonhilly is added to the array the source structure is detected by the additional baselines. Furthermore, comparing the e-MERLIN simulation with those of the EVN shows that there is hardly any overlap of the visibilities in UV-distance. This spread in amplitude due to the source structure will make it impossible to reliably model the datasets. However, including a station at Goonhilly would allow reliable modeling and cross-matching of the flux density at 1 M to 2.5 M scale sizes. Crucially, the baselines would fill the gap in the EVN data and therefore provide new structural information444Note that once the focal plane array program in Westerbork (APERTIF) is installed (by 2012) the C-Band sensitivity of the Effelsberg-Westerbork baseline drops and roughly equals the sensitivity of the baseline between the Lovell Telescope and Goonhilly.. Once APERTIF is installed at the WSRT it would be of particular importance if one of the Goonhilly antennae would be included to the EVN observing session. Such setup would provide an almost uniform structural sensitivity and would be ideal for the ”the world’s leading real-time VLBI array” that is compiled by the EVN telescopes (Szomoru et al. 2011).
The location of Goonhilly seems to be ideal in order to produce better snap-shot imaging quality than is currently possible with e-MERLIN. Furthermore, the baselines formed between Goonhilly and Jodrell Bank, and Goonhilly and Cambridge (440 km) provide a unique structural probe at 120 mas, which translates to kilo-parsec scales at redshift 1. In addition, the new baselines formed by the Goonhilly station will ensure that data from e-MERLIN can at all times be reliably combined with EVN datasets due to the overlap in baseline lengths. As discussed previously this will afford a totally unique view of radio emission from galactic scales (10 km baseline Jodrell Bank to Pickmere) to the central regions of galaxies.
3 Impact on Legacy proposals
The e-MERLIN Legacy programme consists of eleven projects which spans a wide range of astrophysical themes and will address many current challenges in astronomy and astrophysics. In particular, the projects build a coherent set of surveys that addresses key questions in star/planetary system formation, in radio outflow/jet physics, in the interplay between accreting black holes and nuclear starbursts, and galaxy/AGN evolution. The data products generated by the Legacy programmes will be made available for exploitation by the whole astronomical community.
Here a general overview of the basic observational requirements of these programmes is given. The quoted hours are the allocated hours for the proposals and not the proposed ones. The benefits in imaging sensitivity of including the Lovell Telescope (LT) in the array is discussed. Furthermore, the enhanced angular resolution brought by including a telescope at Goonhilly (GH) is discussed. The e-MERLIN Legacy programmes and their basic requirements are:
-
•
Astrophysics of GAlaxy Transformation and Evolution (PI’s: C. Simpson, I. Smail):
- L-Band, targeted imaging (single pointings), 330 hours.
- The LT is not considered due to FoV limitations, but the increased angular resolution due to GH enables the study of the radio morphology at 500 pc scales (an average redshift of 0.5 is assumed). -
•
The e-MERLIN Cyg OB2 RAdio Survey: Massive and Young stars in the Galaxy (PI: R. Prinja):
- L-Band, C-Band, several pointings to mosaic, multiple epochs at C-band, 294 hours.
- Using the LT allows the detection of some 50 O stars, whereas without it only the most massive stars can be observed, thus biasing the sample substantially. The enhanced angular resolution provided by GH provides a better base to detect positional changes in order to study the kinematics of the OB association. -
•
MERLIN Galaxy Evolution Survey (PI’s: T. Muxlow, I. Smail, I. McHardy):
- L-band, C-band, single pointings and field mapping/mosaicing, (Tier 0 and Tier 1) 918 hours.
- The science goals rely on reliably measuring the structural information of the radio sources and to disentangle extended star-formation from compact AGN. The imaging sensitivity is crucial to this project therefore the LT needs to be considered. In addition, the increased angular resolution provided by GH will help to better explore the nuclear region at linear scales of 660 pc (L-band) and 140 pc (C-band) respectively (assuming redshift 1). -
•
e-MERLIN Pulsar Interferometry Project (PI: W. Vlemmings, B. Stappers):
- L-band, C-band, targeted imaging, visibility fitting, astrometry, multiple epoch, 160 hours.
- The LT is considered for special cases, there are FoV restrictions in L-band due to in-beam calibrators. The basic observable for astrometry is the position on the sky and with the enhanced angular resolution provided by GH such measurements will have an enhanced accuracy of a factor of 2. -
•
Feedback Process in Massive Star Formation (PI: M. Hoare, W. Vlemmings):
- C-band; targeted imaging, spectral line imaging of methanol- and hydroxyl, full polarisation, 450 hours.
- The LT is crucial for this project in order to test various star formation models. The enhanced angular resolution due to GH provide better constrains on how to relate the radio outflow to the spectral lines and therefore will provide important clues on the origin of the spectral line emission. -
•
Gravitational Lensing and galaxy evolution with e-MERLIN (PI: N. Jackson, S. Serjeant):
- L-band , C-band, targeted imaging, 228 hours.
- Central images of lenses probe the central (10-50 pc) part of the potential well of lens galaxies at significant cosmological distance. GH baselines will add sensitivity on spatial scales well-matched to the problem, allowing detection of fainter central images; the LT is important in adding sensitivity. Inclusion of GH/LT will also be important in high-fidelity mapping both of existing radio lenses and new lenses discovered with Herschel ATLAS, which is also part of the project. Many of these lenses are small (¡1 arcsecond), and at low declination, and in both cases GH baselines are a major advantage. -
•
Legacy e-MERLIN Multi-Band Imaging of Nearby Galaxies (PI: R. Beswick, I. McHardy):
- L-band, C-band, targeted imaging, line data mining considered, 810 hours.
- The aim is to map out radio star-formation indicators in nearby galaxies, such as HII regions and supernova remnants (SNR), and to carry out a census of low luminosity AGN. Without the LT the investigation is biased to the nearest and brightest sources making the survey neither complete nor representative. The enhanced angular resolution provided by GH will help to map out sub-structures at pc scales to better constrain the nature of such indicators and will help distinguish unresolved AGN from starburst activity. -
•
Luminous Infra-Red Galaxy Inventory (PI: J. Conway, M. Perez-Torres):
- L-band, C-band, targeted imaging, line imaging, multiple epoch, full polarisation, 353 hours.
- The LT is considered necessary to match the sensitivity in polarisation and to detect a substantial rate of RSNe in the most extreme starburst environments. Due to the compactness of the RSNe the enhanced angular resolution by GH will provide a better constraint on the nature of the detected radio emission. -
•
Morphology and Time Evolution of Thermal Jets Associated with Low Mass Young Stars (PI: L. Rodriguez):
- C-band, targeted imaging, multiple epoch, 180 hours.
- The LT is needed to detect the hollow-core and the optically thin outer regions of the stellar jets and hence lead to a fundamental understanding on the disk-jet relation. GH will provide a better estimate on the proper motion of the sources. -
•
Planet Earth Building Blocks - a Legacy e-MERLIN Survey (PI: J. Greaves):
- C-Band, targeted imaging, 72 hours.
- Only with the LT is e-MERLIN able to detect the cm dust emission on a few AU scales for the first time. The improved resolution with GH will better constrain the planet-forming zones and allow dust detections of a few Earth-masses. -
•
Resolving Key Questions in Extragalactic Jet Physics (PI: R. Laing):
- L-band, C-band, targeted imaging, multi epoch, full polarisation, 375 hours.
- For a sub-sample the LT is considered, without Lovell the observable sub-sample would more than halve and hence would not be representative. The increase in angular resolution by GH (80 pc L-Band and 16 pc for C-band at redshift 0.05) may be too high to investigate the radio sub-structure of the closest sources of the sample, but for the other targets the additional resolution will help to better investigate the study of radio structure.
Of the 11 Legacy projects, 9 require the additional sensitivity provided by the Lovell Telescope. Apart from the great advantage in imaging sensitivity there are some observing constraints due to the field of view (FoV) limitation mentioned in the proposals, which precludes the use of the Lovell Telescope. In particular, for in-beam calibration the smaller FoV of the Lovell Telescope with respect to that of the MKII Telescope will reduce the number of suitable calibrators. In addition, there is a trade off between the mapping speed and the sensitivity, such that the mosaicing efficiency might be reduced if Lovell Telescope is included in e-MERLIN.
At least 10 out of 11 proposals seem to accrue significant benefit from the enhanced resolution provided by Goonhilly. Except for a sub-program in one proposal the Legacy programmes will greatly benefit from this factor 2 increase in spatial resolution, in particular providing additional constraints on source structure, better positional constraints of radio components for multi-epoch observations, and improved astrometry. In addition to the above points many breakthroughs in these and other areas of science will come from the combination of e-MERLIN and EVN data. The much improved overlap of baselines provided by Goonhilly (Figure 2) will be critical for reliably achieving this combination, particularly for line observations where multi-frequency synthesis cannot be used to improve the UV coverage.
Finally, it should be noted that the existence of Goonhilly and the opportunity to access southern fields (below Dec 30) in e-MERLIN may mean that several of the Legacy programmes may wish to re-asses their selection of targets or survey locations to benefit from overlap with the ESO facilities such as ALMA or VISTA.
4 Conclusions
The addition of an antenna at Goonhilly to the e-MERLIN array provides a near-doubling of the spatial resolution and an improved UV-plane coverage. The increased N-S extent also has strong positive imaging implications for equatorial imaging with the e-MERLIN array. The very sensitive 440 km baseline that would be formed between Goonhilly and the Lovell Telescope would result in rich enhancements of the e-MERLIN Legacy surveys, roughly doubling the overall imaging sensitivity and tripling the long-baseline sensitivity. Finally, the Goonhilly station provides a unique overlap in baseline lengths between e-MERLIN and the EVN, allowing robust combination of data from the two instruments. Such combined data sets are unique and open up the ability to study radio morphologies from kilo-parsec up to parsec scales.
References
- [1] M.A. Garrett, M.A., et al., 2001, A&A, 366, L5
- [2] I. Heywood, H.-R. Klöckner, S. Rawlings, 2008, in ”Cosmology, Galaxy Formation and Astroparticle Physics on the Pathway to the SKA”, eds. H.-R. Klöckner, S. Rawlings, M. J. Jarvis, A. Taylor, astro-ph\0801.2037
- [3] I. Heywood, H.-R. Klöckner, S. Rawlings, 2011, in ”Astronomy with megastructures: Joint science with the E-ELT and SKA”, eds. I. Hook, D. Rigopoulou, S. Rawlings, A. Karastergiou, astro-ph\1103.1214
- [4] H.-R. Klöckner, W. A. Baan, 2004, A&A,419, 887
- [5] H.-R. Klöckner, A. Martínez-Sansigre, S. Rawlings, M. A. Garrett, 2009, MNRAS, 398, 176
- [6] T.W.B. Muxlow, et al., 2005, MNRAS, 358, 1194
- [7] K. Rohlfs, T.L. Wilson, 2000, Tools of Radio Astronomy (Astronomy and astrophysics library: Springer)
- [8] A. Szomoru, et al., 2011, PoS(10th EVN Symposium) 035
- [9] R. C. Walker 1989, in Very long Baseline Interferometry, eds. M. Felli and R. E. Spencer (Dordrecht: Kluwer), 163
- [10] J. M. Wrobel, R. C. Walker 1999, in Synthesis Imaging in Radio Astronomy II, eds. G. B. Taylor, C. L. Carilli, R. A. Perly (ASP Conference Series Vol. 180), 171
- [11] J. A. Yates, et al., 2000, MNRAS, 317, 28