Liquid-liquid critical point in supercooled silicon
A novel liquid-liquid phase transition has been proposed and investigated in a wide variety of pure substances recently, including water, silica (major components of the earth’s crust), the technologically important element silicon, and others marked by energetically stabilized tetrahedral local geometries. From computer simulations using a classical empirical potential (the Stillinger-Weber potential), Sastry and Angell sastry_angell_si demonstrated a first order liquid-liquid transition in supercooled silicon, supported by further experimental and simulation studies subsequently. Here, we report evidence for a critical point to the liquid-liquid phase transition at negative pressures, from computer simulations using the SW potential. Compressibilities, evaluated from the equation of state and fluctuations in constant pressure-temperature simulations exhibit a growing maximum upon lowering temperature below and isotherms exhibit density discontinuities below , at negative pressure. Below , isotherms obtained from constant volume-temperature simulations exhibit non-monotonic, van der Waals-like behavior signaling a first order transition. We identify , as the critical temperature and pressure for the liquid-liquid critical point. The structure of the liquid changes dramatically upon decreasing the temperature and pressure. Diffusivities vary over 4 orders of magnitude, and exhibit anomalous pressure dependence near the critical point. A strong relationship between local geometry quantified by the coordination number, and diffusivity, is seen, suggesting that atomic mobility in both low and high density liquids can usefully be analyzed in terms of defects in the tetrahedral network structure. We have constructed the phase diagram of supercooled silicon. We identify the lines of compressibility, density extrema (maxima and minima) and the spinodal which reveal the interconnection between thermodynamic anomalies and the phase behaviour of the system as suggested in previous works speedy_angell ; speedy_conjecture ; debenedetti_spinodal_anomalies1 ; poole_water ; sastry_singularityfree ; stanley_mishima ; debene2009 ; saika_voivod_silica .
The possibility of a phase transition between two forms of the liquid phase in some pure substances has attracted considerable interest and research activity in recent years sastry_angell_si ; speedy_angell ; speedy_conjecture ; poole_water ; stanley_mishima ; debene2009 ; saika_voivod_silica . Among the substances investigated are water poole_water ; stanley_mishima ; debene2009 , silica saika_voivod_silica and silicon sastry_angell_si ; aptekar ; donovan ; deb_sli_exp ; helder_lsi_exp ; borick ; ashwin ; Ganesh_FPMD_si , germanium, carbon and hydrogen – these substances together form a very significant component of our natural world, living organisms, and technology. A phenomenon common to these is therefore of wide general interest. As illustrated in kurita_fluidity , further, liquid-liquid transitions offer an avenue for interesting applications by exploiting the different properties of distinct liquid phases.
Although the liquid-liquid transition was discussed in the context of silicon aptekar somewhat earlier, the considerable current interest stems from various proposals for understanding the anomalies of water speedy_conjecture ; poole_water ; sastry_singularityfree ; stanley_mishima ; debene ; chen_confined_water ; caa_critfree . These scenarios have alternately invoked the approach to a spinodalspeedy_conjecture , a liquid-liquid critical pointpoole_water ; stanley_mishima , general thermodynamic constraints without the presence of any singular behaviorsastry_singularityfree , and the presence of a transition without a critical pointcaa_critfree , in rationalizing experimentally observed behavior. In spite of substantial investigations, a general consensus is yet lacking on the interpretation of observed behavior debene ; caa_critfree . In particular, recent experiments on confined water chen_confined_water and issues surrounding their interpretation caa_critfree indicate the need to ascertain the existence of a critical point even when sufficient evidence exists for a liquid-liquid transition.
The possibility of a transition in supercooled silicon was suggested donovan based on estimates of excess Gibbs free energies of amorphous and liquid silicon, implying a “amorphous-liquid” phase transition near K (below the freezing point of the liquid, 1,685 K). Clear evidence of a transition between two liquids in the supercooled region was shown in sastry_angell_si from molecular dynamics simulations using Stillinger-Weber (SW) potential still_weber_pot . A first order transition at zero pressure was found at = K, substantially below the experimental estimate. However, recent electrostatic levitation experiments performed down to do not find evidence for a transition kelton . Apart from the uncertainties in the experimental value, such a difference may be expected to arise from the neglect in the empirical potential of significant changes in the electronic structure associated with structural change ashwin ; Ganesh_FPMD_si , though first principles simulations Ganesh_FPMD_si appear to confirm the transition temperature obtained from the classical simulations. The exact location of the transition must thus be viewed as tentative at present.
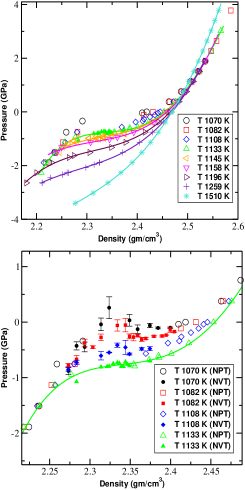
In the present work, we use molecular dynamics (MD) simulations using the SW potential for silicon to locate the liquid-liquid critical point, and show that it lies at negative pressures. We perform constant pressure, temperature (NPT) and constant volume, temperature (NVT) simulations of atoms, using protocols described in Methods. Pressure vs. density isotherms generated in the temperature range of to , and the pressure range of to using NPT simulations are shown in Fig. 1 (top panel). The isotherms for temperatures above are continuous, but develop an inflection below which becomes more pronounced as temperature is lowered. The compressibility develops a maximum in this temperature range, which grows as the temperature is lowered. Below , careful constant pressure simulations always result in a jump in the density as pressure is varied, suggesting a first order transition. To verify this further, we perform NVT simulations for in the density range where NPT simulations show a jump. These results are shown in the bottom panel of Fig. 1. We find that at these temperatures, the isotherms are non-monotonic. Such non-monotonicity in simulations arises from metastability on the one hand, and on the other hand, incomplete phase separation owing to finite sample sizes in the unstable region, and constitutes a clear indication of a first order transition. Thus, our equation of state data show isotherms with growing compressibility maxima as temperature is decreased (above ) and first order transitions (below ) between two liquids, the high density liquid (HDL) and the low density liquid (LDL). We thus deduce that the critical point to be located between these temperatures. Inspection of Fig. 1 (bottom panel) also makes it clear that the critical pressure must be negative. Based on the above data at the temperatures simulated, we estimate the location of the critical point to be at , . A more precise estimation of critical parameters require analysis, including finite size scaling, which is beyond the scope of the present paper but are being pursued as extensions of the present work.
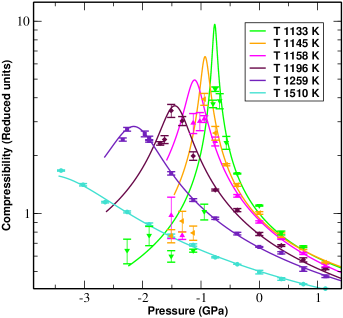
Approaching the critical point from above leads to increased density fluctuations. In addition to evaluating the compressibility from the equation of state (EOS), we also calculate it directly from density fluctuations. These are shown in Fig. 2 for temperatures above which show good agreement with EOS estimates for the high density liquid (HDL), but poorer agreement for the low density liquid (LDL). The high crystallization rates observed near and at lower pressures than the compressibility maxima hamper improved sampling (however we report results only from equilibrated runs). The influence of fluctuations and local structure (see below) on nucleation rates daan1 ; daan2 is an intersting issue that is presently being investigated.
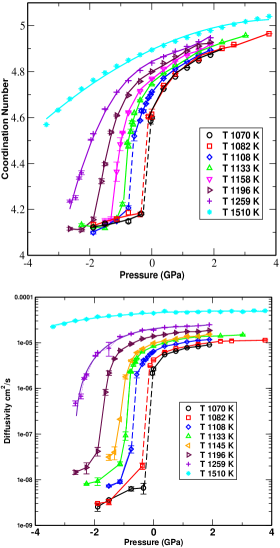
Next we describe briefly the temperature and density dependence of diffusivities and average coordination number , which captures important information regarding structural change. , the number of neighbors of an atom is calculated by integrating the pair correlation function up to its first minimum. In Fig. 3 (top panel) is shown as a function of pressure. At high temperatures and pressures, is about , and decreases as temperature and pressure are lowered, showing discontinuous change below , and values close to the tetrahedral value of () in the LDL, similar to the observation at zero pressure in sastry_angell_si .
Diffusivities vs. pressure for the studied temperatures are shown in (Fig. 3 - bottom panel), which increase with pressure for all the temperatures shown, in analogy with the well known anomaly in water. Like the coordination number, diffusivities show a discontinuity below , with a jump of roughly two orders of magnitude from HDL to LDL. The diffusivities span a range of over four orders of magnitude.
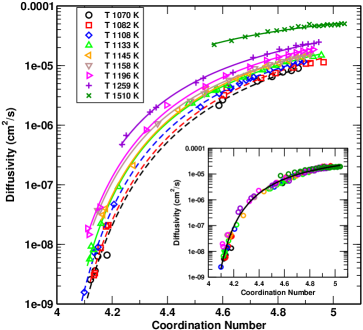
In Fig. 4, we show the diffusivities plotted against coordination number . Except at the highest temperature studied, we find the dependence of on to be remarkably similar irrespective of temperature, including those below the critical temperature. The mobility of atoms therefore is very strongly determined by the local structure. This observation is consistent with previous analysis of the role of “bifurcated bonds” or the “fifth neighbor” in determining molecular mobility in water sciortino_mobility . It is tempting to speculate that apart from trivial thermal effects, a universal dependence exists of atomic mobility on the average number of neighbors in excess of the tetrahedral value of . To test this possibility, we show in the inset of Fig. 4 a scaled plot of , by normalizing to its value at a fixed in the HDL phase for all temperatures. The data collapse is indeed remarkable and the resulting master curve can be well fit to a Vogel-Fulcher-Tammann (VFT) form, with . Further analysis of this interesting observation is in progress.
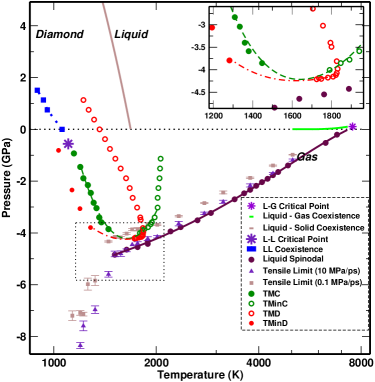
Previous studies of the phase behavior of water and other liquids exhibiting density anomalies have analyzed the interplay of various loci of extremal behavior, namely the spinodal, lines of density maxima (TMD) speedy_conjecture , density minima (TMinD) denmin , compressibility minima (TMinC) and maxima (TMC). To obtain a comprehensive picture of the phase behavior of liquid silicon, we have evaluated these loci, employing in addition to the MD simulations, parallel tempering (PT) and restricted ensemble (REMC) Monte Carlo simulations corti_remc for locating the spinodal (details and data are provided in the supplementary information (SI)) at low temperatures. As shown in Figure 5, the spinodal we estimate is monotonic in pressure vs. temperature , ie not “reentrant” as predicted to be the case speedy_conjecture if it intersects with the TMD. The TMD, however, changes slope upon intersection with the TMinC, as analyzed in sastry_singularityfree . Evaluating the relevant equation of state data is particularly challenging in this case as the TMD approaches the spinodal very closely, while not intersecting it. From available data, it appears that the TMinC will join smoothly with the TMC (line of compressibility maxima) that emanates from the liquid-liquid critical point. Interestingly, we find from PT simulations below the critical temperature and pressure that there exists also a line of density minima, very recently observed in the case of water in experiments and computer simulations denmin . The TMD and the TMinD appear to smoothly join with each other, as required by thermodynamic consistency.
At low temperatures (), even REMC simulations (which restrict density fluctuations) cavitate at sufficiently low pressure. In these cases, we estimate the spinodal by a quadratic extrapolation of the isotherms. As a further check on our spinodal estimate, we perform simulations to obtain tensile limits by increasing the tensile pressure on the simulation cell at constant rates, for two different rates (0.1 and 10.0 MPa/ps). For the faster rate, we find tensile limits that are consistent with the spinodal estimates we have, while for the slower rate, the system cavitates at higher pressures, remaining nevertheless monotonic vs. temperature. These simulations also extend our estimate of the spinodal to lower temperatures, and indicate a marked downturn of the spinodal pressure below the temperatures we have studied.
In conclusion, we have performed extensive molecular dynamics and Monte Carlo simulations of supercooled liquid silicon using the SW potential to find evidence for a negative pressure liquid-liquid critical point. We estimate the location of the critical point to be at , . We have computed the phase diagram of supercooled liquid silicon. We find no retracing of spinodal. The phase behaviour of silicon is similar to that observed in simulations of water and silica. The structure of the liquid changes dramatically in going from high temperatures and pressures to low temperatures and pressures. Diffusivities vary by more than 4 orders of magnitude, and exhibit anomalous pressure dependence. A strong relationship between local geometry quantified by the coordination number and diffusivity is seen, suggesting that atomic mobility in both low and high density liquids can usefully be analyzed in terms of defects in the tetrahedral network structure.
Methods :
We perform Molecular Dynamics (MD), with a time step of 0.383 fs, with details as in sastry_angell_si , but employing an efficient algorithmshibu_sw for energy and force evaluations. NVT simulations employ the LAAMPS lammps parallelised MD package. PT and REMC Monte Carlo simulations are described in the SI.
In the HDL phase, a mininum of 3 to 6 independent samples are simulated for relaxation times ( ). In the LDL phase, crystallisation (monitored by energy jumps, mean square displacement (MSD) and pair correlation function) rates are high. We perform around 10 to 50 initial runs, each of ns. Noncrystallizing samples (average of 5) were run up to 10 relaxation times when possible. In all LDL cases, simulations were carried out for times required for the MSD to reach (5 , where is the atomic diameter) or for (300 million MD steps), whichever is larger.
Equilibration is monitered by the MSD and the overlap function Q(t), defined as , where = , if , zero otherwise. We evaluate relaxation times () by fitting to a stretched exponential function. As an indication of its variation, varies at in the HDL from ps (T = K) to ns (T = K) and in LDL phase at T = K, the is around ns.
We calculate the compressibility from the EOS using:
Polynomial fits to isotherms are used in calculating the derivatives. We also calculate from volume fluctuations (NPT simulations) using:
The latter method is computationally very demanding, and the comparison between the two reveals degree to which sampling is satisfactory. In HDL the two estimates of agree very well, but in LDL, below the maximum, the deviations between the two indicate that sampling in LDL is not sufficient to obtain from fluctuations.
References
- (1) Sastry S, Angell CA (2003) Liquid-Liquid phase transition in supercooled silicon. Nature Materials 2:739-743.
- (2) Speedy RJ, Angell CA (1976) Isothermal compressibility of supercooled water and evidence for a thermodynamic singularity at -45o. C. J. Chem. Phys. 65:851–858.
- (3) Speedy RJ (1982) Stability-Limit Conjecture. An Interpretation of the Properties of Water J. Phys. Chem. 86:982–991.
- (4) Debenedetti PG, D‘Antonio MC (1985) On the nature of the tensile instability in metastable liquids and its relationship to density anomalies. J. Chem. Phys. 84:3339-3345.
- (5) Poole PH, Sciortino F, Essmann U, Stanley HE (1992) Phase behaviour of metastable water. Nature 360:324-328.
- (6) Sastry S, Debenedetti PG, Sciortino F, Stanley HE (1996) Singularity-free interpretation of the thermodynamics of supercooled water. Phys. Rev. E. 53:6144-6154.
- (7) Mishima O, Stanley HE (1998) Decompression-induced melting of ice IV and the liquid-liquid transition in water. Nature 392:164-168.
- (8) Liu, Y, Panagiotopoulos AZ, and. Debenedetti, PG (2009) Low-temperature fluid-phase behavior of ST2 water. J. Chem. Phys. 131:104508(1)-104508(7).
- (9) Saika-Voivod I, Sciortino F, Poole PH (2000) Computer simulations of liquid silica: Equation of state and liquid-liquid phase transition. Phys. Rev. E. 63:011202(1)-011202(9).
- (10) Aptekar L I (1979) Phase transitions in noncrystalline germanium and silicon. Soviet Physics Doklady 24:993-995.
- (11) Donovan, E. P., Spaepen, F., Turnbull, D., Poate, J. M. and Jacobson, D. C. Calorimetric studies of crystallisation and relaxation of amorphous Si and Ge prepared by ion implantation. J. Appl. Phys. 57, 1795 – 1804 (1985).
- (12) Deb S K, Wilding M, Somayazulu M, McMillan P F (2001) Pressure-induced amorphization and an amorphous-amorphous transition in densified porous silicon. Nature 414:528-530.
- (13) Hedler A, Klaumünzer S L, Wesch W (2004) Amorphous silicon exhibits a glass transition. Nature Materials 3:804-809.
- (14) Angell CA, Borick S, Grabow M (1996) Glass transitions and first order liquid-metal-to-semiconductor transitions in 4–5–6 covalent systems. J. Non-Cryst. Solids 205–207:463–471.
- (15) Ashwin SS, Waghmare UV, Sastry S (2004) Metal-to-Semimetal Transition in Supercooled Liquid Silicon. Phys. Rev. Lett. 92: 175701.
- (16) Ganesh P, Widom M (2009) Liquid-Liquid Transition in Supercooled Silicon Determined by First-Principles Simulation. Phys Rev Lett 102:075701-1075701-4.
- (17) Kurita R, Murata KI, Tanaka H (2008) Control of fluidity and miscibility of a binary liquid mixture by the liquid-liquid transition. Nature Materials 7:647-652.
- (18) Debenedetti PG (2003) Supercooled and glassy water. J. Phys.: Condens. Matter 15 R1669–R1726.
- (19) Mallamace F, Broccio M, Corsaro C, Faraone A, Majolino D, Venuti V, Liu L, Mou CY, Chen SH (2007) Evidence of the existence of the low-density liquid phase in supercooled, confined water. Proc. Natl. Acad. Sci. USA 104:424-428.
- (20) Angell CA (2008) Insights into Phases of Liquid Water from Study of Its Unusual Glass-Forming Properties. Science 319:582-587.
- (21) Stillinger FH, Weber TA (1985) Computer simulation of local order in condensed phases of silicon. Phys. Rev. B. 32:5262-5171.
- (22) Kim, T H et al (2005) In situ High-Energy X-Ray Diffraction Study of the Local Structure of Supercooled Liquid Si. Phys. Rev. Lett. 95:085501.
- (23) ten Wolde PR, Frenkel D (1997) Enhancement of Protein Crystal Nucleation by Critical Density Fluctuations. Science 277: 1975-1978.
- (24) Ghiringhelli LM, Valeriani C, Meijer EJ, Frenkel D (2007) Local Structure of Liquid Carbon Controls Diamond Nucleation. Phys. Rev. Lett. 99:055702.
- (25) Voronin G, Pantea C, Zerda T, Wang L, Zhao Y (2003) In situ x-ray diffraction study of silicon at pressures up to 15.5 GPa and temperatures up to 1073 K. Phys. Rev. B. 68:020102-1-020102-4.
- (26) Sciortino F, Geiger A, Stanley HE (1991) Network defects and molecular mobility in liquid water. J. Chem. Phys. 96:3857-3865.
- (27) Dazhi Liu D et al (2007) Observation of the density minimum in deeply supercooled confined water. Proc. Natl. Acad. Sci (USA) 104: 9570–9574.
- (28) Corti DS, Debenedetti PG (1994) A Computational Study of Metastability in Vapor-Liquid Equilibrium. Chem. Eng. Sci. 49:2717-2734.
- (29) Saw S, Ellegaard NL, Kob W, Sastry S (2009) Structural Relaxation of a Gel Modeled by Three Body Interactions. Phys. Rev. Lett. 103:248305.
- (30) Plimpton S (1995) Fast parallel algorithms for short-range molecular dynamics. J. Comput. Phys. 1-19.
Figure Captions
Figure 1: Equation of state. (top panel) Plot of pressure against density isotherms from NPT simulations. Isotherms for are continuous, and the lines through the data points are polynomial fits used to obtain the compressibility. For , the isotherms show an inflection, corresponding to a compressibility maximum. For , the isotherms show a density discontinuity signaling a first order transition. The crossing of isotherms at positive pressures reflects the presence of density maxima. (bottom panel) Pressure vs. density below the critical point from NPT (open symbols) and NVT (filled symbols) simulations. Pressures from NVT simulations below exhibit non-monotonic behavior at intermediate densities indicating a phase transition, while matching with pressures from NPT simulation at high, low densities. The critical temperature lies between and .
Figure 2: Compressibility maxima increase with decrease in temperature. Compressibilities vs. pressure for different temperatures from NPT simulations. The lines show calculated from the derivative of the pressure along isotherms and the symbols show calculated from volume fluctuations. The maximum value of increases as temperature decreases, indicating an approach to a critical point.
Figure 3: Coordination number and Diffusivity. (top panel) Plot of coordination number against pressure for different temperatures obtained from NPT simulations. In HDL, the is around five and in LDL it approaches four, corresponding to tetrahedral local structure. (bottom panel) Plot of diffusivity against pressure for different temperatures. is calculated from the mean square displacement, and shows a dramatic drop of over two orders of magnitude as the liquid transforms from HDL to LDL.
Figure 4: Relationship between structure and dynamics. Plot of diffusivity against coordination number at different temperatures. Lines through the data points are guides to the eye, and highlight the remarkably similar dependence of on at all temperatures including those below the critical temperature where both and change discontinuously. (inset) Plot of (scaled to match at ) vs. , showing data collapse. The line is a Vogel-Fulcher-Tammann (VFT) fit, with a coordination number of vanishing diffusivity .
Figure 5: Phase Diagram in PT plane. The pressure-temperature phase diagram showing the location of (a) the liquid-crystal phase boundary voronin , (b) the liquid-gas phase boundary and critical point, (c) the liquid-liquid phase boundary and critical point, (d) the liquid spinodal (e) the tensile limit obtained from two different increasing tensile pressure at two different rates, (f) the density maximum (TMD) and minimum (TMinD) lines, and (g) the compressibility maximum (TMC) and minimum (TMinC) line. Lines joining TMD and TMinD (dot-dashed), TMC and TMinC (dashed) are guides to the eye. (inset) Enlargement of box in main panel showing that TMD and spinodal lines do not intersect.
Figures