Quantum phase transitions in attractive extended Bose-Hubbard Model with three-body constraint
Abstract
The effect of nearest-neighbor repulsion on the ground-state phase diagrams of three-body constrained attractive Bose lattice gases is explored numerically. When the repulsion is turned on, in addition to the uniform Mott insulating state and two superfluid phases (the atomic and the dimer superfluids), a dimer checkerboard solid state appears at unit filling, where boson pairs form a solid with checkerboard structure. We find also that the first-order transitions between the uniform Mott insulating state and the atomic superfluid state can be turned into the continuous ones as the repulsion is increased. Moreover, the stability regions of the dimer superfluid phase can be extended to modest values of the hopping parameter by tuning the strength of the repulsion. Our conclusions hence shed light on the search of the dimer superfluid phase in real ultracold Bose gases in optical lattices.
pacs:
67.85.Hj, 75.40.Mg, 05.70.FhSpectacular progress both in theories and experiments has recently been made on ultracold atomic and molecular gases in optical lattices. Owing to the remarkable control over physical parameters, ultracold gases offer opportunities to simulate the physics of strongly correlated systems in regimes which are not easily accessible to solid-state materials. As a result, they provide very clean and tunable systems in the search for exotic quantum phases and in probing quantum critical behaviors around these phases. BEC_reviews For instance, successful experimental realization of the superfluid-Mott transition for ultracold bosons in an optical lattice BEC_exps has paved the way for studying other strongly correlated phases in various lattice models.
Very recently, it was suggested that intriguing quantum critical behaviors could occur in attractive bosonic lattice gases with three-body on-site constraint. Diehl10 ; Lee10 The on-site constraint can arise naturally due to large three-body loss processes, Daley09 ; Roncaglia10 and it stabilizes the attractive bosonic systems against collapse. Such three-body constrained systems can be realized also in Mott insulating states of ultracold spin-one atoms at unit filling. Mazza10 As found by the authors in Ref. Diehl10, , a dimer superfluid (DSF) phase consisting of the condensation of boson pairs can be realized under sufficiently strong attraction. According to their analysis, the transitions between the DSF phase and the conventional atomic superfluid (ASF) state are proposed to be of Ising-like at unit filling and driven first-order by fluctuations via the Coleman-Weinberg mechanism Coleman-Weinberg at other fractional fillings. Later investigation focuses on the nature of the superfluid-insulator transitions. Lee10 It is shown that, while the Mott-insulator (MI) to DSF transitions are always of second order, the continuous MI-ASF transitions can be preempted by first-order ones and interesting tricritical points can thus appear on the MI-ASF phase boundaries. The conclusions obtained in Refs. Diehl10, and Lee10, are partly supported by a recent numerical study employing stochastic series expansion (SSE) quantum Monte Carlo (QMC) method implemented with a generalized directed loop algorithm. Bonnes11 In particular, the existence of a tricritical point along the saturation transition line is verified. However, the nature of MI-DSF transitions is not examined in their QMC work.
In the present work, the effect of the nearest-neighbor mutual repulsion on the ground-state phase diagrams of three-body constrained attractive lattice bosons is investigated by means of exact diagonalizations (ED). The systems under consideration are described by the extended Bose-Hubbard model with a three-body constraint on square lattices,
| (1) | ||||
Here, is the bosonic annihilation (creation) operator at site , is the nearest-neighbor hopping integral, is the on-site two-body attraction ( as the energy unit), and is the chemical potential. denotes the nearest-neighbor repulsion, which can come from the dipole-dipole interactions of the dipolar bosons polarized perpendicularly to the lattice plane by truncating it at the nearest-neighbor distance. For the discussions of possible experimental realizations on the present model, we refer to Ref. Dalmonte11, and references therein. The averaged particle density is denoted by and periodic boundary conditions are assumed. Our main results are summarized in Fig. 1. When , in addition to the MI and two superfluid phases mentioned above, a dimer checkerboard solid (DCS) state consisting of the checkerboard arrangement of boson pairs emerges and occupies the middle part of the phase diagram in the small- limit. The DSF states now appear only in between the uniform MI and the DCS states. Moreover, finite repulsion has interesting effects on the MI-superfluid transitions also. Because a modest nearest-neighbor repulsion can avoid cluster formation and then will suppress phase separation, we observe that the segments of the first-order MI-ASF transitions on phase boundaries of either the or the MI states (denoted by thick blue dashed lines in Fig. 1) can shrink to zero as is increased. Same conclusion has been reached in other context. Schmidt06 Besides, our findings show that the phase boundaries of the MI-DSF transitions (denoted by thin red solid lines in Fig. 1) and therefore the stability region of the DSF phase in the low-density limit can be extended to modest hopping parameters upon tuning , such that experimental exploration of this interesting state becomes more feasible. Our work hence provides a useful guide to the experimental search of the DSF phase and the associated quantum phase transitions in ultracold Bose gases in optical lattices.
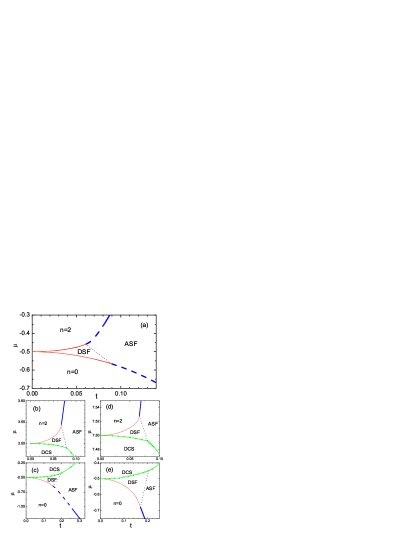
The details of our analysis are explained below. According to the discussions in Ref. Schmidt06, , one can determine the phase boundaries of either the MI state (i.e., the empty state) or the MI state (i.e., the completely filled state) for a given as follows. For the transitions out of the MI state, we calculate the excitation energies (relative to the state) , , and of the lowest states within the subspaces of fixed total particle numbers , 2, and 4, respectively. Here denotes the lowest excitation energy of within the fixed subspace. From these quantities, the two- and the four-particle binding energies, and , can be obtained. For a given value of the hopping parameter , if both and are positive, there exists no bound states and the energy gap of the single-particle state closes first upon increasing the chemical potential . This leads to a continuous MI-ASF transition at . note1 When but , instead, a bound state of two particles appears and its gap closes first. Thus a continuous MI-DSF transition will occur at . Aside from these two possibilities, the condition of gives a precursor of instability of boson pairs towards cluster formation. That is, phase separation emerges and a first-order transition will be observed in varying . In the present ED analysis, we estimate the first-order transition point by , which provides an upper bound of the exact value. Similar discussions apply to the transitions out of the MI state, where the holes created from the state take the role played by the particles discussed previously. We remind that the first-order transition points estimated by the four-hole excitation energies will be instead lower bounds of the exact values along the saturation transition line.
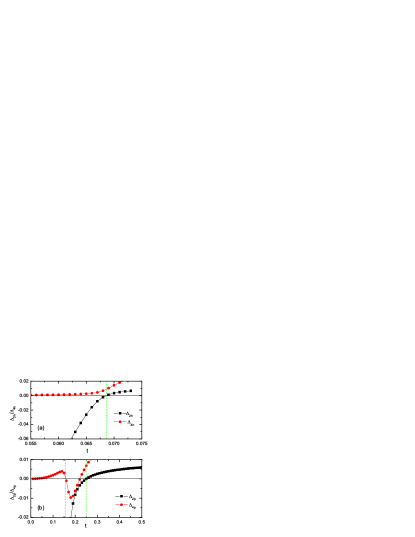
Here distinct MI-superfluid transitions are determined by the above method for systems of sites. The analysis for the case is described below for illustration. The results of various binding energies as functions of hopping parameter for this are presented in Fig. 2. As seen from Fig. 2(b), there is a finite region of within which . It implies that, on the phase boundary of the state, the continuous MI-DSF (for but ) and continuous MI-ASF (for both , ) transitions are separated by first-order MI-ASF transitions for . On the contrary, the two continuous MI-superfluid transitions on the phase boundary of the state should meet directly at . The transition points for a given can be determined by using the excitation energies as explained above. note2 According to our ED calculations, for , the continuous MI-DSF transitions end at , while for that of the continuous MI-DSF transition line. There exists also a tricritical point on the MI-ASF transition line separating the continuous from the first-order ones.
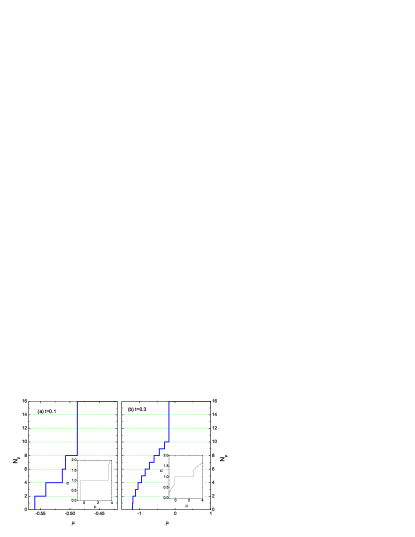
We now turn to the discussions on the phase boundaries of the DCS state. Due to the effect of the nearest-neighbor repulsion , boson pairs can form a solid with checkerboard structure at unit filling and lead to the DCS state. In the zero-hopping limit, this DCS state can be stabilized when with the coordination number for square lattices. The DCS state can melt into the DSF or the ASF states under increasing hopping, and its stability region in is expected to reduce to zero as increases. This picture is supported by our numerical calculations as seen in Fig. 1. Due to the limitation in numerics, the phase boundaries of the DCS state are estimated from the plateaus in the - plots for different ’s with systems sizes of . For illustration, total particle numbers and the particle density as functions of chemical potential for two different values of ’s with are presented in Fig. 3. The large plateaus at in the - plots clearly indicate the presence of the DCS state. Two ends of the plateau give the melting transition points in for a given , as depicted in Fig. 1. Moreover, distinct characters in various transitions can be revealed by the way in which the total particle number changes upon varying the chemical potential . Schmidt06 In the conventional ASF phase, the number of particles will increase by 1 when the chemical potential is increased. However, in the DSF phase, only pairs of bosons appear in the system due to the presence of a pairing gap. Thus adding a single boson is forbidden and the jumps in the particle number by 2 will be observed as is varied. Besides forming pairs, bosons can become unstable towards cluster formation such that the particle number jumps by a finite amount in the course of tuning . This corresponds to a first-order transition under the change in the chemical potential. As shown in Fig. 3, for , the system evolves across a continuous MI-DSF transition from the state to the DSF state, and then follows a first-order transition to the DCS state. For larger (say, ), the state after the continuous transition from the MI state becomes the ASF one instead. Adding more bosons by further increasing , the system can again follows a first-order transition to the DCS state.
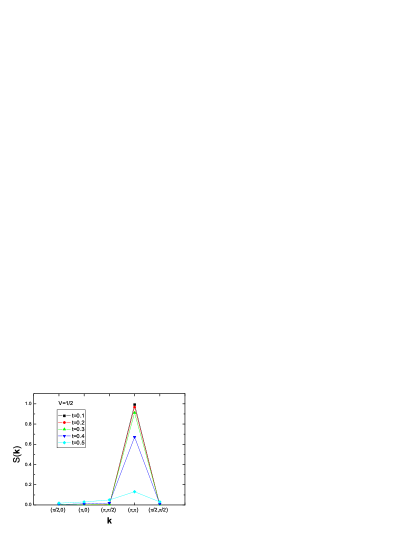
To provide support on the nature of the DCS states within the plateaus in the - curves, the static structure factors of the states for several hopping parameters ’s with and system size are shown in Fig. 4. It is found that the static structure factors do have peaks at the wave vector and thus signal the checkerboard pattern of the boson pairs. As observed from Fig. 4, when is increased, the peak value of the structure factor will decrease from its classical value at . This indicates the quantum melting of the DCS state into the DSF or the ASF states under increasing hopping.
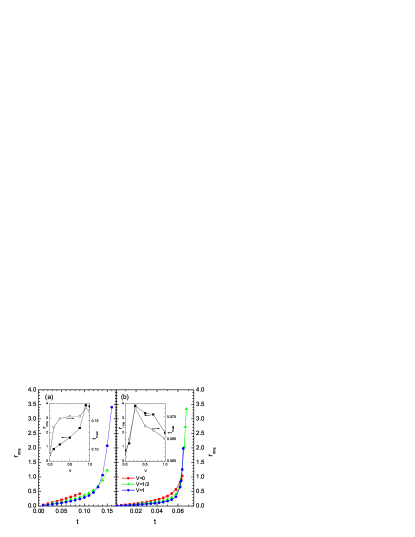
Some further microscopic details can be uncovered by the ED calculations. Similar to the counterpart of fermion pairing, a smooth crossover from the on-site pairs to the loosely bound pairs may occur also in the present attractive boson systems as the hopping parameter increases. In Fig. 5, evidences supporting this expectation are presented. Here the coherence length of the boson pairs is estimated by the root-mean-square separation , Ohta1995 ; Leung02 which is evaluated under the ground state of a single pair within the two-particle or the two-hole subspaces. Our results show rapid but smooth crossovers from the tightly bound molecules to the loosely bound pairs, as long as the DSF phase can be stabilized up to modest values of (say, the case for the particle pairs and the case for the hole pairs). The general dependence on the repulsion of the maximal extent in hopping integral for the stable DSF state in the low-density limit and the corresponding is shown in the insets of Fig. 5. We find that larger ’s in general lead to longer ’s. The dependence of and on is found to be nonmonotonic, and their functional forms shows asymmetry between the cases of the particle and the hole pairs. Our conclusions presented in Figs. 1 and 5 should be of help in determining optimal experimental settings in the search of the DSF phase in ultracold Bose gases in optical lattices.
In summary, the ground-state phase diagrams of the three-body constrained extended Bose-Hubbard model for various repulsions are investigated. Large plateaus at in the - curves which show the DCS states are observed. Finite repulsions modify the MI-superfluid transitions also. We find that the repulsion can change the first-order MI-ASF transitions into the continuous ones and the stability regions of the DSF phase can be tuned by . Therefore, carefully adjusting system parameters into the suggested parameter regime are necessary to find experimentally the interesting DSF phase in real ultracold Bose gas in optical lattices.
Y.-C.C., K.-K.N., and M.-F.Y. thank the National Science Council of Taiwan for support under Grant No. NSC 99-2112-M-029-002-MY3, NSC 97-2112-M-029-003-MY3, and NSC 99-2112-M-029-003-MY3, respectively.
References
- (1) M. Lewenstein, A. Sanpera, V. Ahufinger, B. Damski, A. Sen, and U. Sen, Adv. Phys. 56, 243 (2007); I. Bloch, J. Dalibard, and W. Zwerger, Rev. Mod. Phys. 80, 885 (2008).
- (2) M. Greiner, O. Mandel, T. Esslinger, T. W. Hänsch, and I. Bloch, Nature (London) 415, 39 (2002).
- (3) S. Diehl, M. Baranov, A. J. Daley, and P. Zoller, Phys. Rev. Lett. 104, 165301 (2010); Phys. Rev. B 82, 064509 (2010); Phys. Rev. B 82, 064510 (2010).
- (4) Y.-W. Lee and M.-F. Yang, Phys. Rev. A 81, 061604(R) (2010).
- (5) A. J. Daley, J. Taylor, S. Diehl, M. Baranov, and P. Zoller, Phys. Rev. Lett. 102, 040402 (2009).
- (6) M. Roncaglia, M. Rizzi, and J. I. Cirac, Phys. Rev. Lett. 104, 096803 (2010).
- (7) L. Mazza, M. Rizzi, M. Lewenstein, and J. I. Cirac, Phys. Rev. A 82, 043629 (2010).
- (8) S. Coleman and E. Weinberg, Phys. Rev. D 7 1888 (1973); B. I. Halperin, T. C. Lubensky, and S.-K. Ma, Phys. Rev. Lett. 32, 292 (1974).
- (9) L. Bonnes and S. Wessel, Phys. Rev. Lett. 106, 185302 (2011).
- (10) M. Dalmonte, M. Di Dio, L. Barbiero, and F. Ortolani, Phys. Rev. B 83, 155110 (2011).
- (11) K. P. Schmidt, J. Dorier, A. Läuchli, and F. Mila, Phys. Rev. B 74, 174508 (2006).
- (12) Because the excitation energies of the single-particle and the single-hole states can be calculated analytically, there exist exact expressions of the phase boundaries for the continuous MI-ASF transitions. That is, for the state, while for the state. Here is the coordination number. Our numerical data on finite systems for these continuous transitions agree with the analytical results.
- (13) For the case, the phase boundaries of the continuous transitions achieved by ED coincide with the results evaluated by the SSE QMC algorithm implemented with a two-loop update scheme Ng11 for system size and temperature , while the estimated first-order transition points somewhat deviate from the QMC values. This shows that the present ED analysis can indeed give correct phase boundaries.
- (14) K.-K. Ng and M.-F. Yang, Phys. Rev. B. 83, 100511 (2011).
- (15) Y. Ohta, A. Nakauchi, R. Eder, K. Tsutsui, and S. Maekawa, Phys. Rev. B. 52, 15617 (1995).
- (16) P. W. Leung, Phys. Rev. B. 65, 205101 (2002).