Trigonometric Parallaxes of Massive Star Forming Regions: VIII. G12.89+0.49, G15.03-0.68 (M17) and G27.36-0.16
Abstract
We report trigonometric parallaxes for three massive star forming regions, corresponding to distances of kpc for G12.89+0.49 (also known as IRAS 180891732), kpc for G15.03-0.68 (in the M17 region), and kpc for G27.36-0.16. Both G12.89+0.49 and G15.03-0.68 are located in the Carina-Sagittarius spiral arm.
1 Introduction
Accurately determining the spiral structure of the Milky Way is a difficult task. In principle, kinematic distances can be used to construct the spiral structure of the Galaxy. However, recent work on parallax and proper motion measurements has shown that kinematic distances can be affected by large uncertainties. In some places of the Galaxy, characterized by “anomalous” motions (as, for example, the Perseus arm (Xu et al., 2006a)), kinematic distances can be in error by a factor as large as two. Relying solely on kinematic distances, one cannot accurately determine the location of spiral arms. A more secure method of distance measurement is required to re-construct the Galactic spiral structure and its 3-D motion (Reid et al., 2009a). Recently, CH3OH 12 GHz masers have been used as astrometric targets to measure the trigonometric parallaxes and proper motions of massive star-forming regions (Reid et al., 2009b, hereafter called Paper I). As part of that large project, here, we present the results of our parallax measurement campaign toward the sources G12.89+0.49, G15.03-0.68 and G27.36-0.16.
2 Observations and Calibration
A series of observations of the 12 GHz CH3OH masers in the G12.89+0.49, G15.03-0.68, and G27.36-0.16 star-forming regions were carried out with the NRAO111The National Radio Astronomy Observatory is a facility of the National Science Foundation operated under cooperative agreement by Associated Universities, Inc. Very Long Baseline Array (VLBA). Paper I provides a description of the general observational setup and data calibration procedures, and here we note only details specific to the observations of the three sources presented in this paper.
G12.89+0.49 and G15.03-0.68 were observed at five epochs (VLBA program BR129A): 2007 October 18; April 17 and September 13 2008; March 23 and October 23 2009. However, because of bad weather, the data quality of the first epoch was not good enough for parallax measurement, and the present results are based on the following four epochs only. G27.36-0.16 was observed at four epochs (VLBA program BR129C): 2007 October 27; April 24 and October 31 2008; 2009 April 16. The observing dates have been chosen to sample the peaks of the parallax signature in right ascension, as the amplitude of the parallax signature in declination is considerably smaller.
For each maser source, we used three different background sources, selected from the following calibrator surveys: the VLBI Exploration of Radio Astrometry (VERA, Honma et al. (2001)) Galactic Plane Survey; a VLA survey of compact NVSS sources (Xu et al., 2006b); the VCS2 and VCS3 catalogs (Fomalont et al., 2003; Petrov et al., 2005). Only background sources belonging to the VCS2 and VCS3 catalogs were detected. The non-detected calibrators were J1815-1717 and J1837-0628 from the VERA survey, and J1809-1804 and J1817-1614 from the VLA survey. Table 1 reports the peak positions and intensities of the maser and background sources, listing also the main observing parameters. We recorded four adjacent dual circularly polarized 4 MHz bands with the maser signal in the second band centered at the peak velocity of the 12 GHz maser emission, corresponding to a LSR velocity, , of 40 km s-1, 23 km s-1 and 100 km s-1 for source G12.89+0.49, G15.03-0.68 and G27.36-0.16, respectively. The spectral resolution was 0.38 km s-1.
We used observations of the strong VLBA calibrators J18003848 and 3C345 (J1642+3948) to correct for instrumental delays and phase offsets among different frequency bands. The spectral channel with the strongest maser emission was used as the phase reference (see Table 1). The maser reference features were detected at all epochs and were relatively stable in flux, with the exception of the source G12.89+0.49, whose correlated flux density on the shortest VLBA baselines increased monotonically by a factor of 2, while Goedhart et al. (2009) found a periodical variation with a period of 30 days and flux variations of 50%. After applying the maser calibration, we integrated the data of the background continuum sources over all four dual-polarized bands and imaged the sources using the AIPS task IMAGR. For all maser targets, the maser-referenced calibrator image has a dynamical range of about 10.
The naturally-weighted “dirty” beam was determined by the availability of maser phase-reference data and, as expected for low-declination sources, was strongly elongated close the N–S direction. For each of the three maser targets, Table 1 reports the parameters of the “dirty” beam as derived by the AIPS task IMAGR by fitting an elliptical Gaussian brightness distribution to the central portion of the “dirty” beam map. The images of the maser and corresponding calibrators have been restored using a round ”clean” beam, with a FWHM size intermediate between the minor and major FWHM sizes of the “dirty” beam. To make images from different epochs more readily comparable, maps of a given source were restored using the same beam.
After obtaining maps of both maser and background sources for all epochs, we derived the parameters of the emission by fitting elliptical Gaussian brightness distributions. Table 1 lists the position and peak intensity of the maser and corresponding calibrator(s), as well as the angular separation on the sky between the two sources. Absolute maser positions are derived from the positions of the ICRF sources J18251718 and J18340301, which are accurate within mas.
2.1 Methanol masers
Emission in the 12.2 GHz CH3OH maser line generally is coextensive with emission in the 6.7 GHz line – maser spots at similar velocities often arise from similar positions (Menten et al., 1992). Since the 6.7 GHz emission is almost always (much) stronger than the 12.2 GHz emission, spectra in the former are much richer and more maser spots are detected at 6.7 GHz (see, e.g. Caswell et al., 1995). For all our sources, the emission is dominated by a single feature at the LSR velocity listed in Table 1. The positions of any other weak features (if present) were found to be close (withih a few mas) to the strongest feature.
3 Results
Following the analysis described in Paper I, the measured positions of the masers were modeled as a linear combination of the elliptical parallax and linear proper motion signatures. Because systematic errors (owing to small uncompensated atmospheric delays and, in some cases, varying maser and calibrator source structures) typically dominate over thermal noise when measuring relative source positions, we added “error floors” in quadrature to the formal position uncertainties. We used different error floors for the Right Ascension and Declination data and adjusted them to yield post-fit residuals with per degree of freedom near unity for both coordinates.
3.1 G12.89+0.49
Fig. 1 presents the images of the G12.89+0.49 reference maser channel at = 39.8 km s-1 and the background continuum source J18251718 (phase referenced to the reference maser channel) at the second epoch (2008 April 17). Both the maser and the background source emission is dominated by a single compact component, which serves as an astrometric target. Fig. 2 reports the positions of the emission in the reference maser channel (relative to the background source J18251718) as a function of time and the parallax fit. The large declination errors of the parallax fit are probably caused by residual phase errors due to the combination of the large maser-calibrator separation (33) and the low maser declination.

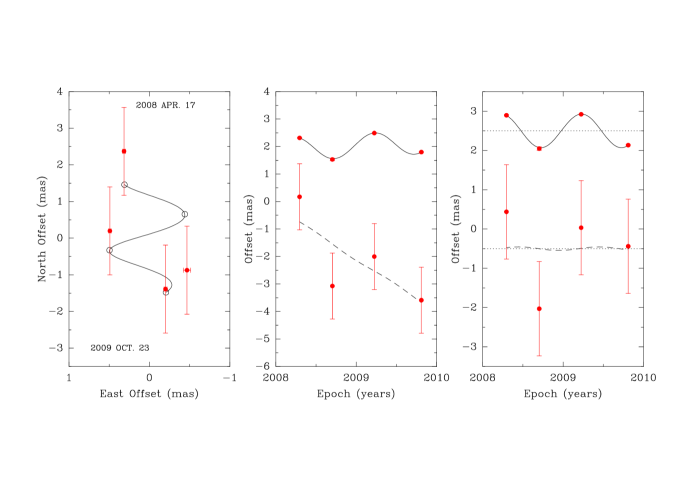
Fitting for the parallax and proper motion simultaneously, we obtain mas. The proper motions in the eastward and northward directions are and mas y-1, respectively (see Table 2). This parallax corresponds to a distance of kpc. Based on this distance, G12.89+0.49 is most likely in the Carina-Sagittarius arm of the Milky Way, and not in the Crux-Scutum arm.
3.1.1 Maser environment
G12.89+0.49, better known as IRAS 180891732, has long be known as a prominent maser source, showing strong emission from all the widespread interstellar maser molecules (OH, H2O, and CH3OH). It was included in the sample of high mass protostellar objects (HMPOs) defined by Sridharan et al. (2002) and further studied by Beuther et al. (2002a, and references therein). Except for a single spot (the component F) detached by 1.4, all of the 6.7 GHz CH3OH maser spots detected by Walsh et al. (1998) coincide with our VLBA maser position within the errors (1) of the Australia Telescope Compact Array (ATCA). Our VLBA maser emission is most likely corresponding with the component A of Walsh et al. (1998), which shows a similar = 39.2 km s-1. H2O maser emission has been found with the VLA ′′ to the NNE (Beuther et al., 2002b). Interestingly, the H2O maser position coincides with weak cm-wavelength radio continuum emission and a (sub)mm dust emission peak, while the CH3OH maser is offset from these peaks (Beuther et al., 2004). The masers and continuum emission are associated with a rich molecular hot core, which has been interpreted as a rotating disk (Beuther et al., 2005).
3.2 G15.03-0.68
Fig. 3 presents the images of the G15.03-0.68 reference maser channel ( = 23.4 km s-1) and the background continuum source J18251718 (phase referenced to the reference maser channel), at the second epoch (2008 April 17). Fig. 4 reports the positions of emission in the reference maser channel (relative to the background source J18251718) as a function of time and the parallax fit.

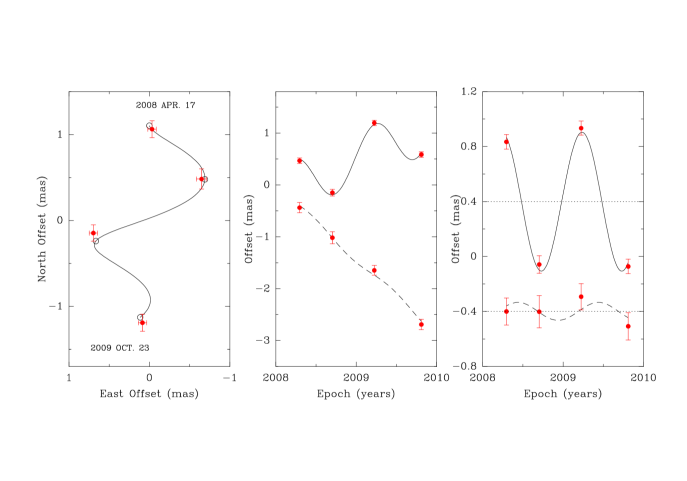
Fitting for the parallax and proper motion simultaneously, we obtain mas, corresponding to a distance of kpc. At this distance, G15.03-0.68 is likely in the Carina-Sagittarius arm. The proper motions in the eastward and northward directions are and mas y-1, respectively (see Table 2).
3.2.1 Maser environment
The maser position coincides with the “unusual radio point source in M17” found by Felli et al. (1980), one of the first ultracompact HII regions ever identified as such. The position of the 6.7 GHz maser emission, as recently determined by Caswell (2009) using ATCA, is consistent within the ATCA measurement error () with that we determine for the 12.2 GHz line.
3.3 G27.36-0.16
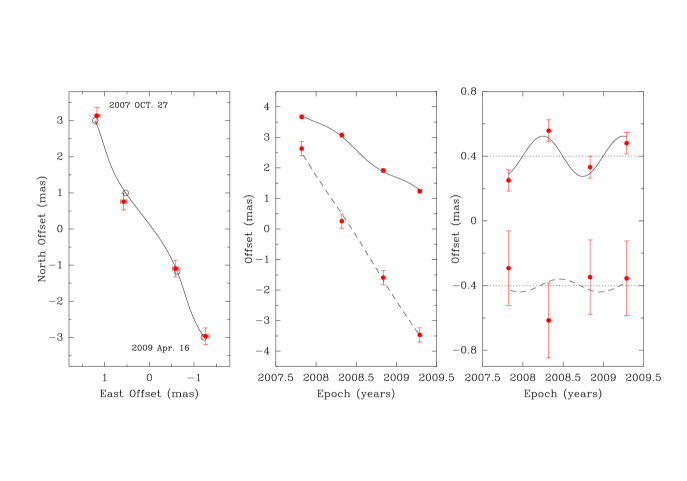
Fig. 5 presents the images of the G27.36-0.16 reference maser channel ( = 99.6 km s-1) and the two background continuum sources J18340301 and J18460651 (phase referenced to the reference maser channel) at the second epoch (2008 April 24). Fig. 6 reports the positions of the reference maser channel (relative to the background sources J18340301) as a function of time and the parallax fit.
For this source, the derived value of parallax has a large fractional uncertainty. Using only data from the J18340301 calibrator, we obtain mas, while using the J18460651 data, we find mas. Since the result from the J18340301 calibrator appears significantly more precise than that obtained from J18460651, we take the former as the best parallax measurement for G27.36-0.16, corresponding to a distance of kpc. The proper motions in the eastward and northward directions are and mas y-1, respectively (see Table 2).

3.3.1 Maser environment
The 12.2 GHz CH3OH maser in the G27.36-0.16 region is offset by about from a compact radio source found by Becker et al. (1994), which also has an associated IRAS source (183910504). Much stronger emission than in this line has been found in the 6.7 GHz CH3OH line (Szymczak et al., 2002), which has associated maser emission from OH and H2O (Szymczak & Gérard, 2004; Szymczak et al., 2005). This source appears to have been little studied in thermal molecular line emission.
4 Galactic Locations and 3-D Motions
Combining the distances, LSR velocities and proper motions of the masers yields their locations in the Galaxy and their full space motions. Since internal motions of 12 GHz methanol masers are fairly small, typically km s-1(Moscadelli et al., 2002), the maser motions should be close to that of their associated young stars. Given a model for the scale and rotation of the Milky Way, we can subtract the effects of Galactic rotation and the peculiar motion of the Sun from the space motions of the maser sources and estimate the peculiar motions of the associated young stars. Following the discussion by Reid et al. (2009a), the motion of an individual massive star (associated with the masers) can then be taken as representative of that of the whole star-forming region to which the massive star belongs, allowing for a velocity dispersion of individual stars of km s-1 per each velocity coordinate. Peculiar motions are given in a Galactocentric reference frame, where are the velocity components toward the Galactic center, in the direction of Galactic rotation, and toward the North Galactic Pole, respectively, at the location of a given source in the Galaxy. We adopt the IAU values for the distance to the Galactic center ( kpc) and the rotation speed of the Galaxy at this distance ( km s-1), and assumes a flat rotation curve. We use the Solar Motion value (, , and km s-1) by Schönrich et al. (2010), which have recently revised the Hipparcos satellite result. Table 3 reports the peculiar motions derived for our maser targets. For comparison, the results obtained with a different model of Galactic rotation ( kpc, km s-1), based on both the weighted average of recent four direct measurements of the distance to the Galactic center and the proper motion of Sgr A∗ (Brunthaler et al., 2011), are also reported. Looking at Table 3, one can see that, except for G27.36-0.16 whose space motion may be strongly affected by the large parallax uncertainty, the derived peculiar motions are fairly independent on the adopted Galactic rotation model. For all sources, the motion directed toward the north Galactic pole is only of a few km s-1. This is consistent with the expectation for the motion of massive star-forming regions, which should be mainly in the Galactic plane.
5 Conclusions
We have measured the parallax and proper motion of 12 GHz methanol masers in three star-forming regions. For two sources, the derived distances are accurate by better than 10%: kpc for G12.89+0.49 and kpc for G15.03-0.68. For the source G27.36-0.16, the derived distance is affected by a large uncertainty: .
Our precise absolute positions place the methanol masers near the center of active regions of high mass star formation, as traced by molecular hot cores, ultracompact HII regions and/or dust condensations or a combination of these.
Facilities: VLBA
References
- Becker et al. (1994) Becker, R. H., White, R. L., Helfand, D. J., & Zoonematkermani, S. 1994, ApJS, 91, 347
- Beuther et al. (2002a) Beuther, H., Schilke, P., Menten, K. M., Motte, F., Sridharan, T. K., & Wyrowski, F. 2002a, ApJ, 566, 945
- Beuther et al. (2002b) Beuther, H., Walsh, A., Schilke, P., Sridharan, T. K., Menten, K. M., & Wyrowski, F. 2002b, A&A, 390, 289
- Beuther et al. (2004) Beuther, H., Hunter, T. R., Zhang, Q. et al. 2004, ApJ, 616, L23
- Beuther et al. (2005) Beuther, H., Zhang, Q., Sridharan, T. K., & Chen, Y. 2005, ApJ, 628, 800
- Brunthaler et al. (2011) Brunthaler, A, Reid, M. J, Menten, K. M. et al. 2011, arXiv:1102.5350
- Caswell et al. (1995) Caswell, J. L., Vaile, R. A., Ellingsen, S. P., & Norris, R. P. 1995, MNRAS, 274, 1126
- Caswell (2009) Caswell, J. L. 2009, PASA, 26, 454
- Felli et al. (1980) Felli, M., Johnston, K. J., & Churchwell, E. 1980, ApJ, 242, L157
- Fomalont et al. (2003) Fomalont, E. B., Petrov, L., MacMillan, D. S., Gordon, D., & Ma, C. 2003, AJ, 126, 2562
- Goedhart et al. (2009) Goedhart, S., Langa, M. C., Gaylard, M. J., & van der Walt, D. J. 2009, MNRAS, 398, 995
- Honma et al. (2001) Honma, M., Kawaguchi, N., & Sasao, T. 2001, in Proc. SPIE Vol.4015 Radio Telescope, ed H. R. Butcher, p624
- Menten et al. (1992) Menten, K. M., Reid, M. J., Pratap, P., Moran, J. M., & Wilson, T. L. 1992, ApJ, 401, L39
- Moscadelli et al. (2002) Moscadelli, L., Menten, K. M.,Walmsley, C. M., & Reid, M. J. 2002, ApJ, 564, 813
- Petrov et al. (2005) Petrov, L., Kovalev, Y. Y., Fomalont, E., & Gordon, D. 2005, AJ, 129, 1163
- Reid et al. (2009a) Reid, M. J., Menten, K. M., Zheng, X. W. et al. 2009a, ApJ, 700, 137
- Reid et al. (2009b) Reid, M. J. , Menten, K. M., Brunthaler, A., Zheng, X. W., Moscadelli, L. & Xu, Y. 2009b ApJ, 693, 397 (Paper I).
- Schönrich et al. (2010) Schönrich, R., Binney, J. J., & Dehnen, W., 2010, MNRAS, 403, 1829
- Sridharan et al. (2002) Sridharan, T. K., Beuther, H., Schilke, P., Menten, K. M., & Wyrowski, F. 2002, ApJ, 566, 931
- Szymczak et al. (2002) Szymczak, M., Kus, A. J., Hrynek, G., Kěpa, A., & Pazderski, E. 2002, A&A, 392, 277
- Szymczak & Gérard (2004) Szymczak, M., & Gérard, E. 2004, A&A, 414, 235
- Szymczak et al. (2005) Szymczak, M., Pillai, T., & Menten, K. M. 2005, A&A, 434, 613
- Walsh et al. (1998) Walsh, A. J., Burton, M. G., Hyland, A. R., & Robinson, G. 1998, MNRAS, 301, 640
- Xu et al. (2006a) Xu, Y., Reid, M. J., Zheng, X. W., & Menten, K. M. 2006b, Science, 311, 54
- Xu et al. (2006b) Xu, Y., Reid, M. J., Menten, K. M. & Zheng, X. W. 2006a, ApJS, 166, 526
| Source | R.A. (J2000) | Dec. (J2000) | Brightness | NW beam | ||
|---|---|---|---|---|---|---|
| (∘) | (Jy/beam) | (km s-1) | (mas, mas, deg) | |||
| G12.89+0.49 | 18 11 51.3955 | 17 31 29.913 | 2.2 | 39.8 | 4.22.5 @ 2 | |
| J1825-1718 | 18 25 36.53228 | 17 18 49.8484 | 3.3 | 0.14 | 5.73.8 @ 33 | |
| G15.03-0.68 | 18 20 24.8111 | 16 11 35.316 | 2.9 | 23.4 | 3.61.8 @ 1 | |
| J1825-1718 | 18 25 36.53228 | 17 18 49.8484 | 1.7 | 0.14 | 4.32.2 @ 11 | |
| G27.36-0.16 | 18 41 51.0570 | 05 01 43.443 | 2.6 | 99.6 | 2.71.4 @ 16 | |
| J1834-0301 | 18 34 14.07456 | 03 01 19.6274 | 2.8 | 0.07 | 2.81.7 @ 13 | |
| J1846-0651 | 18 46 06.30026 | 06 51 27.7456 | 2.1 | 0.04 | 3.11.7 @ 20 |
Note. — is the angular separation between the maser and the calibrator. The maser absolute position, the peak brightness, the size and P.A. of the naturally-weighted (NW) beam are listed for the epoch 2008 April 17 and 2008 April 24, for the source couple G12.89+0.49 and G15.03-0.68, and G27.36-0.16, respectively. The P.A. of the beam is defined as East of North.
| Maser | Background | Parallax | |||
|---|---|---|---|---|---|
| Name | (km s-1) | Source | (mas) | (mas y-1) | (mas y-1) |
| G12.890.49 | 39.8 | J1825-1718 | 0.4280.022 | 0.160.03 | 1.901.59 |
| G15.030.68 | 23.4 | J1825-1718 | 0.5050.033 | 0.680.05 | 1.420.09 |
| G27.360.16 | 92.2 | J1834-0301 | 0.1250.042 | 1.810.08 | 4.110.26 |
| 92.2 | J1846-0651 | 0.1980.133 | 1.900.27 | 4.750.15 |
| R0 = 8.5 kpc, = 220 km s-1 | R0 = 8.3 kpc, = 239 km s-1 | ||||||
|---|---|---|---|---|---|---|---|
| Maser | U | V | W | U | V | W | |
| Name | (km s-1) | (km s-1) | (km s-1) | (km s-1) | (km s-1) | (km s-1) | |
| G12.89+0.49 | +167 | +215 | 48 | +147 | +215 | 48 | |
| G15.03-0.68 | +25 | +62 | 51 | +05 | +62 | 51 | |
| G27.36-0.16 | 5343 | 3217 | 36 | 8047 | 4825 | 36 | |
Note. — For the source G27.36-0.16, the reported peculiar motion is calculated from the proper motion values derived using data from the calibrator J18340301.