Discovery of GeV -ray emission from PSR B125963/LS 2883
Abstract
The binary system PSR B125963/LS 2883 consists of a 47.8 ms radio pulsar that orbits the companion Be star with a period of 3.4 years in a highly eccentric orbit. The system has been well sampled in radio, X-ray, and TeV -ray bands, and shows orbital phase-dependent variability in all observed frequencies. Here we report on the discovery of 100 MeV -rays from PSR B125963/LS 2883 through the 2010 periastron passage. Using data collected with the Large Area Telescope aboard Fermi from 33 days before periastron to 75 days after periastron, PSR B125963/LS 2883 was detected at a significance of 13.6 standard deviations. The -ray light curve was highly variable over the above period, with changing photon index that correlates with the -ray flux. In particular, two major flares that occur after the periastron passage were observed. The onset of -ray emission occurs close to, but not at the same orbital phases as, the two disk passages that occur 1 month before and 1 month after the periastron passage. The fact that the GeV orbital light curve is different from that of the X-ray and TeV light curves strongly suggests that GeV -ray emission originates from a different component. We speculate that the observed GeV flares may be resulting from Doppler boosting effects.
Subject headings:
gamma rays: stars — gamma rays: observations — Pulsars: individual (PSR B125963) — X-rays: binaries1. Introduction
The binary system PSR B125963/LS 2883 comprises a young radio pulsar with a period 47.8 ms and a Be star LS 2883. With an eccentric (e0.87) orbit, the pulsar approaches the periastron every 3.4 years (Johnston et al., 1994). The high spin-down power of PSR B125963 (81035 erg s-1; Manchester et al., 1995) suffices to generate a relativistic pulsar wind (PW). The system is highly variable over an orbital period in radio (e.g., Johnston et al., 2005), X-rays (e.g., Hirayama et al., 1999; Chernyakova et al., 2006, 2009), and TeV -rays (Aharonian et al., 2005, 2009). The broadband electromagnetic spectrum is believed to result from the interaction of the PW and the stellar wind of LS 2883, the latter being composed of a polar wind and a dense equatorial circumstellar disk. The stellar disk is inclined with respect to the orbital plane (Wex et al., 1998; Johnston et al., 1999) such that the pulsar passes through the disk shortly before and shortly after the periastron passage.
The X-ray flux changes significantly with orbital phase. The 1–10 keV flux increases from 10 at apastron to more than 10 shortly before and shortly after the periastron passage (Chernyakova et al., 2009, and references therein). The X-ray photon index () also shows variability related to the orbital period and a spectral state with the hardest spectra () occurred around the same time as the observed rapid growth of the X-ray flux (Chernyakova et al., 2006). The unpulsed radio flux increases through the past four periastron passages with respect to other orbital phases, although the light curves show slightly different behaviors during each passage (Johnston et al., 2005, and references therein).
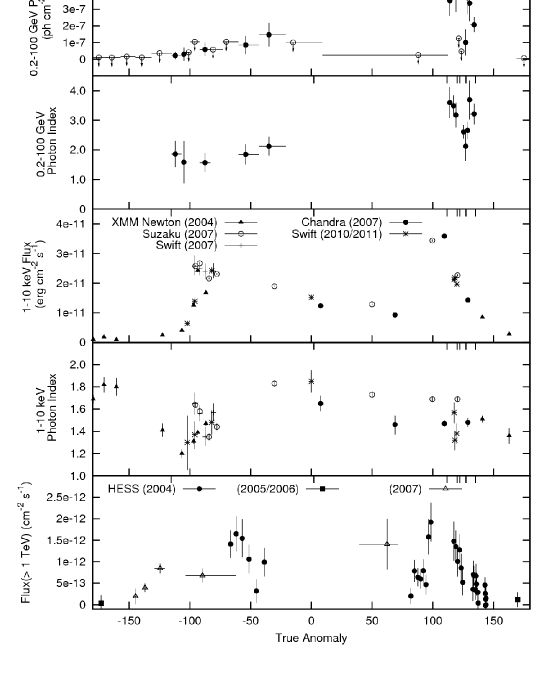
The first detection of PSR B125963/LS 2883 in -rays was made by the H.E.S.S. Cherenkov array through the 2004 periastron passage (Aharonian et al., 2005), and subsequently in 2007 (Aharonian et al., 2009). The 2004 and 2007 data show that the TeV emission peaks 10 days before and 20 days after the periastron passages and the possible dips seen in the TeV light curves before and after the periastron seem to coincide with the stellar disk passage (see Fig. 1 in Kerschhaggl, 2011, as well as Fig. 1).
An upper limit of 10-10 erg cm-2 s-1 was derived using EGRET data (Hartman et al., 1999) for the average -ray emission. A claim made by the AGILE collaboration on the detection of PSR B125963/LS 2883 above 100 MeV in a 2-day period in August 2010 (Tavani et al., 2010) has not been confirmed by data collected using the more sensitive Fermi/LAT detector during the same period (Abdo et al., 2010c).
During a regular monitoring of -ray emission from PSR B125963 shortly before the periastron passage in mid-December, we found the first evidence (4) for -ray emission from PSR B125963/LS 2883 during a 3-day time interval (Tam et al., 2010). The discovery was later confirmed by Abdo et al. (2010d) who used data collected over 30 days from 2010 November 18.
In this Letter, detailed Fermi analysis results of PSR B125963/LS 2883 from 2008 through early 2011 are presented.
2. Fermi/LAT observations and results
The Large Area Telescope (LAT) aboard the Fermi Gamma-ray Space Telescope can detect -rays with energies between 20 MeV and 300 GeV (Atwood et al., 2009). The -ray data used in this work were obtained between 2008 August 4 and 2011 February 28. These data are available at the Fermi Science Support Center111http://fermi.gsfc.nasa.gov/ssc/. Due to the discovery of -rays from PSR B125963/LS 2883, a modified sky survey was commenced from 2010 December 27 for 10 days. In this mode the southern hemisphere receives 30% extra exposure. We used the Fermi Science Tools v9r18p6 package to reduce and analyze the data in the vicinity of PSR B125963/LS 2883. Only events that are classified as the “diffuse” class or the “data-clean” class were used. To reduce the contamination from Earth albedo -rays, we excluded events with zenith angles greater than 105∘. The instrument response functions “P6_V3_DIFFUSE” were used.
We carried out unbinned maximum-likelihood analyzes (gtlike) of the circular region with a 15∘ radius centered on the -ray position of PSR B125963 (see below). We subtracted the background contribution by including the Galactic diffuse model (gll_iem_v02.fit) and the isotropic background (isotropic_iem_v02.txt), as well as all sources in the first Fermi/LAT catalog (1FGL; Abdo et al., 2010b) within the circular region of 25∘ radius centered on the -ray position of PSR B125963. We assumed single power laws for all 1FGL sources considered, except for -ray pulsars of which the spectra follow power laws with exponential cut-off (Abdo et al., 2010a). The spectral parameter values for sources within 10∘ from PSR B125963 as well as the normalization parameters of the diffuse components were set free.
No significant emission was found before 2010 November 11. We derived upper limits of -ray flux from PSR B125963/LS 2883 using data obtained between 2008 August 4 and 2010 November 10 (see Fig. 1). However, the source became active roughly when PSR B125963 entered the stellar disk (Tam et al., 2010; Abdo et al., 2010d).
We first analyzed 0.2–100 GeV data from 2010 November 11 to 2011 February 28. Using a power-law description of PSR B125963, the maximized test-statistic (TS) value (Mattox et al., 1996) obtained for the pulsar position is 184, corresponding to a detection significance of 13.6. This allows us to classify PSR B125963/LS 2883 as a new GeV -ray source. The best-fit position of the -ray emission is estimated by gtfindsrc to be at right ascension (J2000) 19567 and declination (J2000) 6373 with statistical uncertainty 006 (014) at the 68%(95%) confidence level, which is consistent with the position of PSR B125963. The systematic uncertainty is estimated to be up to 40% (Abdo et al., 2009a).
2.1. Light curve
We then derived a 0.2–100 GeV light curve composed mostly of 3-day bins (Fig. 1). Such bin size ensures enough photon statistics in each bin without loosing information on short time-scale variability. Finer binning (e.g. 1-day) results in low significance for most of the days and high statistical uncertainties in deriving fluxes and photon indices, except for the flaring period that occur between 2011 January 14 and February 3. For data taken more than one month before and two months after the 2010 periastron passage, larger bins were employed for better visualization. From 2010 December 15 to 2011 January 13, no evidence for -ray emission was found, as first noted in Kong et al. (2011). We therefore derive an upper limit for the above quiescent period. Data points represent the flux values with TS5, for which photon indices are also shown. Otherwise, an upper limit is derived.
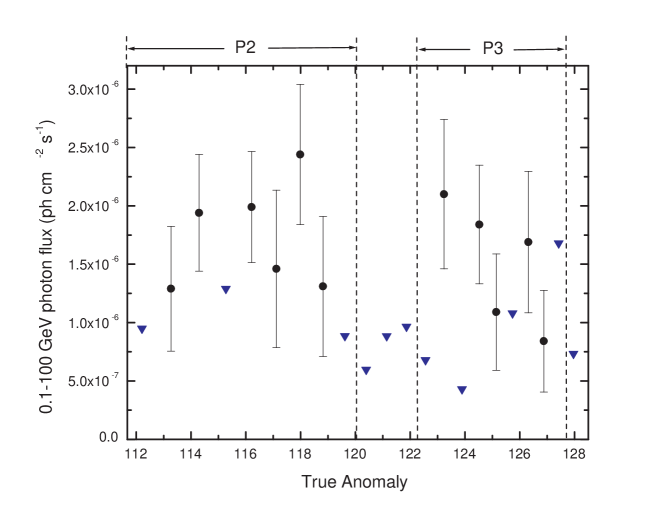
As shown in Fig. 1, the -ray light curve is highly variable through the 2010 periastron passage: (1) The source started to be active in -rays about a month before 2010 periastron passage (P1); (2) It remains undetected for about one month since mid-December (Q1); (3) Subsequently, a major flaring period was identified; it peaks at 35 days after periastron. Having an average flux higher than that in P1 by an order of magnitude, this flare lasted for only 7 days (P2); (4) A second flare that peaks at 46 days after periastron, however, lasted longer, so that the source was detected until end of February (P3 and P4). To probe shorter time-scale variability during the flaring period (i.e., P2 and P3), we also produced the light curve with 1-day binning during January 14 to February 4 (Fig. 2). Here 0.1–100 GeV photons were used to increase photon statistics. To better demonstrate the variability, we plot data points with TS5 (rather than the more standard criterium of TS9) as flux values since a substantial number of data are of TS between 5 and 9. It can be seen that -rays from PSR B125963/LS 2883 undergo rapid variations down to time scale of one day. Such variability is one of the fastest detected from any Galactic GeV source on the sky. No emission was detected during January 22–26, indicating that the source underwent a short quiescent period between the two major flares.
We also show in Fig. 1 the orbital X-ray and TeV light curves. The GeV orbital light curve is different than the X-ray and TeV light curves, suggesting that the origin of GeV -rays is different than the others.
2.2. Spectral analysis
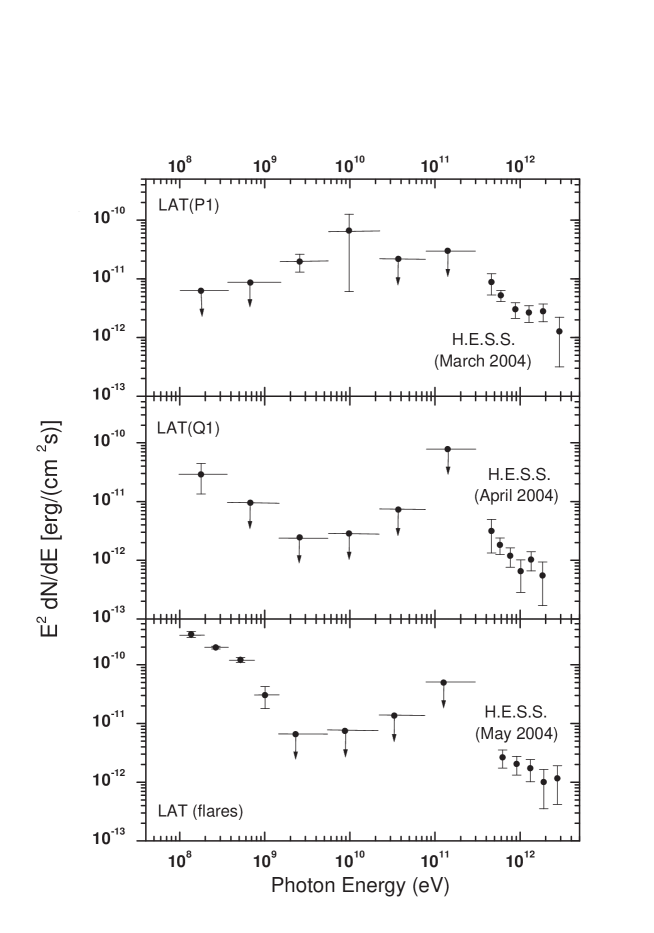
As the derived photon indices change significantly with time, we defined four periods that are indicated in Figure 1 and Table 1. We further divided the 0.1-300 GeV -rays arriving during P1, P2, P3, and P4, respectively, into six energy bins of logarithmically equal bandwidths and reconstructed the flux using gtlike for each band independently. A power-law (PL) model for each bin was assumed and the photon spectral index was fixed at a representative value 2.8. While the emission is detected (i.e., TS5) from 1.4 GeV to 20 GeV for P1, no -ray source was apparent at the PSR B125963 position in the four bins above 1.4 GeV (the derived TS values 5) in the likelihood analysis for P2, P3, and P4, indicating a cut-off at energy 1 GeV during the flaring period. See Fig. 4 for the spectrum derived from a combined analysis of P2 and P3. We therefore attempted to fit the 0.1–100 GeV spectrum with a PL with an exponential cut-off (PLE), as well as a broken PL. We found that PLE describes the spectrum even better during the periods P2, P3, and P4, by TSTSTS8, i.e., 3 in significance levels. The best-fit parameters are shown in Table 1. In particular, the cut-off energies were found to be 310160 MeV, 550330 MeV, and 25095 MeV during the periods P2, P3, and P4, respectively. On the other hand, the parameters provided by the broken PL with all four parameters being free are not well constrained; we therefore do not consider this model.
At a distance 2.3 kpc (Negueruela et al., 2011), the average energy flux during the flares of 3 erg cm-2 s-1 corresponds to the -ray luminosity 1.9 erg s-1. Given the pulsar spin-down luminosity 81035 erg s-1, the average -ray efficiency is about 25% during the flares.
To demonstrate that GeV emission originates from a component that is temporally and spectrally different than the TeV emission, we put together the 100 MeV to 300 GeV spectra and the 300 GeV -ray spectra obtained for different orbital phases in Figure 4. It is clear that the GeV emission evolves differently compared to the TeV emission, assuming that the TeV behavior does not change dramatically between 2004 and 2010 periastron passages.
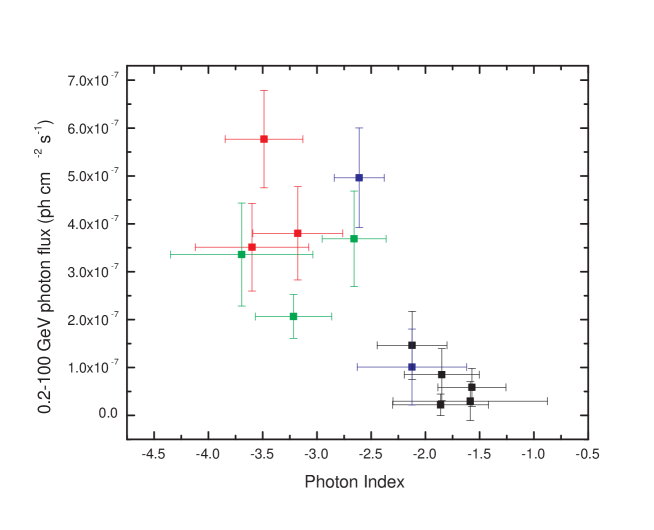
2.3. Correlation between flux and photon index
In Fig. 3 we plot -ray flux versus photon index, showing a correlation between these two quantities. We carried out a nonparametric correlation analysis. The computed Spearman rank correlation coefficient between two quantities is . The probability that this coefficient is different than zero is 0.9959. We have also calculated the linear correlation coefficient (i.e., Pearson’s r). This results in Pearson’s r and the probability that this coefficient is different than zero is 0.9986.
3. Discussion
High-energy emissions from -ray binaries (PSR B1259-63, LS 5039, and LS I+) have been discussed using leptonic models (e.g., Tavani & Arons, 1997; Dubus 2006; Takata & Taam 2009) and hadronic models (e.g., Kawachi et al. 2004; Chernyakova et al. 2009). In leptonic models, PW particles (electrons and positrons) are accelerated at the shock where the dynamical pressure of the PW and that of the stellar wind are in balance. These particles in turn emit non-thermal photons over a wide range of energies via synchrotron radiation (radio to GeV -rays) and inverse-Compton (IC) upscattering off star light (10 GeV -rays), resulting in two peaks in the broadband spectrum. In hadronic models (e.g., Chernyakova et al., 2006, 2009), the inverse Compton emission of high-energy electrons resulting from -decay is responsible for emission from optical up to TeV energies. In this case, the broadband spectrum is rather flat in the energy range of 0.1–100 GeV.
During the pre-periastron epoch, GeV emission at a flux level erg cm-2 s-1 is detected from mid-November through mid-December. The fitted spectrum during this period (P1) is relatively hard (). Such hardness may be consistent with the predictions of both the hadronic and the leptonic models (see below for a discussion of the leptonic interpretation during this period).
The onset of the flare-like GeV emission at the true anomaly occurred close to the disk passage at the true anomaly , suggesting that the origin of the -rays might be related to the disk passage. On one hand, the observed cut-off at several hundred MeV does not favor hadronic models. On the other hand, it may be difficult to explain the flare-like GeV emission using simple leptonic models as well. First, leptonic models predict a cut-off around 100 MeV for a synchrotron spectrum (e.g., Takata & Taam, 2009). Second, the stellar disk pushes the shock towards the pulsar when the pulsar encounters the disk. Although the increase of the magnetic field enhances the synchrotron power, it also reduces the synchrotron cooling time of the accelerated particles. As GeV photons are emitted by fast-cooling particles, these two effects should compensate each other. Consequently, the shift of the shock position due to the stellar disk cannot enhance the GeV emission to the level that we observe.
Doppler boosting may provide a plausible mechanism to produce the GeV flares during January 14 – February 3, 2011 (see also Kong et al., 2011). Numerical simulations in the hydrodynamic limit imply that the post shock bulk flow for the binary system can be accelerated into relativistic regime because of a rapid expansion of the flow in the downstream region (Bogovalov et al. 2008). For example, Dubus et al. (2010) discussed the effects of Doppler boosting on the orbital modulations of the X-ray and TeV emission. If the bulk flow is relativistic and oriented radially away from the star, the Doppler effect may be at work close to the true anomaly corresponding to the direction of the Earth (). This is approximately the time when the GeV flares were observed (i.e., ). The Doppler effect increases the photon energy as and the intensity as , where is the Doppler factor, and the spectral index. Non-prime and prime notations represent quantities in the observer and co-moving frames, respectively.
In -rays, is expected from synchrotron radiation models, which is consistent with the Fermi results. An enhancement factor of 5–10 in flux during flares (P2 and P3) compared to the emission before periastron (P1; see table 1 for details) suggests 1.5–2.
Suzaku observations indicate a low energy break, i.e., around 10 keV (Uchiyama et al., 2009). Because the photon index of the synchrotron spectrum below the break is , the enhancement factor becomes . Thus, the enhancement in X-rays is suppressed compared to -rays. It is important to obtain simultaneous observations in X-rays and gamma-rays during the flaring period to test the boosting model.
In leptonic models, the correlation between and flux (Fig. 3) may be understood as follows. If the Doppler effect is responsible for the flares, photons are boosted to higher energies and the observed synchrotron flux is amplified. However, the Doppler boost does not affect much the photon flux of the IC component, since more scatters between particles and incident photons would occur in the Klein-Nishina regime. Consequently, the increase in the IC flux by the Doppler boosting and the decrease due to the Klein-Nishina effect will compensate each other. The energy flux of the synchrotron radiation becomes much higher than the IC radiation, causing the 0.1–100 GeV spectrum to be dominated by the high-energy tail of the synchrotron spectrum. This gives rise to the steep spectrum (3; corresponding to flare emission) shown in Fig. 3. The emission before periastron (with 2) may be related to emission originating just behind the shock where the bulk Lorentz factor is 1. Some leptonic models (e.g. Takata et al. 2009; Dubus et al. 2010) have predicted similar energy fluxes of synchrotron and inverse-Compton radiation just behind the shock, hence , which is close to the observed value in the power-law fit. Although there is no evidence for two spectral components during the pre-periastron period (see Fig. 4), this possibility cannot be excluded given the relatively low significance detection, i.e., 5, during this period.
PSR B125963/LS 2883 is the third known binaries with significant detection in GeV, after LS I+ (Abdo et al., 2009b) and LS 5039 (Abdo et al., 2009c). It may be intuitive to compare the three -ray binaries:
-
1.
For LS I+61 303 and PSR B1259-63, the GeV gamma-ray peak occurs after periastron (and before apastron), though not in the same orbital phase. For LS 5039, the gamma-ray emission peaked at periastron;
-
2.
While no orbital phase-related spectral change has been reported in LS I+, the “softer when brighter” behavior of GeV -rays has been found for both LS 5039 and PSR B1259-63;
-
3.
In all three systems, spectral cutoff is observed at GeV energies during at least part of the orbit;
- 4.
PSR B125963/LS 2883 is the only system among these three for which the nature of the compact object is certain. Given the similarities of some emission features of these systems, the results presented here should shed light on the GeV radiation mechanism of the other systems.
References
- Abdo et al. (2009a) Abdo, A. A., et al. (Fermi/LAT Collaboration) 2009a, ApJS, 183, 46
- Abdo et al. (2009b) Abdo, A. A., et al. (Fermi/LAT Collaboration) 2009b, ApJ, 701, L123
- Abdo et al. (2009c) Abdo, A. A., et al. (Fermi/LAT Collaboration) 2009c, ApJ, 706, L56
- Abdo et al. (2010a) Abdo, A. A., et al. (Fermi/LAT Collaboration) 2010a, ApJS, 187, 460
- Abdo et al. (2010b) Abdo, A. A., et al. (Fermi/LAT Collaboration) 2010b, ApJS, 188, 405
- Abdo et al. (2010c) Abdo, A. A., et al. (Fermi/LAT Collaboration) 2010c, The Astronomer’s Telegram, 2780
- Abdo et al. (2010d) Abdo, A. A., et al. (Fermi/LAT Collaboration) 2010d, The Astronomer’s Telegram, 3085
- Aharonian et al. (2005) Aharonian, F. A., et al. (H.E.S.S. Collaboration) 2005, A&A, 442, 1
- Aharonian et al. (2009) Aharonian, F. A., et al. (H.E.S.S. Collaboration) 2009, A&A, 507, 389
- Anderhub et al. (2009) Anderhub, H., et al. 2009, ApJ, 706, L27
- Atwood et al. (2009) Atwood, W. B., et al. (Fermi/LAT Collaboration) 2009, ApJ, 697, 1071
- Bogovalov (2008) Bogovalov, S. V., Khangulyan, D. V., Koldoba, A. V., Ustyugova, G. V. & Aharonian, F. A. 2008, MNRAS, 387, 63
- Chernyakova et al. (2009) Chernyakova M., Neronov A., Aharonian, F., Uchiyama, Y., & Takahashi, T. 2009, MNRAS, 397, 2123
- Chernyakova et al. (2006) Chernyakova M., Neronov A., Lutovinov A., Rodriguez J., & Revnivtsev M. 2006, MNRAS, 367, 1201
- Dubus (2006) Dubus, G. 2006, A&A, 451, 9
- Dubus et al. (2010) Dubus, G., Cerutti, B. & Henri, G., 2010, A&A 516, 18
- Johnston et al. (2005) Johnston, S., Ball, L., Wang, N., & Manchester, R. N. 2005, MNRAS, 358, 1069
- Johnston et al. (1994) Johnston, S., Manchester, R. N., Lyne, A. G., Nicastro, L., Spyromilio, J. 1994, MNRAS, 268, 430
- Johnston et al. (1999) Johnston, S., Manchester, R. N., McConnell, D., Campbell-Wilson, D. 1999, MNRAS, 302, 277
- Kawachi et al. (2004) Kawachi, A., et al. 2004, ApJ, 607, 949
- Kerschhaggl (2011) Kerschhaggl, M. 2011, A&A, 525, A80
- Kong et al. (2011) Kong, A. K. H., Huang, R. H. H., Tam, P. H. T., & Hui, C. Y. 2011, The Astronomer’s Telegram, 3111
- Kong et al. (2011) Kong, S. W., Yu, Y. W., Huang, Y. F., Cheng, K. S. 2011, MNRAS, in press, preprint[arXiv:1105.3900]
- Hartman et al. (1999) Hartman, R. C., et al. 1999, ApJS, 123, 79
- Hirayama et al. (1999) Hirayama, M., Cominsky, L. R., Kaspi, V. M., Nagase, F., Tavani, M., Kawai, N., & Grove, J. E. 1999, ApJ, 521, 718
- Manchester et al. (1995) Manchester, R. N., Johnston, S., Lyne, A. G., D’Amico, N., Bailes, M., & Nicastro, L. 1995, ApJ, 445, L137
- Mattox et al. (1996) Mattox, J. R., et al. 1996, ApJ, 461, 396
- Negueruela et al. (2011) Negueruela, I., Ribó, M., Herrero, A., Lorenzo, J., Khangulyan, D., & Aharonian, F. A. 2011, ApJ, 732, L11
- Takahashi et al. (2009) Takahashi, T., et al. 2009, ApJ, 697, 592
- Takata & Taam (2009) Takata, J. & Taam, R.E., 2009, ApJ, 702, 100
- Tam et al. (2010) Tam, P. H. T., Kong, A. K. H., Huang, R. H. H., & Hui, C. Y. 2010, The Astronomer’s Telegram, 3046
- Tavani & Arons (1997) Tavani, M., & Arons, J. 1997, ApJ, 477, 439
- Tavani et al. (2010) Tavani, M., et al. 2010, The Astronomer’s Telegram, 2772
- Uchiyama et al. (2009) Uchiyama, Y., Tanaka, T., Takahashi, T., Mori, K., & Nakazawa, K. 2009, ApJ, 698, 911
- Wex et al. (1998) Wex, N., Johnston, S., Manchester, R. N., Lyne, A. G., Stappers, B. W., & Bailes, M. 1998, MNRAS, 298, 997
| Period | Year | Date | True Anomaly | Model | Photon Flux | Energy Flux | Photon Index | Cutoff Energy | TS/ | TS/ |
| (cm-2 s-1) | (erg cm-2 s-1) | (MeV) | sig. | sig. | ||||||
| P1 | 2010 | Nov 11 – Dec 14 | -115.3–2.1 | PL | (9.94.1)10-8 | (5.81.6)10-11 | 2.10.2 | 31/5.6 | ||
| P2 | 2011 | Jan 14 – Jan 22 | 111.7–120.0 | PL | (1.50.2)10-6 | (2.90.3)10-10 | 3.00.1 | 163/12.8 | ||
| PLE | (1.30.2)10-6 | (2.70.3)10-10 | 1.80.6 | 310160 | 184/13.6 | 21/4.6 | ||||
| P3 | 2011 | Jan 26 – Feb 3 | 122.2–127.2 | PL | (1.40.2)10-6 | (3.10.4)10-10 | 2.80.1 | 109/10.4 | ||
| PLE | (1.30.2)10-6 | (2.80.3)10-10 | 2.00.5 | 550330 | 117/10.8 | 8/2.8 | ||||
| P4 | 2011 | Feb 4 – Feb 21 | 127.2–135.1 | PL | (8.71.1)10-7 | (1.90.2)10-10 | 2.80.1 | 97/9.9 | ||
| PLE | (7.51.1)10-7 | (1.70.2)10-10 | 1.10.6 | 25095 | 117/10.8 | 20/4.5 |