Asymmetry and the Nucleosynthetic Signature of Nearly Edge-Lit Detonation in White Dwarf Cores
Abstract
Most of the leading explosion scenarios for Type Ia supernovae involve the nuclear incineration of a white dwarf star through a detonation wave. Several scenarios have been proposed as to how this detonation may actually occur, but the exact mechanism and environment in which it takes place remain unknown. We explore the effects of an off-center initiated detonation on the spatial distribution of the nucleosynthetic yield products in a toy model – a pre-expanded near Chandrasekhar-mass white dwarf. We find that a single-point near edge-lit detonation results in asymmetries in the density and thermal profiles, notably the expansion timescale, throughout the supernova ejecta. We demonstrate that this asymmetry of the thermodynamic trajectories should be common to off-center detonations where a small amount of the star is burned prior to detonation. The sensitivity of the yields on the expansion timescale results in an asymmetric distribution of the elements synthesized as reaction products. We tabulate the shift in the center of mass of the various elements produced in our model supernova and find an odd-even pattern for elements past silicon. Our calculations show that off-center single-point detonations in carbon-oxygen white dwarfs are marked by significant composition asymmetries in their remnants which bear potentially observable signatures in both velocity and coordinate space, including an elemental nickel mass fraction which varies by a factor of two to three from one side of the remnant to the other.
Subject headings:
nuclear reactions, nucleosynthesis, abundances — supernovae: general — white dwarfs1. Introduction
The fact that their peak absolute magnitude is correlated with the width of the light curve has allowed Type Ia supernovae (SNe Ia) to be used as standard candles in determining cosmological distances. Despite this widespread use of SNe Ia as standard candles, many problems in describing how the explosion of the star happens still remain.
A number of models have been proposed to explain SNe Ia (for a review, see Hillebrandt & Niemeyer, 2000; Podsiadlowski et al., 2008). Two promising candidates for an explosion mechanism are the sub-Chandrasekhar double detonation model (Woosley & Weaver, 1994; Fink et al., 2010) and the gravitational confined detonation (GCD) model (Plewa et al., 2004). In both models, most if not all of the nuclear burning occurs in a detonation wave. In the sub-Chandrasekhar model a layer of helium is deposited on the surface of a white dwarf. The helium layer detonates resulting in a shock wave traveling around the surface of the white dwarf. When the shock wave converges at the antipode, a detonation is thought to be triggered off center in the carbon-oxygen core (Woosley & Weaver, 1994; Fink et al., 2010; Sim et al., 2010). The nucleosynthetic yield is set predominantly by the mass of the carbon-oxygen white dwarf core and the mass of the helium layer (Woosley & Weaver, 1994; Fink et al., 2010).
In the GCD model, the carbon burning runaway within the convective core of a near Chandrasekhar-mass white dwarf is postulated to occur in a small region displaced from the stellar center that becomes a highly buoyant flame bubble and quickly rises to the stellar surface after burning only a few percent of the star during its ascent (e.g. Plewa et al., 2004; Livne et al., 2005). When the buoyant ash, as well as unburned material pushed ahead of the rising flame bubble, erupts forth from the stellar core it is largely confined to the surface of the white dwarf by gravity. It then becomes a strong surface flow that sweeps completely over the star, eventually converging in a region opposite to the breakout location. Although the details of the detonation initiation process is still a topic of active research (see e.g., Röpke et al., 2007; Seitenzahl et al., 2009a, b) the high temperatures and densities reached within the converging surface flow are strong indicators that a detonation is likely to be triggered.
The resulting GCD nucleosynthetic yield consists almost entirely of detonation burning products and depends on how much the star has expanded by the time the detonation initiates. More highly expanded (hence lower density) cores at detonation result in a smaller fraction of Fe peak nuclei, less , and consequently a larger fraction of intermediate mass elements (IMEs) due to incomplete relaxation to nuclear statistical equilibrium (NSE). Therefore, lower luminosity (less producing) explosions are accompanied by a larger yield of IMEs, as has been observed (see e.g., Mazzali et al., 2007).
The expansion of the star prior to detonation, in a GCD scenario, results from the work done by the rising flame bubble. Deflagrations that burn more mass prior to reaching the stellar surface excite higher amplitude pulsations and hence more-expanded stars at the time of detonation. It has been found that the expansion of the star due to the deflagration is very well represented by the fundamental radial pulsation mode of the underlying white dwarf (see Fig. 2 and Fig. 12 in Meakin et al., 2009). Therefore, while it is essential to understand the nature of the deflagration so as to better understand the mapping between initial conditions and final outcomes, the range of outcomes due to the deflagration can be parameterized by the pulsation amplitude, resulting in a one parameter family of models. While the phase of the pulsation at the time of detonation is an additional parameter, it plays a lesser role since the pulsation period is longer then the detonation crossing time.
In this Paper we explore the nucleosynthetic yields that result from an edge-lit detonation of a pre-expanded near Chandrasekhar-mass white dwarf core out of hydrostatic equilibrium. For our purposes we define edge-lit detonation to be an off-center detonation where very little of the star has burned before hand. This is a toy-model which neglects the effect the deflagration has on the nucleosynthesis. However, due to the small amount of mass burned in the deflagration it captures most of the essential features of the GCD model. The physical mechanism that gives rise to the abundance asymmetries in the ejecta will furthermore manifest itself in other off-center detonation models, such as the sub-Chandrasekhar double detonation models.
In Section 2 we describe the explosion model and our computational method. Section 3 is comprised of three parts. First, we discuss how the dynamics of an asymmetric detonation affect the hydrodynamic profile of the SN Ia remnant. We then consider how variations in the thermodynamic trajectories of detonated material affect the resulting nucleosynthesis. Finally, we present the elemental yields found for our explosion model and quantify the asymmetric distribution thereof in terms of center of mass offsets, which we provide in tabulated form. We also show that there is an asymmetric distribution in velocity space for elemental nickel. We then conclude in Section 4, with a discussion of how our results relate to previous work and how our work can be improved.
2. The Explosion Model
The explosion model discussed in this paper involves the detonation of a cold (T=) white dwarf of mass , comprised of 50% and 50% by mass, which has been expanded according to its fundamental radial-pulsation mode by such an amplitude that it has a central density of . A detonation is initiated in this expanded white dwarf at a radial location of cm, where the density of the white dwarf is , by heating a small spherical volume with radius km to high temperature K. This heating immediately triggered a detonation which propagates away from the point of initiation.
The subsequent reactive-hydrodynamic evolution of the detonated white dwarf was conducted using the FLASH code (Fryxell et al., 2000). The code framework and the included physics is identical to that described in Meakin et al. (2009). The star was set up on a Cartesian grid in 2D with cylindrical symmetry. An effective adaptive mesh refinement resolution of 1 is used. The detonation was initiated along the symmetry axis, which is the only natural way to capture its evolution in this geometry. Due to the cylindrical symmetry of the physical scenario and the lack of large scale instability in the detonation front this setup gives the same results as a full 3D calculation of the same problem (see Meakin et al. (2009) which provides an in depth description of the detonation phase, and a comparison between 2D and 3D).
Energy release and bulk compositional evolution due to nuclear burning is coupled to the hydrodynamic flow by advancing a system of progress variables which represent three stages of burning: (1) the burning of carbon and oxygen to silicon group elements, (2) the relaxation of the silicon group elements to NSE, and (3) the evolution of material which has already relaxed entirely to NSE, including its adjustment to changing density and temperature and neutronization due to weak interactions among the Fe peak elements. Additional details can be found in Calder et al. (2007); Meakin et al. (2009).
The pre-expansion of the white dwarf prior to detonation initiation results in of high density material (), which burns to NSE in the detonation (primarily as ). The remaining of material burns to IMEs, e.g. Si, S, Ca, and Ar, resulting in only a small amount () of unburned C/O in the outermost layers of the remnant.
Detailed yields are calculated by post processing Lagrangian tracer particles included in the explosion calculation and are the primary focus of this paper. We recorded the time history of 104 particles which were initialized to evenly sample the initial mass of the white dwarf. Our reaction network incorporates 493 nuclides from n to (Table 1). We use the reaction rates from the Joint Institute for Nuclear Astrophysics reaclib Database111http://groups.nscl.msu.edu/jina/reaclib/db/ (Cyburt et al., 2010, and references therein); the light-element rates are mostly experimental and are from compilations such as Caughlan & Fowler (1988) and Iliadis et al. (2001). Weak reaction rates are taken from Fuller et al. (1982) and Langanke & Martínez-Pinedo (2001). Screening is incorporated using the formalism of Graboske et al. (1973).
| El. | El. | El. | El. | ||||
|---|---|---|---|---|---|---|---|
| n | |||||||
| H | 1–3 | Ne | 17–28 | K | 35–46 | Ni | 50–73 |
| He | 3–4 | Na | 20–31 | Ca | 35–53 | Cu | 54–70 |
| Li | 6–8 | Mg | 20–33 | Sc | 40–53 | Zn | 55–72 |
| Be | 7, 9–11 | Al | 22–35 | Ti | 39–55 | Ga | 58–73 |
| B | 8, 10-14 | Si | 22–38 | V | 43–57 | Ge | 59–76 |
| C | 9–16 | P | 26–40 | Cr | 43–60 | As | 62–76 |
| N | 12–20 | S | 27–42 | Mn | 46–63 | Se | 62–82 |
| O | 13–20 | Cl | 31–44 | Fe | 46–66 | Br | 71–81 |
| F | 15–24 | Ar | 31–47 | Co | 50–67 | Kr | 71–86 |
3. Results
3.1. Explosion Dynamics and Remnant Asymmetry
The detonation propagates from the point of initiation at nearly the Chapman–Jouguet (CJ) speed, at a Mach number of . Because of the weak upstream density dependence of the detonation speed under these conditions, the detonation front remains very nearly spherical in shape as it engulfs the star. The total time required for its passage across the expanded white dwarf core is . This is followed by a period of in which the pressure forces drive the completely incinerated remnant into a homologous expansion, characterized by a purely radial expansion velocity profile with an expansion rate proportional to the radial position . After only a few seconds, the remnant is expanding ballistically, and the total energy budget is dominated by the kinetic energy. The homologous velocity profile results in a self-similar density profile which persists until the remnant begins to interact with the interstellar medium.
The expanding remnant resulting from the detonation is marked by significant asymmetry. The late time density profiles along the symmetry axis and the equator are shown in Fig 1, scaled by the peak density in the remnant . The initial, spherically symmetric white dwarf density profile is also shown for comparison. It can be seen that the density peak is shifted into the hemisphere in which the detonation was initiated, in this case, resulting in a steeper density gradient in this hemisphere. This is in agreement with the series of GCD simulations described in Meakin et al. (2009)(see their Fig. 9 - 11) which show that the density isocontours in the remnant are well described by concentric circles that have centers offset from the initial stellar center. The density isocontours were found to have larger offsets at higher densities, with the largest offset centered on the peak density in the remnant. In all cases the density peaks on the side of the remnant where the detonation originated and has a steeper density gradient in that region.
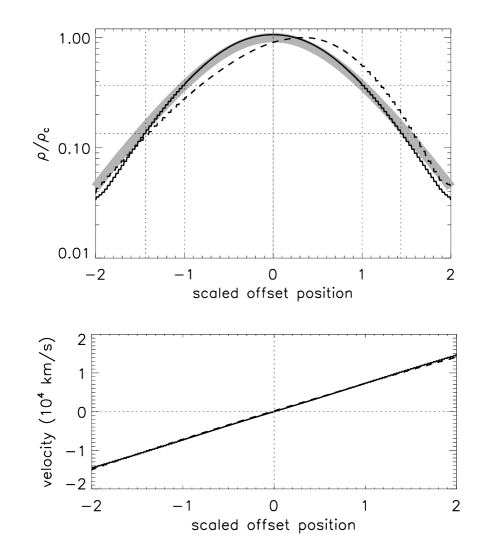
Unlike the density profile, the velocity profile (also shown in Fig. 1) does not show an asymmetry, but is everywhere radially directed and spherically symmetric. This leads to an asymmetry in the density as a function of expansion velocity, which is likely to result in a viewing angle dependence for the light curve and the spectral signature. Related composition asymmetries, discussed in §§3.2 and 3.3 below, also contribute to observable asymmetries and viewing angle dependencies.
A revealing format for presenting the dynamics of the detonation and the subsequent expansion is the space-time diagram. In Fig. 2 we present the space-time trajectories for all of the tracer particles that were initialized near the symmetry axis of the white dwarf. The left panel shows the time period over which the detonation traverses the stellar core, while in the right panel we show the later time evolution that ends in a radially expanding, ballistic trajectory for each of the particles. The bold dashed line in the left panel shows the path taken by a theoretical detonation having a constant speed, which matches the kinks in the particle trajectories very well.


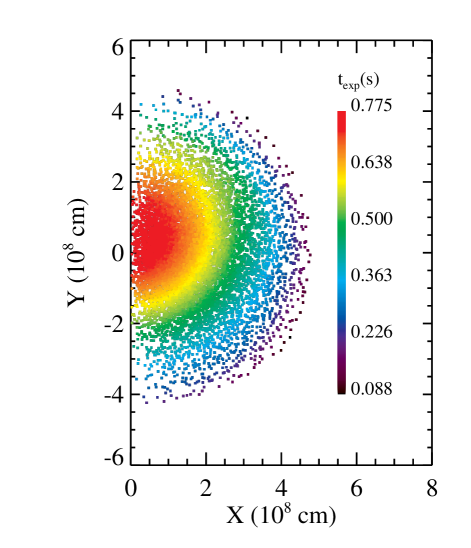
The following features in this figure merit further discussion. (1) The trajectories are slowly converging prior to detonation. This is the signature of the stellar core undergoing mild contraction as a result of having been expanded by a radial pulsation mode prior to detonation. (2) The detonation accelerates material in the direction it is propagating. This is the primary source of the asymmetry imprinted on the remnant at late times. A large number of Lagrangian tracer particles in the detonated hemisphere are first accelerated towards the stellar center by the detonation before they are turned around by pressure forces and accelerated to their final, outwardly directed expansion velocities. The exact number of tracer particles accelerated towards the stellar center by the detonation is dependent on distance from the center of the star to the point where the detonation was initiated, . A given tracer particle with a central angle and distance from the center of the star will be accelerated towards the center of the star if . On the other hand, tracers in the opposite hemisphere are accelerated by the detonation in the same direction as their final expansion velocity, reaching their final velocity on a shorter timescale. (3) The material in the detonated hemisphere is accelerated to lower velocities overall compared to material in the opposite hemisphere (see Fig. 2 (right)). This mapping between initial position (and therefore initial density) and resultant expansion velocity explains the density profile: the material lines in the more rapidly expanding hemisphere are stretched out over a larger region of space, and hence to a lower relative density, than the more slowly expanding regions. (4) A natural consequence of the explosion dynamics is an asymmetry in the expansion timescale , defined as the time required for the detonated material to drop from its post-detonation temperature maximum to , resulting from the differential rate at which material cools (nearly adiabatically) due to the post-detonation expansion. This follows directly from point (2) above. The expansion timescale asymmetry is shown in Fig. 3 where we have plotted the tracer particles at their initial position in the stellar core, color coded by their post-detonation expansion timescale. It is obvious from this figure that the material in the detonated hemisphere has overall a larger expansion timescale than in the opposite hemisphere for a given initial upstream density. As will be discussed in §§3.2 and 3.3 this expansion timescale distribution imparts an asymmetry in the resultant nucleosynthetic yield.
3.2. Nucleosynthesis Dependence
We find that nuclear burning in SNe Ia progresses in three distinct stages (Khokhlov, 1983, 1991). The first stage is carbon burning. During carbon burning + is the primary reaction taking place. We find that carbon burning never reaches an equilibrium state in a small region of the star where the final carbon mass fraction is above . The carbon burning reactions are sensitive to temperature with
| (1) |
Here is change in abundance over change in time, is temperature in units , and is a function defining the temperature effect on the branching ratio between the and reaction (Caughlan & Fowler, 1988). Any change in the thermal profile will result in a different abundance pattern for material that does not proceed to the next phase of burning.
The next stage is oxygen burning. Here and the products of carbon burning proceed to silicon group elements, like S, Ar, and Si. As in carbon burning, oxygen burning never reaches an equilibrium state and therefore also shows a dependence on the thermal history. We find if the next burning stage did not start. Very little mass of the star () is in a region that does not complete either carbon or oxygen burning, so most of the star proceeds to the next burning stage.
At higher temperatures and densities, silicon burning is the dominant form of nucleosynthesis. In silicon burning groups of nuclides enter into equilibrium; a state known as quasi-statistical equilibrium (QSE; e.g., Woosley et al., 1973). There are two ways in which changing the expansion time scale can affect the abundances in QSE. First, while equilibrium holds within a group of nuclides, it does not hold between groups. Second, within a group of nuclides in equilibrium reactions freeze out at different temperatures, resulting in an abundance pattern that depends on the expansion time scale. This will be further explored below.
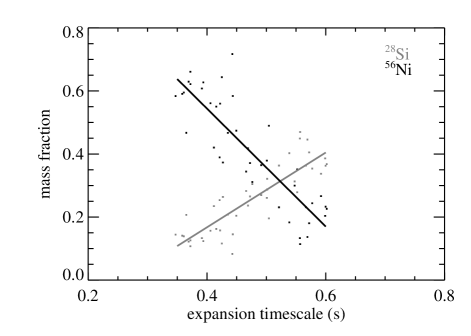
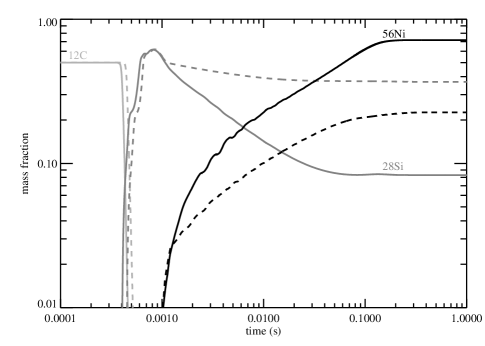
Fig. 4 shows how the abundances of silicon and nickel vary as functions of expansion time scale over a small range of temperatures for tracer particles that never finish silicon burning. Even with the scatter from plotting particles with different peak temperatures, there is a clear dependence of the abundances on expansion timescale. The directions of these trends are counterintuitive, but Fig. 5 shows their origin. Both tracer particles shown reach a peak temperature of , and their nucleosynthesis is nearly identical up to that point. The particle with the longer thermal expansion time scale, however, has a temperature that falls faster over the first than the particle with the shorter thermal expansion time scale. This rapid decrease in temperature results in less burned to even though the thermal expansion time scale is longer.

Material exposed to high enough density and temperature conditions for long enough will arrive in a state of nuclear statistical equilibrium (NSE). In this state all nuclear reactions enter equilibrium and lose all history of the thermal evolution up to that point. For material that has reached this state, the only dependence that the final yield has on expansion timescale occurs during the process of freeze out. Freeze out occurs for a nuclide when the temperature drops low enough that all strong reactions become too slow to change the nuclides abundance again. Because this condition occurs at different temperatures for different nuclides, the final yield depends on the rate at which material cools. Like in QSE, different reactions freeze out at different temperatures, leading to yields that depend on the expansion timescale. Therefore, all three stages of burning and NSE in SNe Ia are affected by different expansion time scales, resulting in a clear compositional asymmetry that will be discussed in the following section.
3.3. Phenomenology
We now present the results of our reaction network calculations for a near edge-lit detonation in a SN Ia model. We find that a number of nuclides exhibit pronounced asymmetries across the stellar remnant. We quantify this effect by calculating the center of mass for a given element. Suppose a tracer particle has a mass fraction of element , and its position is given by vector . Then the center of mass for a given element, , is given by the equation
| (2) |
Due to the cylindrical symmetry of our explosion model the displacement of the center of mass for any element lies along the y axis. A velocity for the center of mass can be calculated by replacing by the velocity in equation 2. Table 2 shows the total mass, displacement of the center of mass, and velocity of the center of mass for elements between carbon and germanium. For reference, the detonation was initiated at . These numbers are correct for the end of our simulation , where strong reactions have frozen out and homologous expansion has been reached. Some of the isotopes making these elements, for example, decay so Table 2 evolves with time. The last three columns show the total mass, displacement of the center of mass, and velocity of the center of mass assuming all radioactive elements instantly decayed to their stable isotopes. Note that nickel shows no change in center of mass or velocity since most of the mass of the star ends up as radioactive nickel in our model. If the complete star was burned to nickel then by definition the change in center of mass would be zero since our model conserves mass and momentum. Elements lighter than silicon have their masses distributed more in the direction where the detonation was initiated. Elements heavier than silicon are, for the most part, distributed away from where the detonation was initiated. These elements also display an odd-even pattern where odd Z nuclei, like cobalt and copper, are predominantly distributed farther away from the start of the detonation than their even Z counterparts, like iron and zinc. This asymmetry is due to the different thermal histories of the two sides of the star affecting the nucleosynthesis as outlined in §§3.2.
| mass | mass | |||||
|---|---|---|---|---|---|---|
| C | 29.1 | 9.9 | 9.00 | 29.1 | 9.9 | 9.00 |
| N | 18.2 | 6.2 | 2.91 | 11.6 | 4.1 | 8.41 |
| O | 7.30 | 2.4 | 7.28 | 7.30 | 2.4 | 7.28 |
| F | 27.9 | 9.4 | 2.19 | 35.2 | 12. | 3.34 |
| Ne | 28.7 | 9.9 | 1.03 | 28.7 | 9.9 | 1.03 |
| Na | 25.6 | 8.8 | 1.12 | 22.3 | 7.6 | 5.69 |
| Mg | 13.8 | 4.9 | 1.37 | 13.8 | 4.9 | 1.37 |
| Al | 21.6 | 7.5 | 1.74 | 18.5 | 6.4 | 3.13 |
| Si | -1.09 | -0.6 | 2.18 | -1.09 | -0.6 | 2.18 |
| P | -4.44 | -1.9 | 8.34 | 3.77 | 1.2 | 4.87 |
| S | -2.68 | -1.2 | 1.18 | -2.68 | -1.2 | 1.18 |
| Cl | -9.31 | -3.7 | 1.82 | -4.28 | -1.8 | 1.21 |
| Ar | -2.95 | -1.3 | 2.60 | -2.94 | -1.3 | 2.60 |
| K | -4.53 | -1.7 | 5.12 | -4.20 | -1.7 | 3.66 |
| Ca | -2.55 | -1.1 | 2.80 | -2.56 | -1.1 | 2.80 |
| Sc | -3.36 | -1.3 | 2.02 | -9.21 | -3.7 | 1.57 |
| Ti | -2.78 | -1.1 | 3.93 | -2.35 | -1.0 | 7.54 |
| V | -2.04 | -0.7 | 3.68 | -3.91 | -1.5 | 2.45 |
| Cr | -2.37 | -1.0 | 7.60 | -1.81 | -0.8 | 1.71 |
| Mn | -3.68 | -1.4 | 2.58 | -6.01 | -2.4 | 2.91 |
| Fe | -1.80 | -0.8 | 1.71 | 0.00 | 0.0 | 2.16 |
| Co | -5.59 | -2.2 | 3.06 | -3.49 | -1.3 | 2.57 |
| Ni | 0.00 | 0.0 | 2.16 | 0.13 | 0.1 | 3.52 |
| Cu | -3.06 | -1.1 | 4.68 | -2.08 | -0.7 | 2.46 |
| Zn | 0.17 | 0.1 | 2.93 | -1.49 | -0.5 | 6.46 |
| Ga | -2.09 | -0.7 | 3.09 | -0.83 | -0.3 | 3.54 |
| Ge | -1.48 | -0.5 | 6.31 | -0.47 | -0.1 | 3.11 |
Our simulation was not run sufficiently past freeze out to allow all beta unstable nuclei to decay. However, if we decay the unstable nuclei and group them in elemental abundances, we find elemental nickel to have a clear gradient over the star. In material not burned to NSE we find the mass fraction of elemental nickel between and central angle to each tracer particle to increase by a factor of 2–3. Figure 6 shows the dependence of elemental nickel on central angle to each tracer particle.

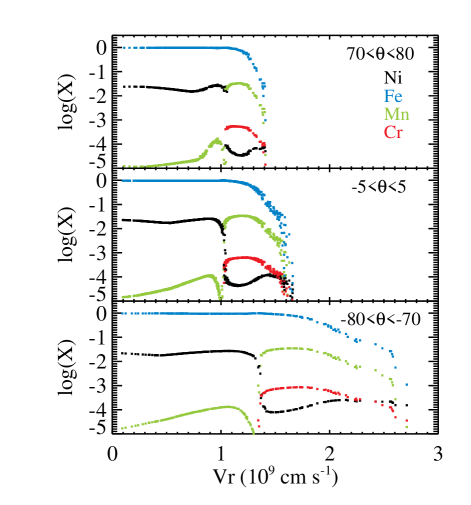
An interesting side effect of the different expansion times is that material on opposite sides of the star expands at different velocities. This leads to a gradient in velocity space. Figure 7 shows how elemental nickel, iron, manganese, and chromium vary with radial velocity for different central angles. In material not burned to NSE, the part of the remnant with the most nickel is also the part with the highest radial velocity. This is self-consistent since the nickel mass fraction is greater on the side of the remnant with the shortest expansion time. Therefore, it follows it should have the highest radial velocity.
4. Discussion
We have computed the abundances and spatial distributions of nuclides in an explosion of an expanded near Chandrasekhar-mass white dwarf resulting from an off-center initiated detonation, a toy model that captures the thermodynamic profile of some SN Ia explosion models. We find a compositional asymmetry in the ejecta produced by the detonation. This compositional asymmetry is connected with the thermal expansion time scale. The different expansion timescales also result in a compositional asymmetry in velocity space.
It is difficult to establish the observable features of our model since we have not conducted radiative transfer calculations to generate light curves and spectra. It is currently unclear how much of an observational effect this asymmetry will have. A series of synthetic spectra generated over a range of time allows for direct comparison with observed supernovae. We conjecture, that even if compositional effects are obscured the spectra will show some dependence on observing angle. This is because the side of the remnant that expands at higher velocities will also be at a lower density, making it more transparent at earlier times.
Even though it is difficult to determine observational features of our model, it is instructive to compare and contrast our model with other recent results. The ‘toy model’ in Hillebrandt et al. (2007) and Sim et al. (2007) is constructed similarly to our calculated yield distribution. They found that off-center distributions of burned material are likely to leave detectable imprints on observed light curves. An angular dependence of the light-curve peak brightness is introduced that might explain some over luminous SNe Ia.
Our model has no deflagration ash so comparisons with deflagration to detonation models, like Livne (1999), is problematic. We can compare to Maeda et al. (2010), who showed that expansion velocity gradients as inferred from the Si II absorption feature could be explained by a velocity shift of in Si happening in an ‘opening angle’ away from the ignition points caused by deflagration ash. Even though our model has no deflagration ash a similar effect occurs with having ejection velocities faster on the side of the star opposite of the detonation. The ejecta in our model, however, do not have a sharp transition in velocity but a gradual increase in velocity starting at a point away from the ignition point. It is difficult to determine if our model can reproduce the observed velocity gradients. It is worth noting that the deflagration to detonation transition model used in (Maeda et al., 2010) did not produce the observed velocity shift or ‘opening angle’ either.
Kasen & Plewa (2005) attempted to calculate the spectral signatures of GCD by considering ejecta interacting with an extended atmosphere. The ejecta in their model were calculated from a 1-D simulation, and therefore lack the asymmetry in the nucleosynthesis that the reaction network calculations of our 2-D simulation find. In (Kasen & Plewa, 2007) nucleosynthesis was done approximately with a 13 element reaction network. The surface flow, which consists partly of deflagration ash, which was excluded from our present model, needs to be considered. The surface flow might also have a spectral signature itself such as the presence of an high-velocity calcium absorber (Kasen & Plewa, 2005) and should be compared with the underlying compositional asymmetry. In the case of sub-Chandrasekhar models, detonation of a pure helium shell leads to a layer containing iron-group elements such as titanium and chromium around the core ejecta (Fink et al., 2010; Sim et al., 2010; Kromer et al., 2010).
Another item to consider is that we do not include the effects of metallicity on the nucleosynthesis. Our model is initially composed of and . However, it has been shown that prior to the explosion of a carbon-oxygen white dwarf in a SN Ia there is a long period during which some is converted into as well as heavier elements (Chamulak et al., 2008). This process makes even the most metal poor SNe Ia have a composition of more diverse than pure and . It is worth mentioning that for deflagration–detonation transition (DDT) models where the detonation density was allowed to vary in relation to the flame speed as a function of metallicity (Chamulak et al., 2007) the yield of produced also varied with metallicity (Bravo et al., 2010; Jackson et al., 2010). DDT models with varying metallicity and fixed detonation density, however, showed little variation in outcome (Townsley et al., 2009).
References
- Bravo et al. (2010) Bravo, E., Domínguez, I., Badenes, C., Piersanti, L., & Straniero, O. 2010, ApJ, 711, L66
- Calder et al. (2007) Calder, A. C., Townsley, D. M., Seitenzahl, I. R., Peng, F., Messer, O. E. B., Vladimirova, N., Brown, E. F., Truran, J. W., & Lamb, D. Q. 2007, ApJ, 656, 313
- Caughlan & Fowler (1988) Caughlan, G. R. & Fowler, W. A. 1988, At. Data Nucl. Data Tables, 40, 283
- Chamulak et al. (2007) Chamulak, D. A., Brown, E. F., & Timmes, F. X. 2007, ApJ, 655, L93
- Chamulak et al. (2008) Chamulak, D. A., Brown, E. F., Timmes, F. X., & Dupczak, K. 2008, ApJ, 677, 160
- Cyburt et al. (2010) Cyburt, R. H., Amthor, A. M., Ferguson, R., Meisel, Z., Smith, K., Warren, S., Heger, A., Hoffman, R. D., Rauscher, T., Sakharuk, A., Schatz, H., Thielemann, F. K., & Wiescher, M. 2010, ApJS, 189, 240
- Fink et al. (2010) Fink, M., Röpke, F. K., Hillebrandt, W., Seitenzahl, I. R., Sim, S. A., & Kromer, M. 2010, A&A, 514, A53+
- Fryxell et al. (2000) Fryxell, B., Olson, K., Ricker, P., Timmes, F. X., Zingale, M., Lamb, D. Q., MacNeice, P., Rosner, R., Truran, J. W., & Tufo, H. 2000, ApJS, 131, 273
- Fuller et al. (1982) Fuller, G. M., Fowler, W. A., & Newman, M. J. 1982, ApJS, 48, 279
- Graboske et al. (1973) Graboske, H. C., Dewitt, H. E., Grossman, A. S., & Cooper, M. S. 1973, ApJ, 181, 457
- Hillebrandt & Niemeyer (2000) Hillebrandt, W. & Niemeyer, J. C. 2000, ARA&A, 38, 191
- Hillebrandt et al. (2007) Hillebrandt, W., Sim, S. A., & Röpke, F. K. 2007, A&A, 465, L17
- Iliadis et al. (2001) Iliadis, C., D’Auria, J. M., Starrfield, S., Thompson, W. J., & Wiescher, M. 2001, ApJS, 134, 151
- Jackson et al. (2010) Jackson, A. P., Calder, A. C., Townsley, D. M., Chamulak, D. A., Brown, E. F., & Timmes, F. X. 2010, ApJ, 720, 99
- Kasen & Plewa (2005) Kasen, D. & Plewa, T. 2005, ApJ, 622, L41
- Kasen & Plewa (2007) —. 2007, ApJ, 662, 459
- Khokhlov (1983) Khokhlov, A. M. 1983, Soviet Astronomy Letters, 9, 160
- Khokhlov (1991) —. 1991, A&A, 245, 114
- Kromer et al. (2010) Kromer, M., Sim, S. A., Fink, M., Röpke, F. K., Seitenzahl, I. R., & Hillebrandt, W. 2010, ApJ, 719, 1067
- Langanke & Martínez-Pinedo (2001) Langanke, K. & Martínez-Pinedo, G. 2001, At. Data Nucl. Data Tables, 79, 1
- Livne (1999) Livne, E. 1999, ApJ, 527, L97
- Livne et al. (2005) Livne, E., Asida, S. M., & Höflich, P. 2005, ApJ, 632, 443
- Maeda et al. (2010) Maeda, K., Benetti, S., Stritzinger, M., Röpke, F. K., Folatelli, G., Sollerman, J., Taubenberger, S., Nomoto, K., Leloudas, G., Hamuy, M., Tanaka, M., Mazzali, P. A., & Elias-Rosa, N. 2010, Nature, 466, 82
- Mazzali et al. (2007) Mazzali, P. A., Röpke, F. K., Benetti, S., & Hillebrandt, W. 2007, Science, 315, 825
- Meakin et al. (2009) Meakin, C. A., Seitenzahl, I., Townsley, D., Jordan, G. C., Truran, J., & Lamb, D. 2009, ApJ, 693, 1188
- Plewa et al. (2004) Plewa, T., Calder, A. C., & Lamb, D. Q. 2004, ApJ, 612, L37
- Podsiadlowski et al. (2008) Podsiadlowski, P., Mazzali, P., Lesaffre, P., Han, Z., & Förster, F. 2008, New A Rev., 52, 381
- Röpke et al. (2007) Röpke, F. K., Woosley, S. E., & Hillebrandt, W. 2007, ApJ, 660, 1344
- Seitenzahl et al. (2009a) Seitenzahl, I. R., Meakin, C. A., Lamb, D. Q., & Truran, J. W. 2009a, ApJ, 700, 642
- Seitenzahl et al. (2009b) Seitenzahl, I. R., Meakin, C. A., Townsley, D. M., Lamb, D. Q., & Truran, J. W. 2009b, ApJ, 696, 515
- Sim et al. (2010) Sim, S. A., Röpke, F. K., Hillebrandt, W., Kromer, M., Pakmor, R., Fink, M., Ruiter, A. J., & Seitenzahl, I. R. 2010, ApJ, 714, L52
- Sim et al. (2007) Sim, S. A., Sauer, D. N., Röpke, F. K., & Hillebrandt, W. 2007, MNRAS, 378, 2
- Townsley et al. (2009) Townsley, D. M., Jackson, A. P., Calder, A. C., Chamulak, D. A., Brown, E. F., & Timmes, F. X. 2009, ApJ, 701, 1582
- Woosley et al. (1973) Woosley, S. E., Arnett, W. D., & Clayton, D. D. 1973, ApJS, 26, 231
- Woosley & Weaver (1994) Woosley, S. E. & Weaver, T. A. 1994, ApJ, 423, 371