On the puzzling plateau in the specific star formation rate at
Abstract
The observational indications for a constant specific star-formation rate (sSFR) in the redshift range are puzzling in the context of current galaxy-formation models. Despite the tentative nature of the data, their marked conflict with theory motivates a study of the possible implications. The plateau at is hard to reproduce because (a) its level is low compared to the cosmological specific accretion rate at , (b) it is higher than the latter at , (c) the natural correlation between SFR and stellar mass makes it difficult to manipulate their ratio, and (d) a low SFR at high makes it hard to produce enough massive galaxies by . Using a flexible semi-analytic model, we explore ad-hoc modifications to the standard physical recipes trying to obey the puzzling observational constraints. Successful models involve non-trivial modifications, such as (a) a suppressed SFR at in galaxies of all masses, by enhanced feedback or reduced SFR efficiency, following an initial active phase at , (b) a delayed gas consumption into stars, allowing the gas that was prohibited from forming stars or ejected at high to form stars later in more massive galaxies, and (c) enhanced growth of massive galaxies, in terms of either faster assembly or more efficient starbursts in mergers, or by efficient star formation in massive haloes.
keywords:
galaxies: statistics – galaxies: evolution – galaxies: formation – galaxies: high-redshift1 Introduction
The bulk of the stellar mass observed today in galaxies is built up at high redshift, where star formation and mass assembly are very efficient. This makes observations at high redshift extremely important in understanding galaxy evolution in general. For example, the maximum value of the mean cosmological star-formation rate (SFR) density is achieved at redshift 1–3 (e.g. Hopkins & Beacom 2006).
Although high redshift observations are naturally plagued with larger uncertainties than local data, it is clear that a successful model of galaxy formation and evolution should match them within realistic error margins. Current models are often mainly tuned to reproduce the low redshift universe, and it is therefore very instructive to test them against high redshift observations. For example, Fontanot et al. (2009) and Guo et al. (2010) point out that the low mass end of the stellar mass function is built too quickly at high redshift in current semi-analytic models (SAMs hereafter), while Khochfar et al. (2007) claim that their SAM can reproduce the evolution of the faint end of the luminosity function. It seems however likely that the evolution of the stellar mass function over time alone is insufficient to fully constrain the models, as was argued by Neistein & Weinmann (2010). Consequently, it is a crucial next step to compare the observed SFR of high redshift galaxies to models in more detail than previously done, where the main focus was in trying to match the global star formation rate density.
Pioneering observational estimates of the SFR () and stellar mass () indicate that the specific SFR (sSFR, ) is roughly constant in time throughout the redshift range , for galaxies with roughly the same mass , at a level . (e.g. Stark et al. 2009a; González et al. 2010; Labbé et al. 2010a, 2010b). There are indications that this sSFR plateau is associated with a rather constant sSFR within each galaxy as it grows (Papovich et al. 2010; Stark et al. 2009a). The plateau is hard to reconcile with the current theoretical wisdom for several reasons.
In current models of galaxy formation the high- SFR is assumed to a large extent to be driven by the fresh gas supply (see Kereš et al. 2005; Dekel et al. 2009; Bouché et al. 2010; and basically all the SAM; but see also Narayanan et al. 2010 who discuss a potential merger origin for the population of submillimeter galaxies at ). The specific cosmological accretion rate of baryons is steeply declining with time, (Neistein & Dekel 2008; Dekel et al. 2009). In particular, at the specific accretion rate is higher than the observed sSFR by a factor of a few, and at it is lower than the sSFR by a similar factor. This is in marked contrast to the observed plateau in the sSFR. A constant sSFR during the evolution of each galaxy (main progenitor) would require either an exponential growth in time of and (this is if most stars are formed in situ to the main progenitor), or a non-trivial combination of effective SFR and stellar assembly rate as a function of time and mass. An obvious related difficulty is introduced by the fact that a low SFR at high could make it hard to produce enough massive galaxies by to match the bright end of the observed galaxy mass function at that epoch.
Given the marked contrast between the indicated observation and the current models of galaxy formation, we appeal to a special semi-analytic tool. Traditional SAMs (e.g Kauffmann et al. 1993; Cole et al. 2000; De Lucia & Blaizot 2007) describe the processes that are responsible for galaxy evolution by physically motivated recipes that are fixed a priori. They are thus geared to solve the ‘forward problem’, i.e., test to what extent the assumed set of physical recipes provides a match to the observed properties of the galaxy population. This methodology is not ideal for exploring a large variety of physical recipes, some of which may need to deviate significantly from the standard assumptions. Our approach here is to solve the ‘inverse problem’, where we investigate how the observations at high z constrain the basic recipes, especially those associated with the processes of mergers, star formation, and feedback. This is achievable using the method of Neistein & Weinmann (2010, NW10 hereafter), which allows freedom in choosing the recipes of interest, and a very efficient exploration of a broad parameter space.
In order to reproduce the sSFR plateau, we will try to either lower the SFR efficiency after a very short period of high efficiency at , or to enhance the suppression of SFR by feedback at , especially in high-mass haloes, to be followed by an enhanced SFR in the retained or reincorporated gas at . In both cases, the low sSFR at high makes it difficult to form enough massive galaxies at , unless the rate of mass assembly due to mergers and the associated starbursts are pushed to their limits.
The models presented in this paper are not a priori physically motivated. However, we have tried to keep them simple, and to minimize deviations both from the standard model and from a monotonic dependence on halo mass and time. We also try to keep the models as physically plausible as possible. Our aim in this paper is not to find the “right” model. The main goal is to investigate the approximate nature of the needed changes, and how they impact on the properties of the galaxy population other than the sSFR.
The measurements of SFR and stellar mass at high are still at their infancy, and therefore their interpretation, in particular the sSFR plateau, is uncertain and highly controversial. The main source of uncertainty is the obscuration by dust, where several authors bring convincing arguments for little or no dust at (e.g. Bouwens et al. 2009; Finkelstein et al. 2010), while others do apply dust corrections and obtain higher values of sSFR. Stellar masses may also be affected by systematic errors. For example, uncertainties in the treatment of the TP AGB-phase may lead to errors in the stellar mass estimates at by factors of 2 (e.g. Maraston et al. 2006; Magdis et al. 2010a). The disagreement between a constant sSFR and our current theoretical wisdom is so pronounced that it motivates a study of the theoretical implications despite the observational uncertainties, adopting the validity of the sSFR plateau as a working assumption. An alternative way out from the puzzle might be to assume a time-dependent stellar initial mass function (IMF) (e.g. Davé 2010), but this is kept beyond the scope of the current paper.
The outline of the paper is as follows. In section 2, we summarize the observed sSFR at high redshift and explain the points of tension with theory. In section 3, we explain the NW10 method that we use here. In section 4, the main part of this paper, we demonstrate how a simple standard SAM fails to reproduce the sSFR plateau, and proceed by making controlled changes to this model in order to better reproduce the observations. In sections 5.1 and 5.2 we discuss possible physical motivations for these changes. In section 5.3 we comment on the observational uncertainties regarding obscuration by dust. In section 5.4 we compare our results to previous work. Finally, in section 6, we present our conclusions. Throughout the paper, we refer to the redshift range as “intermediate” redshift, to as “high” redshift, and to as “very high” redshift. Our models are based on dark-matter merger trees from the Millennium -body simulation (Springel et al. 2005), and we thus use WMAP1 cosmological parameters. In particular, we quote masses assuming .
2 The problem
2.1 Observations
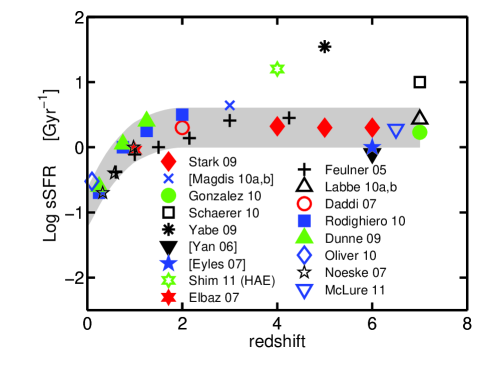
Acorrelation between stellar mass and SFR has been observed at various redshifts up to 4 (e.g. Daddi et al. 2007; Stark et al. 2009; Karim et al. 2011). Figure 1 shows a compilation of observational estimates of sSFR as a function of redshift for star-forming galaxies111typically selected at high redshift as Lyman-break galaxies (LBGs, Steidel et al. 1999), which possibly excludes a population of low SFR galaxies (e.g. Richards et al. 2011). This will however only increase differences between model and basic theoretical predictions. of a similar stellar mass . The data reveal a rather constant sSFR 2 in the redshift range (Feulner et al. 2005; Yan et al. 2006; Eyles et al. 2007; Daddi et al. 2007; Stark et al. 2009; González et al. 2010; Labbé et al. 2010a,b; Rodighiero et al. 2010; González et al. 2010; Magdis et al. 2010a,b; McLure et al. 2011). except for three higher estimates (Yabe et al. 2009; Schaerer & de Barros 2010, Shim et al. 2011)222We obtained part of the estimates by dividing the median SFR by the median stellar mass (for Yan et al. 2006; Eyles et al. 2007; Yabe et al. 2009). In some other cases, the estimates are based on an extrapolation of the sSFR-stellar mass relation to a stellar mass of (Daddi et al. 2007; Rodighiero et al. 2010).. The main reason for these higher estimates is the larger correction for dust extinction assumed by these authors (to be discussed in section 5.3), as well as different treatments of nebular emission lines and different assumptions concerning star-formation histories (to be discussed in section 4.6). Additionally, Shim et al. (2011) only include galaxies with indications for H emission, which will bias the estimate of the sSFR high. We note that all the estimates above do not include submillimeter galaxies, which are outliers to the relation between stellar mass and SFR, simply because these tend to have stellar masses above the limit we consider here (e.g. Daddi et al. 2007). At , the sSFR declines steeply (Noeske et al. 2007; Elbaz et al. 2007; Dunne et al. 2009; Oliver et al. 2010; Rodighiero et al. 2010). The grey belt in Fig. 1 tries to capture the overall trend, reflecting an uncertainty of dex as estimated by González et al. (2010), and ignoring the two high estimates. As will be discussed below, this observed sSFR plateau is puzzling — its level is surprisingly high at and surprisingly low at . For the purpose of the theoretical analysis of the current paper, we adopt the sSFR plateau as marked by the grey belt.
2.2 Tension with theory
Here, we outline the main potential points of tension between the observed sSFR and theoretical predictions both from relatively detailed SAMs and simple analytical arguments.
2.2.1 Tension with SAMs
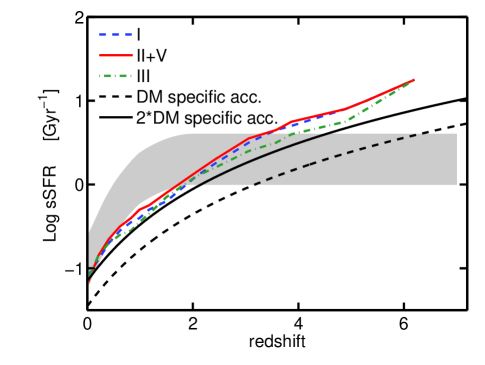

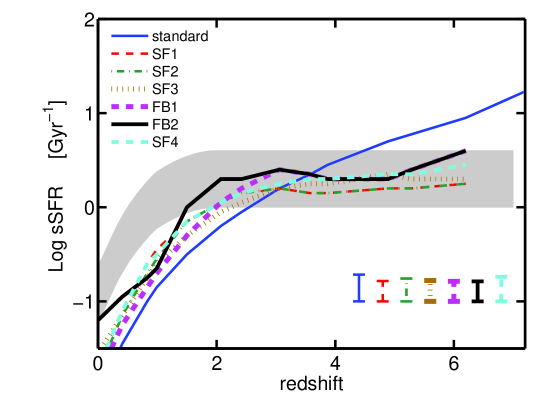
In Fig. 2, we show the sSFR as a function of redshift at a fixed mass for four of the models presented in NW10, in comparison with the observed sSFR plateau. To account for the observational completeness limit as indicated by Stark et al. (2009), we only take into account model galaxies with log(SFR) 0.25, 0.45 and 0.5 at z=4, 5 and 6 respectively. The four models are described in detail in NW10 with the same numbering used here and can be summarized as follows: I) model without SN feedback, II) model without ejective SN feedback, III) model including cold accretion [which is the model most similar to other standard SAMs], and V) model in which cooling and star formation shuts down after major mergers. All of those models have been tuned to reproduce key observables like the stellar mass functions at different redshifts, and star formation rate at z=0. Remarkably, all models show an extremely similar behaviour despite their fundamental differences, all in disagreement with observations. They overestimate the sSFR by about an order of magnitude at , and underestimate it by around 0.3 dex at .
Other current SAMs show a similar behaviour. For example, Lacey et al. (2010) show that the sSFR of galaxies in the Baugh et al. (2005) model have sSFR at z=6, an order of magnitude higher than observational results. Daddi et al. (2007) indicate that their observed SFR at is significantly higher than the values predicted by the model of Kitzbichler & White (2007). Finally, we have confirmed ourselves that the model of De Lucia & Blaizot (2007) predicts results very similar to our model predictions shown in Fig. 2 (see also Guo & White 2008, their Fig. 3).
2.2.2 Tension with basic theoretical considerations
The observed sSFR plateau is in disagreement with the standard wisdom concerning galaxy evolution. First, the average specific accretion rate into dark-matter haloes of a given mass is rapidly increasing with redshift, roughly in proportion to (Neistein & Dekel 2008). Second, galaxies are more dense and gas rich at high-redshift, which is expected to lead to higher SFR (e.g. Dutton et al. 2010). In agreement with these studies, Bouché et al. (2010) find in their idealized model that the sSFR of individual galaxies is indeed monotonically decreasing with time. To illustrate the first point, we show in Fig. 2 the approximation for the average specific dark matter accretion rate for haloes with log (Neistein & Dekel 2008), and compare it to the standard model, described in section 4.1, in Fig. 3. Remarkably, when we remove feedback from the standard model, it predicts a sSFR evolution in excellent agreement with twice the specific dark matter accretion rate. As shown in the figure, the remaining factor of two difference is fully explained by instantaneous stellar mass loss. Given that the ratio between stellar mass and halo mass is only about 5% for the galaxies considered here, this agreement is noteworthy. We see in the figure that the feedback as implemented in the standard model does not have a significant effect on the sSFR at , while it gradually reduces the sSFR at lower redshifts. Compared to the models of NW10 shown in Fig. 2, the standard model that we use in this paper has a low sSFR at , due to efficient feedback at late times. This is not relevant for studying the plateau.
In what follows, we will demonstrate that despite this serious tension with theory, the sSFR plateau can in principle be reproduced by models of galaxy evolution, but it takes non-negligible modifications to common ingredients of these models.
3 The Formalism
In this section we describe the formalism we use for modeling the evolution of galaxies. For more details about the methodology the reader is referred to NW10. It is shown there that the results of our model are very similar to those given by a standard SAM, although the recipes are simplified and schematic. In the context of this work, the simplicity of the model allows us to tune it easily, without losing the complex interplay between different process like dark-matter growth, cooling, SF, feedback, and merging. The code is available for public usage through the Internet (see http://www.mpa-garching.mpg.de/galform/sesam)
3.1 Merger trees
We use merger trees extracted from the Millennium -body simulation (Springel et al. 2005). This simulation was run using the cosmological parameters , with a particle mass of and a box size of 500 Mpc. The merger trees used here are based on subhaloes identified using the subfind algorithm (Springel et al. 2001). They are defined as the bound density peaks inside fof groups (Davis et al. 1985). More details on the simulation and the subhalo merger-trees can be found in Springel et al. (2005) and Croton et al. (2006). The mass of each subhalo (referred to as in what follows) is determined according to the number of particles it contains. Within each fof group the most massive subhalo is termed the central subhalo of this group. Throughout this paper we will use the term ‘haloes’ for both subhaloes and the central (sub)halo of fof groups.
3.2 Quiescent evolution
Each galaxy is modeled by a 4-component vector,
| (5) |
where is the mass of stars, is the mass of cold gas within the disk, is the mass within cold filaments streaming within the host halo into the central galaxy, and is the mass currently made unavailable for star formation by stellar feedback. We use the term ‘quiescent evolution’ to mark all the evolutionary processes of a galaxy, except those related to mergers.
All the models in this work assume that fresh gas is added to a galaxy only by cold filaments, increasing the mass of . The infall rate into filaments is assumed to be proportional to the dark-matter growth rate,
| (6) |
Here 0.17 is the cosmic baryonic fraction, and is the rate of dark-matter smooth accretion which does not include mergers with resolved progenitors (if we use a gas accretion rate of zero).
The mass of cold gas within the disk is increased due to the free infall of cold filaments from the outer parts of the host halo. We mimic this effect by assuming that gas joins the disk with a specific rate ,
| (7) |
The efficiency is a function of the host halo mass and the cosmic time only, and is given in units of Gyr-1.
We assume that the SF rate is proportional to the amount of cold gas,
| (8) |
where is a function of the halo mass and time, in units of Gyr-1. For each SF episode we assume that a constant fraction of the mass is returned back to the cold gas component due to SN events and stellar winds. This recycling is assumed to be instantaneous, and contributes
| (9) |
Following NW10, we use for all models. This is the recycled fraction for a Chabrier (2003) IMF at 13.5 Gyr after a star burst according to the Bruzual & Charlot (2003) stellar population models. We note that this is the only point where the assumption on the IMF enters our model.
Cold gas can be affected by feedback, which means that it becomes unavailable for star formation and moves from the cold phase to the feedback phase. Assuming that stellar feedback immediately follows star formation, this feedback should be in proportion to the SF rate,
We model feedback by a function of halo mass and time, .
Once gas has been made unavailable for star formation due to feedback, we allow it to return to the cold phase, with a re-incorporation efficiency:
| (11) |
Note that the feedback mechanism we use is moving gas from the cold phase to the feedback phase. The mass within filaments is not participating in the feedback and re-incorporation processes. If the cold gas mass becomes negative in a given timestep due to strong feedback, the star formation rates are adjusted such that a cold gas mass of zero is produced.
To conclude, each process is described by one function which depends on the host halo mass and time only. All processes discussed in this section can be written in a compact form by using the following differential equations:
| (12) |
where
| (17) |
| (22) |
Photoionization heating of the intergalactic medium is assumed to suppress the amount of cold gas available for SF within low mass haloes. This effect is critical for modeling the formation of dwarf galaxies. The minimum halo mass of in the Millennium simulation, which we use here, does however not allow a detailed modeling of small mass galaxies. Thus, instead of implementing a detailed treamtment of reionization, we simply assume that all the gas is kept hot until redshift 9, where cooling and SF are allowed to start. This is a higher redshift than in NW10, which we found is needed to produce a high enough number of galaxies at very high redshifts.
3.3 Mergers and satellite galaxies
Satellite galaxies are defined as all galaxies inside a fof group except the main galaxy inside the central (most massive) subhalo. Once the subhalo corresponding to a given galaxy cannot be resolved anymore, it is considered as having merged with the central halo. Due to the effect of dynamical friction, the galaxy is then assumed to spiral towards the center of the fof group and merge with the galaxy in the central halo after a significant delay time.
At the last time the dark matter subhalo of a satellite galaxy is resolved we compute its distance from the central halo (), and estimate the dynamical friction time using the formula of Binney (1987),
| (23) |
For we use the baryonic (stars + cold gas) mass of the satellite galaxy plus the minimum subhalo mass which can be resolved by the Millennium simulation. are the virial velocity and mass of the central subhalo. If a satellite falls into a larger halo together with its central galaxy we update for both objects according to the new central galaxy.
While satellite galaxies move within their fof group, they suffer from loss of their extended gas reservoir due to tidal stripping. We assume that all satellite galaxies are losing their reservoir of filament gas exponentially, on a time scale of a few Gyr. In order to properly model this stripping we modify by subtracting a constant from one of its elements:
| (24) |
Note that a constant in the diagonal of gives an exponential time dependence. However, the actual dependence of on time for satellite galaxies is more complicated due to contributions from accretion. In general the parameter should depend on the dynamical time of the host halo. For simplicity we consider it to be a constant here. We assume that the gas which is in the feedback phase is not stripped.
When galaxies finally merge we assume that a SF burst is triggered. We follow Mihos et al. (1994), Somerville et al. (2001) and Cox et al. (2008) and model the amount of stars produced by
| (25) |
where
| (26) |
Here are the baryonic masses of the progenitor galaxies (cold gas plus stars), is their cold gas mass, and , are constants.
The burst duration has been shown to vary in hydrodynamical simulations between tens of Myr to a few Gyr depending on the merger mass ratio, and whether multiple bursts are considered or just the main peak (Cox et al. 2008). We use a timescale of 10 Myr in all our models, following De Lucia & Blaizot (2007). Merger-induced bursts cause feedback in the same way as quiescent star formation.
4 Modifying a simple model
Below, we present a simple standard SAM, which we use as a starting point for our tuning procedure. This simple model includes features common to many current models of galaxy formation. It is kept as simple as possible in order to facilitate tuning and to simplify interpretation of changes to the model. In section 4.2, we present 6 alternative models which reproduce the sSFR plateau.
 |
 |
 |
 |
 |
 |
4.1 The standard model
The ingredients of this model were chosen based on the simplicity of the physical processes involved and consistency with observational constraints.
-
•
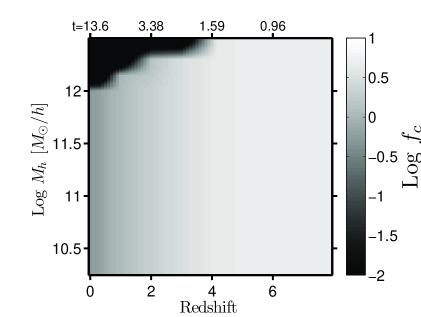
We assume that all accretion is cold, with , and that accretion is quenched at above (e.g. Dekel & Birnboim 2006; Cattaneo et al. 2006; Ocvirk et al. 2008; Dekel et al. 2009). To avoid sharp breaks in the stellar mass function, we smoothed the transition both in redshift and in mass by hand, as shown in Fig. 4.
-
•
The rate at which cold gas is turned into stars is
(27) where is the star-formation efficiency. For , we assume
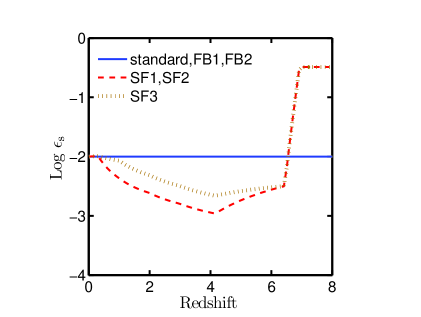
(28) where the halo spin parameter (according to the mean value found by Muñoz-Cuartas et al. 2010 in N-body simulations). We use a constant star formation efficiency , as shown in Fig. 5 as blue line. This is comparable to the estimates of Krumholz & Tan (2007), and similar to the efficiencies used in other recent models (e.g. Krumholz & Dekel 2010; Bouché et al. 2010 and Guo et al. 2010).
-
•
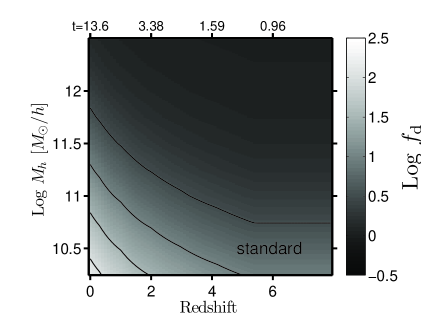
We include a simple prescription for stellar feedback which is the usual way to reproduce the low mass end of the stellar mass function (Dekel & Silk 1986). The formation of stars affects the surrounding cold gas, making part of it unavailable for star formation for a certain amount of time. The rate at which gas is made unavailable for star formation is equal to the SFR times an efficiency . As in most other SAMs, is a combination of a constant term (which is called the “reheating” part of feedback in De Lucia & Blaizot 2007), and a term that is inversely proportional to the virial velocity to some power, which should roughly mimic ejection of material due to SN explosions (e.g. Bower et al. 2006; De Lucia & Blaizot 2007; Guo et al. 2010). The feedback efficiency is thus given by
(29) We use =3.5, =161 km/s, 333A non-zero delta is necessary in order to have some feedback even in massive galaxies – otherwise, even in the absence of cooling, the gas coming from stellar recycling and mergers is enough to keep up relatively high star formation rates in massive galaxies.. We do not let log() be higher than 2.5, and we enforce a constant value for at . The value of as a function of halo mass and time is shown in Fig. 6, top panel.
-
•
There is no reincorporation, i.e. we assume that cold gas that has been made unavailable for star formation by feedback once never returns back to the cold gas reservoir.
-
•
We treat dynamical friction as in NW10, with a prefactor of 3.
-
•
No merger-induced star bursts are included.
-
•
The gas residing in the filaments of satellites is stripped with an exponential timescale of 4 Gyr.
Overall our model has similar basic scalings as other SAMs, although the parameter values are slightly different, and the recipes are simplified.
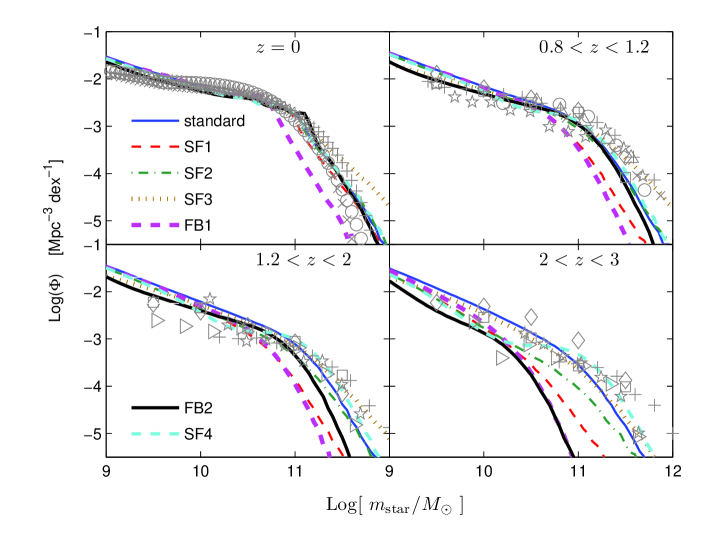
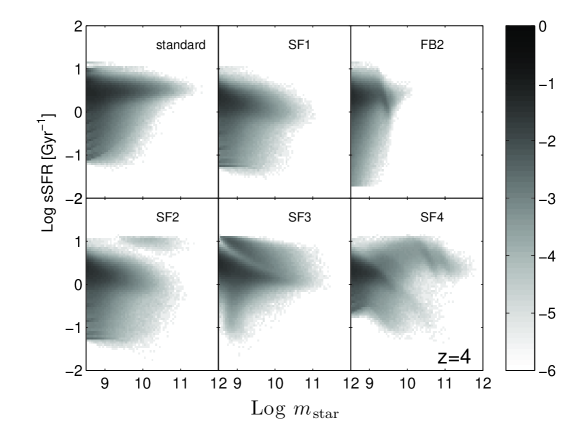
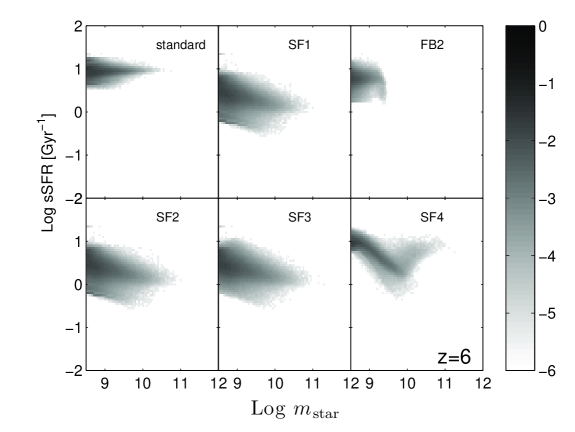
We ran the standard model (as well as all following models) on the full volume of the Millennium Simulation (Springel et al. 2005). The resulting stellar mass functions (SMFs) at different redshifts and the sSFR-z relation (defined in what follows as the sSFR as a function of redshift at stellar mass ) are shown in Fig. 7 and 8 as thin blue lines. To account for the observational completeness limit as indicated by Stark et al. (2009), we only take into account galaxies with log(SFR) 0.25, 0.45 and 0.5 at =4, 5 and 6 respectively in Fig. 8. Clearly, the observed relation in the mass bin is not reproduced, very similar to the models from NW10 shown in Fig. 2. On the other hand, note that the the evolution of the SMF is reproduced well (Fig.7), which is important for the following discussion of non-standard models. We show the relation between sSFR and stellar mass at =4 and =6 in Fig. 9, top left panels. The evolution of the mean cosmological SFR density is shown as thin blue line in Fig. 10. We have checked that including merger-induced bursts according to Croton et al. (2006) does not have a significant impact on any of the results shown here.
|
|
4.2 Tuning
We next gradually modify selected ingredients of the standard model. Our first goal is to bring the median sSFR at and in the mass bin into better agreement with the observed plateau, the grey band in Fig. 1. We also consider the relation between sSFR and stellar mass at and , shown in Fig. 9, in order to verify that the median sSFR tends to decrease with increasing stellar mass. We do not attempt a fit with the observed sSFR-mass relation outside the mass bin , because the lower mass bin is strongly affected by incompleteness (e.g. Stringer et al. 2011), while results for the higher mass bin seem controversial (compare Stark et al. 2009 to Lee et al. 2010a). Our secondary goal is to avoid severe deviations from the observed SMF at intermediate redshifts, and from the observed evolution of mean SFR density. We do not attempt to fit the observed sSFR at .
This is because we believe the mismatch in the sSFR between observations and models at , where the SFR in the universe declines rapidly, is a separate problem that deserves a dedicated study. It is discussed in more detail elsewhere (e.g. Fontanot et al. 2009; Karim et al. 2011). Additionally, we find fitting the sSFR challenging enough even prior to adding the additional constraints imposed by the low redshift data. On a separate note, we point out that observations of sSFR in galaxies with masses at are rather uncertain, probably more so than at higher redshifts, as they tend to fall below the current stellar mass completeness limits at these redshifts (e.g. Rodighiero et al. 2010, Dunne et al. 2009). This is due to the decline of the global star formation rate density and the increasing importance of dust, which decrease the intrinsic luminosity of galaxies at .
For tuning the models, we focus on one model ingredient at the time, i.e. the star formation efficiency or the feedback efficiency. Using a table with discrete values of the efficiency in 8 bins in time, and 10 bins in halo mass, we start by fitting the plateau at the highest redshift and then subsequently continue to lower redshifts. We try to keep dependencies on halo mass and time as monotonic as possible, to limit the number of possible models, and also because monotonic dependencies are easier to motivate physically. Once we have found a solution for the plateau from , we compare the model results with the other observational constraints. Depending on the outcome, we discard the model or improve the fit to the stellar mass functions and the sSFR-stellar mass relation by making additional changes to the efficiencies. Part of our models (SF2, SF3, FB2) are then further improved by simple changes to one or two other model ingredients. We point out that we have not carried out a systematic study covering all the parameter space, but a process of trial and error that is geared towards finding successful solutions which fit the constraints in question. Fitting the sSFR plateau and the evolution of the stellar mass function together is not trivial, and a substantial number of iterations were needed for each model to arrive at the solutions presented below.
The different models are summarized in table 1.
| Models | Modifications | line type |
|---|---|---|
| standard | – | thin blue |
| SF1 | thin dashed red | |
| SF2 | , | dotted-dashed green |
| SF3 | , , | dotted brown |
| SF4 | dashed cyan | |
| FB1 | dashed pink | |
| FB2 | , | thick black |
4.3 Reproducing the sSFR plateau
In this section, we explore two alternative modifications to the standard model that aim at reproducing the sSFR plateau: (i) models “SF”, in which is reduced at high redshifts, and (ii) models “FB”, where the feedback efficiency is enhanced at high redshifts. Results for all the models are shown in Fig. 7, 8, 9, and 10.
4.3.1 Model SF1 - tune
In model SF1, we tune the SFE parameter, , while all other model parameters are kept fixed as in the standard model. With varying in time as shown in Fig. 5 (top panel), the model reproduces the sSFR plateau at as shown in Fig. 8. While does not need to depend on halo mass, it is not monotonic with time. In order to have an sSFR plateau starting from redshift (chosen here to be ), this model requires an earlier epoch where is well above its fiducial value 0.01. This early star formation is needed in order to produce enough galaxies of large-enough stellar mass by , after which the much-lower SFR adds only slowly to the stellar mass. At the onset of the plateau, has to drop to values well below , and it should continue to gradually decline till , in order to permit the observed low sSFR values at . After , is gradually increasing in order to match the high observed sSFR in this regime. It catches up with the fiducial value only at low redshifts. We note that model SF1 predicts that the sSFR plateau does not extend all the way to the epoch of the emergence of the first galaxies; it is preceded by a starburst epoch.
Unfortunately, Fig. 7 shows that model SF1 does not produce enough massive galaxies to match the observed mass function at intermediate redshifts, despite the high initial . Model SF1 thus reveals a nontrivial tension between two sets of data, namely the low values of sSFR at high redshifts versus the high-mass end of the SMF at intermediate redshifts. This indicates that the high values of sSFR obtained in SAMs at high redshifts are needed there for the purpose of building up massive enough galaxies by , and are therefore not easy to avoid.
 |
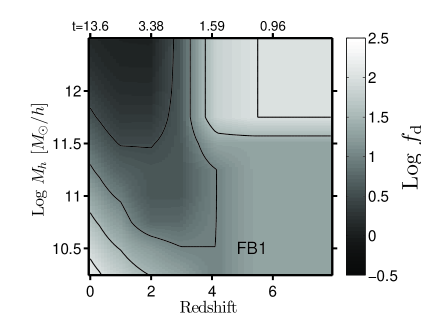
4.3.2 Model FB1 - tune feedback
In model FB1, we only tune the stellar feedback parameter , while all other model parameters are kept fixed as in the standard model. The values of as a function of mass and redshift are shown in Fig. 6 (top-right panel), and the resultant sSFR evolution and SMF are shown in Fig. 7 and 8. We find that fitting the sSFR plateau requires very high stellar feedback efficiencies at early times (), and especially so for massive haloes. This is needed in order to balance the high accretion rates of these haloes. High feedback efficiency is not needed in the massive haloes at later times because the cooling in them is set to zero at . At lower halo masses , moderately strong feedback is needed at all redshifts. Note that stellar feedback is not entirely monotonic here with either mass or time; we improve this in the following model FB2 by adding reincorporation as an additional model ingredient.
As in model SF1, we do not reproduce the high mass end of the SMF with this model, again indicating that suppressing the efficiency of star formation at high redshift leads to an underproduction of massive galaxies, if no other changes to the model are made. As can be seen in Fig. 7, this shortage is more severe than in the SF models, and more so at higher redshifts. We did not manage to improve this aspect of the FB1 model so far, since tuning the FB models is more difficult than tuning the SF models. The reason for this is that the star formation rate of galaxies is directly proportional to , while its dependence on the feedback efficiency is non-linear.
All our models that reproduce the sSFR plateau at require an earlier phase of high SFR, with a sSFR higher than the plateau level by a factor of a few. This provides a high enough stellar mass at , which allows the desired low sSFR at the plateau level while the SFR is driven to high values by the high accretion rate. For example, in order to reach by a mass of , the minimum mass of galaxies on the plateau, a galaxy needs an average SFR 10 between the onset of star formation at and , say. This implies a sSFR at , and even higher values at earlier times, when the stellar mass is smaller. Such an early phase of high SFR has to be introduced by hand when is set to low values at , as in model SF1. In model FB1, on the other hand, the high SFR at occurs naturally, because the gas available for SFR in a growing galaxy is proportional to the instantaneous accretion rate, which is only slowly increasing with time. This is in contrast to the SF models, where the SFR is proportional to the accumulated gas in the galaxy and therefore tends to increase faster with time.
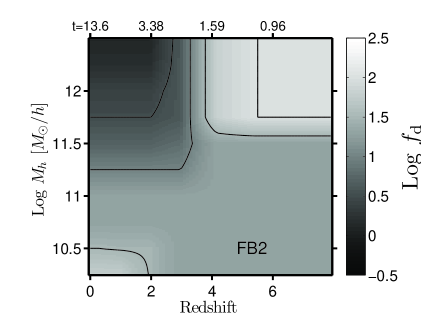
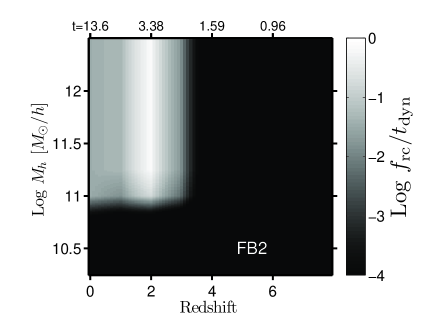
4.3.3 Model FB2 - tune feedback and reincorporation
In model FB2, we improve on model FB1 by adding reincorporation from the feedback phase back to the cold phase as an additional model ingredient. This makes it possible to keep the variation of the feedback efficiency with time monotonic (although the trend is of opposite sense at low and high halo masses). With model FB2, we can reproduce the sSFR plateau very well down to (Fig. 8, black thick solid line), but again fail to simultaneously reproduce the high mass end of the SMF at z 2 (Fig. 7, black thick solid line). Feedback and reincorporation efficiencies in model FB2 are shown in Fig. 6, left and right bottom panel respectively. Reincorporation is needed in order to keep up high sSFR at for haloes with masses . We set it to very low values outside this range. The efficiency of reincorporation in the range of halo mass and time when it is needed then quite similar at all redshifts when expressed in units of , with a slight peak at around .
4.4 Reproducing the sSFR and the evolution of the SMF
While we have found in the previous section that it is possible to reproduce the sSFR plateau once the star-formation or feedback efficiency is allowed to vary in time and with mass, all the models discussed so far underproduce the high mass end of the SMF at . In this section, we attempt to improve the fit to the SMF at intermediate redshifts by an additional modification to the model. For simplicity, we focus on modifications to model SF1. Figure 7 shows that these models, SF2-SF4, reproduce the high mass end of the intermediate-redshift SMF better than the previous models. Figure 9 demonstrates that this success is associated with a population of galaxies more massive than with high SFR at , which were missing in the previous models. We explore here three different ways for producing this population. In model SF2, we boost the efficiency of merger-induced star bursts. In model SF3, we speed up the merger rate. In model SF4, we introduce a rather involved variation of both with halo mass and time, making star formation more efficient in relatively high mass haloes while keeping it inefficient in lower mass haloes.
4.4.1 Model SF2 - tune and mergers
In model SF2, we reproduce the required massive galaxies at by boosting up merger-induced starbursts. We first tried the starburst prescription of Croton et al. (2006) where , but this had only a little effect on the SMF. However, with at , followed by the Croton et al. (2006) prescription at , model SF2 produces a higher abundance of high mass galaxies in better agreement with the SMF at intermediate redshift (Fig. 7), while still reproducing the sSFR plateau (Fig. 8).
An additional parameter governing merger-induced starbursts is the burst duration, which is set to 10 Myr. We find that smearing the bursts over a much longer duration (e.g. 500 Myr) makes very little difference to the results. As we only consider the median and the 68% range, a small population of starbursting galaxies can be present without ruining the sSFR plateau. Strongly star bursting galaxies might also not make it into the Stark et al. (2009) or González et al. (2010) samples, as the highly star forming regions in galaxies tend to be strongly dust attenuated (e.g Charlot & Fall 2000), and are therefore a good way of building up stellar mass in a hidden mode.
4.4.2 Model SF3 - tune and mergers
Model SF3 is a variation of model SF2, where the high starburst efficiency at is replaced by a shorter characteristic time for dynamical friction. The fiducial dynamical friction prefactor of is replaced by at and at , while the starbursts are moderate, . The rapid stellar assembly in this model boosts up the buildup of stellar mass, and we need to lower the efficiency of star formation accordingly (Fig. 5, top panel). This model provides a sensible fit to the SMF (Fig. 7) and it reproduces the sSFR plateau (Fig. 8).
4.4.3 Model SF4 - tune
Model SF4 demonstrates a third way to build up high mass galaxies by moderate redshifts without enhancing the contribution of mergers. In this model, the star-formation efficiency, , is varied as a function of both halo mass and time as shown in Fig. 5. This allows for a simultaneous fit to the SMF (Fig. 7) and the sSFR plateau (Fig. 8). We note that in this model, the sSFR does not in general decrease with increasing stellar mass, as shown in Fig. 9, for the z=6 results, bottom right panel. This is contrary to all observations of this relation we are aware of, which tend to find that the median sSFR of galaxies decreases with increasing stellar mass.
4.5 Summary of model results
In this section, we summarize the successes and failures of the models, guided by Fig. 7, 8 and 10. From Fig. 7, which shows the stellar mass functions up to , it becomes clear that only models SF3 and SF4 manage to reproduce the SMF at .
In Fig. 8, we show that all our models except the standard models provide a reasonable fit to the sSFR plateau from . At , the sSFR is lower than the observational estimates. This may be partially due to incompleteness in the observations, which misses galaxies with low SFR especially at low redshift, where the global SF in the Universe has declined. The mismatch at , however, is probably real and already apparent in the standard model. It is likely connected to a similar underproduction of the sSFR present in other recent SAMs (e.g. Fontanot et al. 2009, Guo et al. 2011). We note that our efforts to improve the match to the sSFR plateau lead to an increase in the sSFR at and thus to a better agreement with observations.
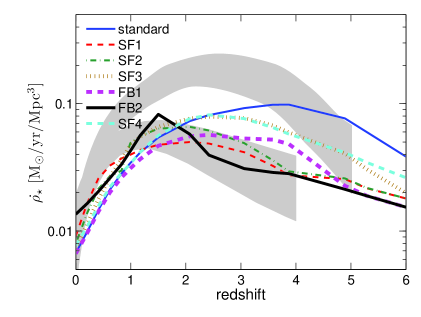
In Fig. 10 we show the global star formation rate density as a function redshift in our models. The upper grey belt represents the directly observed SFR density from Hopkins & Beacom (2006), while the lower belt is derived from the growth curve of the stellar mass (Wilkins et al. 2008). More recent estimates like from Bouwens et al. (2009) and from Kistler et al. (2009) are in agreement with the upper belt. The observational results that are directly measured from star formation, and those that are obtained indirectly from the evolution of the stellar mass density are thus clearly inconsistent, which is the reason that SAMs (like e.g. Guo et al. 2011) usually have a SF density somewhere in between these two constraints. Results of our various models start to deviate considerably at , but the discrepancy between the observational results makes it impossible to use them to constrain models. The highest global SFR density at is reached by the standard model, followed by the models which have the best fit to the SMF at high redshift, namely model SF3 and SF4.
4.6 The sSFR of individual galaxies

In Fig. 11, we follow the growth of one individual model galaxy following the main branch of its merger history. Shown as a function of redshift is the mass in the dark-matter, cold gas and stars, the SFR and sSFR, for the standard model, SF2 and FB2. The resulting stellar mass at is similar in the three models. However, the star-formation history and the growth of stellar mass are different — in both model SF2 and FB2, the buildup of stellar mass is delayed compared to the standard model.
We note that at the SFR in individual galaxies is rising with time for all models. This is a common feature to all our model galaxies, and is consistent with the predictions of Finlator et al. (2006, 2011), as well as with the observational finding of Papovich et al. (2010), Maraston et al. (2010), Lee et al. (2010a,b). It is emerging naturally from the fact that in an individual galaxy, the accretion rate is expected to be growing in time in its rapid growth phase at (Neistein & Dekel 2008).
We see in Fig. 11 that as the galaxy evolves from to , the sSFR declines in a rather slow pace under models SF2 and FB2 compared to the steeper decline in the standard model. The sSFR plateau discussed in the previous sections, which refers to the median value for galaxies of a fixed mass at different redshifts, does not necessarily imply a constant sSFR in individual galaxies as they grow. However, the observations of Stark et al. (2009) and Papovich et al. (2010, Figs. 2 and 3) do argue for a constant sSFR in individual galaxies as well. It is thus encouraging that our models that reproduce the sSFR plateau also come close to reproducing the constancy of the sSFR in individual galaxies.
5 Discussion
In subsections 5.1 and 5.2 of this discussion section, we comment on the physical plausibility of the ad-hoc modifications suggested by our models. This discussion is not complete or conclusive — it is only meant to raise some of the relevant issues and to trigger further discussion. The limited goal of the current paper remains to point out the possible nature of the modifications to the standard models that are required for reproducing the sSFR plateau together with the SMF at moderate redshift.
5.1 Changes to the quiescent evolution of galaxies
-
1.
Star formation efficiency: In the SF models, has to vary in time, with a very high efficiency at , and a low efficiency at . The latter is consistent with the prediction of Gnedin & Kravtsov (2010) that the low metallicity and high UV radiation at should significantly lower the normalization of the Kennicutt-Schmidt relation. This effect is particularly strong for low gas surface densities. An effective suppression of star formation in high redshift galaxies and at low masses turns out to be a natural outcome of the low metallicity in these galaxies (Krumholz & Dekel 2011). The low dust content enables the UV radiation from stars to heat the gas (while dissociating H2 molecules) and to prevent further star formation, until enough metallicity is built up and the SFR regions are shielded. Observational studies at 3 seem to agree with this prediction (e.g. Wolfe & Chen 2006; Rafelski et al. 2010). Furthermore, both SAMs and hydrodynamical simulations have suggested that a low at high redshift improves the match with observations in a number of ways (Baugh et al. 2005; Lacey et al. 2010; Agertz et al. 2011). It is more difficult to explain the high at , necessary for producing enough galaxies with a high stellar mass by . What might help is a feedback mechanism that causes an abrupt change in the mode of star formation after a very active initial phase. Model SF4 suggests in addition an increase of with halo mass. Such a variation might result from faster metal enrichment or less efficient feedback in more massive haloes.
-
2.
Stellar feedback: The FB models suggest strong early stellar feedback that is not limited to small galaxies. This is in potential disagreement with conventional models of SN feedback, in which the effect of feedback at a fixed halo mass is expected to be weaker at high redshift, where the deeper potential well makes it harder to eject gas from the galaxy (Dekel & Silk 1986; Dekel & Birnboim 2006). One should therefore consider additional feedback mechanisms that may vary in the required way with time and mass. For example, a metallicity-dependent stellar feedback (Nishi & Tashiro 2000; Krumholz & Dekel 2011) will be especially effective at high redshifts. The required strong feedback at high halo masses ( at ) may be achieved by AGN feedback from massive black holes rather than stellar feedback.
-
3.
Reincorporation: Model FB2 requires a high rate of reincorporation only at . In other SAMs, the reincorporation rates scale with , and therefore gradually increase towards higher redshift, making the effective stellar feedback less efficient at high . A weaker time dependence, more consistent with FB2, is found in simulations that incorporate strong momentum-driven winds (Oppenheimer et al. 2010). Another option is “reincorporation” that utilizes a gas reservoir in the galaxy rather than gas that has been ejected earlier. For example, this occurs naturally for metallicity-dependent feedback. As long as the metal content in a galaxy is low, gas is not well shielded from UV radiation by dust, leading to efficient heating and dissociation. Once the metal content reaches a certain threshold value, the gas is shielded and star formation becomes efficient. The abrupt appearance at of reincorporation in FB2 is an oversimplification, but the general increase of reincorporation with halo mass is plausible both for ejective and non-ejective feedback.
5.2 Changes to the recipes for mergers
-
1.
Enhanced starburst efficiency at high redshift: In model SF2, the starburst efficiency, defined according to eq. 25, is higher at higher z. This is not to be confused with the SF efficiency , which is relevant for quiescent star formation. An increased star burst efficiency at high z is plausible due to the shorter dynamical times. The gas-rich mergers at high redshift may in principle be very different from today’s more familiar gas-poor mergers. High-resolution gas-rich merger simulations indeed indicate an effective star formation efficiency that is higher than in non-merger situations (Teyssier, Chapon & Bournaud 2010).
-
2.
Enhanced merger rate at high redshift: In model SF3, the dynamical friction prefactor is reduced to 0.1 at , which speeds up the merger process by a factor compared to the standard model and other SAMs (Croton et al. 2006; De Lucia et al. 2007). At high redshift, the merging galaxies flow from the virial radius to the central galaxy along narrow radial streams associated with the cosmic-web filaments in about one half of a halo crossing time, , which is (Dekel et al. 2009). This implies a merging time substantially shorter then the dynamical friction time estimated for gradual spiraling in. Hopkins et al. (2010) point out that the standard estimate of merger time based on dynamical friction is indeed an overestimate when the approach of the satellite is along a radial orbit, or when the dynamical friction estimate starts at a distance larger than 0.1 - 0.2 , where the satellite is no longer properly resolved in the simulation. Both of these conditions tend to be valid at high redshift (Wetzel 2010, Hopkins et al. 2010), and together they may lead to an order of magnitude overestimate of the merger time in the standard model. We used the Millennium simulation to verify that with , the merging time is comparable to the halo crossing time.
5.3 Dust at high redshift
The validity of the sSFR plateau at high redshifts crucially depends on the correction adopted for dust extinction by the different authors. At , the estimates for dust extinction in LBGs from the UV slopes are confirmed by radio estimates (Pannella et al. 2009) and from comparison with a local sample of Lyman break analogs (Overzier et al. (2011). At higher redshifts, the estimates are more uncertain. Stark et al. (2009), González et al. (2010) and Labbé et al. (2010a,b) all assume practically no dust extinction at . This assumption is supported by simple theoretical considerations and several observational studies. It is expected that high-redshift galaxies should have a lower dust content than today’s galaxies simply because they had less time to produce metals and dust. Indeed, theoretical models (e.g. Guo & White 2009) often assume a lower dust extinction at higher redshift. Bouwens et al. (2009) estimated the dust extinction at high redshift based on the observed UV continuum slope, and found low values at , especially for the dominant population of galaxies with relatively low UV luminosities. Labbé et al. (2010b), Finkelstein et al. (2010) and Bouwens et al. (2010) also report on low or zero dust extinction at . Brammer & van Dokkum (2007) tested whether the usual LBG selection criteria miss a significant number of dusty galaxies at by selecting according to Balmer breaks instead, and found that this is not the case, again indicating that strong dust obscuration at high redshift is rare. This may however not be the case for massive galaxies, which potentially already have high dust content at (Mancini et al. 2009, Marchesini et al. 2011) and thus may be missed by the usual LBG selection criteria. Also, Schaerer & de Barros (2010) and Yabe et al. (2009) argue for high correction factors of 9 when translating the UV flux to SFR at . We note that in order to reconcile the plateau in the sSFR with current SAMs by the effect of dust-extinction alone, the dust extinction would have to increase with redshift, a trend which is opposite to basic theoretical expectations. While the “dust” has not settled yet on this debate, it seems that the evidence for a sSFR plateau is intriguing enough to justify a serious theoretical consideration, but it is left for future observations to tell whether this is indeed a valid strong constraint or a fluke.
5.4 Comparison to previous work
Previous efforts to understand the properties of star forming galaxies at include Finlator et al. (2006, 2011), Night et al. (2006), Mao et al. (2007), Nagamine et al. (2008), Stark et al. (2009), Lee et al. (2009), Khochfar & Silk (2011), Lacey et al. (2010), Lo Faro et al. (2009), and Stringer et al. (2010). Here we compare our findings to some of those studies.
Lee et al. (2009) concluded based on clustering analysis that the duty cycle of star formation in high-redshift galaxies must be short, consisting of episodes of Gyr in each galaxy. Stark et al. (2009) came to similar conclusions. This would be in apparent conflict with the need to build up the massive end of the SMF by . Our model SF1 that reproduces the sSFR plateau assumes a continuous mode of star formation, and even then, it underpredicts the massive end of the SMF. If the low sSFR were associated instead with short-lived bursts of star formation, it would have been even harder to build up the stellar mass quickly enough. A way to reconcile a short duty cycle with the required fast build-up of stellar mass might be that the short-lived episodes of SF are only the final phase of a much more active and dust-obscured starbursts, enough for building up the high mass end of the SMF but undetectable in their violent phase. Finlator et al. (2011) suggest that the clustering data by Lee et al. (2009) can also be explained without a bursty star formation history, if there are strong outflows that lead to an increased scatter in the relation between baryonic mass and host halo mass.
Khochfar & Silk (2011) present a model that reproduces the sSFR plateau at with (i) a very high frequency of star-bursts at high redshift and (ii) a burst efficiency that scales with the inverse of the halo circular velocity to the third power. In this way, star formation in galaxies in the mass range relevant for the plateau is inefficient at high redshift, but stellar mass grows efficiently during mergers in low mass haloes. Their model thus resembles a combination of our models SF2 and SF3.
The simultaneous need for a low sSFR at high redshift and a fast build-up of stellar mass seems to be in odds with the notion that the observed growth rate in stellar mass density is low compared to that predicted by integrating the observed SFR density (Wilkins et al. 2008). These seemingly inconsistent problems may reflect a difference between the overall evolution of stellar mass density and the evolution of the population dealt with here, involving relatively massive galaxies in a fixed mass bin.
Lo Faro et al. (2009), comparing a SAM for LBGs at to observations, found that their model produces an excess of star-forming galaxies with stellar masses at , within the range relevant for our study of the sSFR plateau. They conclude that some feedback mechanism must suppress star formation at early times in the corresponding haloes of , but it should become ineffective at later times in haloes of similar mass. As Lo Faro et al. (2009) point out, such a behaviour of the feedback efficiency is not part of the standard feedback models. Their conclusions are thus similar to ours, albeit they originate from a different observational constraint.
6 Conclusions
We explored possible ad-hoc modifications to standard semi-analytic models that reproduce a constant sSFR at while growing enough massive galaxies by , and came to the following conclusions.
-
•
We confirm that a sSFR plateau at is in robust disagreement with current models, as claimed in Bouché et al. (2010). We have demonstrated that, in a fixed stellar mass bin of , the common feature of a variety of standard SAMs is a gradual decline of the sSFR with time, associated with the decline of the total specific accretion rate.
-
•
We find that it is possible to reproduce the sSFR plateau together with the stellar mass function at via non-trivial modifications to the standard SAMs. Three different modifications seem necessary, related to three different observational features: (1) the low sSFR at , (2) the high sSFR at , and (3) the abundance of high mass galaxies at . The low sSFR at is reproduced either by strong stellar feedback at high redshift in all masses, or by inefficient star formation at high redshift following a phase of very efficient star formation at very high redshift. The high sSFR at could emerge either by a drop in the feedback efficiency at this epoch, or by a corresponding enhancement of star formation efficiency, or by efficient reincorporation of gas that was previously prevented from forming stars. Finally, the high mass end of the SMF at can be generated despite the low SFR at high redshift by an additional modification of the star formation in a sub-population of massive galaxies at high redshift. This is achieved in our models by either speeding up the mergers, or enhancing the merger-induced starbursts, or by introducing a non-trivial dependence of star formation efficiency on halo mass. However, none of our modified models matches the stellar mass function at as well as our standard model. This reflects the fact that the low sSFR at high redshift and the presence of massive galaxies by are not easily reconciled.
-
•
Our models predict that the SFR in individual galaxies is monotonically increasing with time at . This is in agreement with the theoretical predictions of Finlator et al. (2006, 2011) and Bouché et al. (2010), as well as the observational results by Papovich et al. (2010). We note in particular that an SFR that grows exponentially with time implies a constant sSFR. It should be mentioned that the decreasing SFR sometimes assumed in SED fitting (e.g. in Stark et al. 2009) is incorrect.
We have demonstrated that the simple SAM of NW10 is useful for exploring how current SAMs should be modified in order to match new observational constraints, and for pointing out apparently conflicting observational constraints. A similar method will be useful in addressing other puzzling observations such as the tilt in the relation of sSFR and stellar mass (e.g. Somerville et al. 2008), the fraction of passive galaxies as a function of stellar mass at (e.g. Weinmann et al. 2010), or the fraction of AGNs as a function of stellar mass (Fontanot et al. 2010).
We learn that the observed sSFR at high redshift has the potential for posing powerful constraints on the physical processes of star formation and feedback. If the sSFR plateau, as observed by Stark et al. (2009), Labbé et al. (2010a, 2010b), and González et al. (2010), is confirmed, it will provide invaluable information on the baryonic physical processes at high , indicating that it could be different from those at low redshift. One should be eagerly waiting for new developments in the observations of SFR and stellar mass at high redshift.
While we started a discussion of the physical plausibility of the required modifications to the standard recipes of galaxy-formation models, the modifications suggested above are primarily of an ad-hoc nature. They deserve a thorough theoretical study of physical mechanisms that could be responsible for the required variation with time and mass.
Acknowledgments
We thank Rychard Bouwens, Sadegh Khochfar and the anonymous referee for helpful comments on the draft, and Rachel Somerville, Ben Oppenheimer, Ivo Labbé, Niv Drory, Emmanuele Daddi, Marcel Haas, Raanan Nordon and Giulia Rodighiero for useful discussion. EN was partially supported by the Minerva fellowship during this project. AD was partially supported by ISF grant 6/08, by GIF grant G-1052-104.7/2009, by a DIP grant, and by NSF grant AST-1010033. SQL databases containing the Millennium simulations are publicly released at http://www.mpa-garching.mpg.de/millennium. The code used to generate semi-analytic models based on the NW10 method is publicly available under http://www.mpa-garching.mpg.de/galform/sesam The Millennium site was created as part of the activities of the German Astrophysical Virtual Observatory.
References
- [] Agertz O., Teyssier R., Moore B., 2011, MNRAS, 410, 1391
- [] Baldry I.K., Glazebrook K., Driver S.P., 2008, MNRAS, 388, 945
- [] Baugh C.M, Lacey C.G., Frenk C.S., Granato G.L., Silva L., Bressan A., Benson A.J., Cole S., 2005, MNRAS, 356, 1191
- [] Binney J., Tremaine S., 1987, Galactic dynamics, Princeton University Press
- [] Borch A. et al. 2006, A&A, 453, 869
- [] Bouché et al., 2010, ApJ, 718, 1001
- [] Bouwens R.J., et al. 2009, ApJ, 705, 936
- [] Bouwens R.J. et al. 2010, ApJ, 708, 69
- [] Bower R.G., Benson A.J., Malbon R., Helly J.C., Frank C.S., Baugh C.M., Cole S., Lacey C.G., 2006, MNRAS, 370, 645
- [] Brammer G. B. & van Dokkum P.G., 2007, ApJ, 654, L107
- [] Bruzual G., Charlot S., 2003, MNRAS, 344, 1000
- [] Bundy K. et al., 2006, ApJ, 651, 120
- [] Cattaneo A., Dekel A., Devriendt J., Guideroni B., Blaizot J., 2006, MNRAS, 370, 1651
- [] Chabrier G., 2003, PASP, 115, 763
- [] Charlot S., Fall S.M., 2000, ApJ, 718, 731
- [] Cole S., Lacey C.G., Baugh C.M., Frenk C.S., 2000, MNRAS, 319, 168
- [] Cox T.J., Jonsson P., Somerville R.S., Primack J.R., Dekel A., 2008, 2008, MNRAS, 384, 386
- [] Croton D.J. et al., 2006
- [] Daddi E. et al., 2007, ApJ, 670, 156
- [] Davé R., 2010, preprint, arXiv:1008.5283
- [] Davis M., Efsthathiou G., Frenk C.S., White S.D.M., 1985, ApJ, 292, 371
- [] Dekel A., Silk J., 1986, ApJ, 303, 39
- [] Dekel A., Birnboim Y., 2006, MNRAS, 368, 2
- [] Dekel A., Sari R., Ceverino D., 2009, ApJ, 703, 785
- [] Dunne L. et al., 2009, MNRAS, 394, 3
- [] De Lucia G., Blaizot J., 2007, MNRAS, 375, 2
- [] Drory N., Bender R., Feulner G., Hopp U., Maraston C., Snigula J., Hill G.J., 2004, ApJ, 608, 742
- [] Drory N., Salvato M., Gabasch A., Bender R., Hopp U., Feulner G., Pannella M., 2005, ApJ, 608, 742
- [] Dutton A.A., van den Bosch F.C., Dekel A., 2010, MNRAS, 405, 1690
- [] Elbaz D., 2007, A & A, 468, 33
- [] Eyles L.P., Bunker A.J., Ellis R.S., Lacy M., Stanway E.R., Stark D.P., Chiu K., 2007, MNRAS, 374, 910
- [] Finkelstein S. L., Papovich C., Giavalisco M., Reddy N.A., Ferguson H.C., Koekemoer A.M., Dickinson M., 2010, ApJ, 719, 1250
- [] Finlator K., Davé R., Papovich C., Hernquist L., 2006, ApJ, 639, 672
- [] Finlator K., Oppenheimer B. D., Davé R., 2011, MNRAS, 410, 1703
- [] Fontana A. et al., 2006, A&A, 459, 745
- [] Fontanot F., De Lucia G., Monaco P., Somerville R.S., Santini P., 2009, MNRAS, 397, 1776
- [] Fontanot F., Pasquali A., De Lucia G., van den Bosch F.C., Somerville R., Kang X., 2010, preprint, arXiv:1006.5717
- [] González V., Labbé I., Bouwens R.J., Illingworth G., Franx M., Kriek M., Brammer G.B., 2010, ApJ, 713, 115
- [] Gnedin N.Y., Kravtsov A.V., 2010, 714, 287
- [] Guo Q., White S.D.M., 2008, MNRAS, 384, 1
- [] Guo Q., White S.D.M., 2009, MNRAS, 396, 39
- [] Guo Q. et al, 2010, preprint, arXiv:1006.0106
- [] Hopkins A.M., Beacom J.F., 2006, ApJ, 651, 142
- [] Hopkins P.F. et al., 2010, preprint, arXiv:1004.2909
- [] Karim A. et al., 2011, ApJ, 730, 61
- [] Kauffmann G., White S.D.M., Guideroni B., 1993, MNRAS, 264, 201
- [] Kereš D., Katz N., Weinberg D.H., Davé R., 2005, MNRAS, 363, 2
- [] Khochfar S., Silk J., Windhorst R.A., Ryan R.A.Jr., 2007, ApJ, 668, 115
- [] Khochfar S., Silk J., 2011, MNRAS, 410, 42
- [] Kistler M.D., Yüksel H., Beacom J. F., Hopkins A.M., Wyithe J.S.B., ApJ, 705, 104
- [] Kitzbichler M.G., White S.D.M, 2007, MNRAS, 376, 2
- [] Krumholz M.R., Tan J.C., 2007, ApJ, 654, 304
- [] Krumholz M.R., Dekel A., 2010, MNRAS, 406, 112
- [] Krumholz M.R., Dekel A., 2011, preprint, arXiv:1106.0301
- [] Labbé et al. 2010a, ApJ, 708, 26
- [] Labbé et al. 2010b, ApJ, 716, 103
- [] Lacey C.G., Baugh C.M., Frenk C.S., Benson A.J., 2010, preprint, arXiv:1004.3545
- [] Lee K.-S. et al., 2009, MNRAS, 695, 368
- [] Lee K.-S. et al., 2010a, preprint, arXiv:1009.3022
- [] Lee K.-S., Ferguson H.C., Somerville R.S., Wiklind T., Giavalisco M., 2010b, ApJ, 725, 1644
- [] Li C., White S.D.M., 2009,MNRAS, 398, 2177
- [] Lo Faro B., Monaco P, Vanzella E., Fontanot F., Silva L., Cristiani S., 2009, MNRAS, 399, 827
- [] Magdis G.E., Rigopoulou D., Huang J.-S., Fazio G.G., 2010a, MNRAS, 401, 1521
- [] Magdis G.E. et al., 2010b, ApJ, 714, 1740
- [] Mancini C., Matute I., Cimatti A., Daddi E., Dickinson M., Rodighiero G., Bolzanella M., Pozzetti L., 2009, A&A, 500, 705
- [] Mao J., Lapi A., Granato G.L., De Zotti G., Danese L., 2007, ApJ, 667, 655
- [] Maraston C., Daddi E., Renzini A., Cimatti A., Dickinson M., Papovich C., Pasquali A., Pirzkal N., 2006, ApJ, 652, 85
- [] Maraston C., Pforr J., Renzini A., Daddi E. Dickinson M., Cimatti A., Tonini C., 2010, preprint, arXiv:1004.4546
- [] Marchesini D., van Dokkum P.G., Förster Schreiber N.M., Franx M., Labbé I., Wuyts S., 2009, ApJ, 701, 1765
- [] Marchesini D. et al., 2010, ApJ, 725, 1277
- [] McLure R.J., et al., 2011, preprint, arXiv:1102.4881
- [] Mihos J.C., Hernquist L., 1994, ApJ, 431, 9
- [] Muñoz-Cuartas J.C., Macciò A.V., Gottlöber S., Dutton A.A., 2010, preprint, arXiv:1007.0438
- [] Nagamine K., Ouchi M., Springel V., Hernquist L., 2008, preprint, arXiv:0802.0228
- [] Narayanan D., Hayward C.C., Cox T.J., Hernquist L., Jonsson P., Younger J.D., Groves B., 2010, MNRAS, 401, 1613
- [] Neistein E., Dekel A., 2008, MNRAS, 383, 615
- [] Neistein E., Weinmann S.M., 2010, MNRAS, 405, 2717 (NW10)
- [] Night C., Nagamine K., Springel V., Hernquist L., 2006, MNRAS, 366, 705
- [] Nishi R., Tashiro M., 2000, ApJ, 537, 50
- [] Noeske K. et al. 2007, ApJ, 660, L43
- [] Nordon R. et al., 2010, A & A, 518, 24
- [] Ocvirk P., Pichon C., Teyssier R., 2008, MNRAS, 390, 1326
- [] Oliver et al., 2010, MNRAS, 405, 2279
- [] Oppenheimer B.D., Davé R., 2006, MNRAS, 373, 1265
- [] Oppenheimer B.D., Davé R., Keres D., Fardal M., Katz N., Kollmeier J.A. Weinberg D.H., 2010, MNRAS406, 2325
- [] Overzier R.A. et al., 2011, ApJ, 726L, 7
- [] Pannella M. et al., 2009, ApJ, 698, 116
- [] Panter B., Jimenez R., Heavens A.F., Charlot S., 2007,MNRAS, 378, 1550
- [] Papovich C., Finkelstein S.L., Ferguson H.C., Lotz J.M., Giavalisco M., 2010, preprint, arXiv:1007.4554
- [] Pérez-González P.G. et al., 2008, ApJ, 675, 234
- [] Rafelski M., Wolfe A.M., Chen H.-W., 2010, preprint, arXiv:1011.6390
- [] Reddy N. A., Steidel C.C., 2009, ApJ, 692, 778
- [] Richard J., Kneib J.-P., Ebeling H., Stark D., Egami E., Fiedler A.K., 2011, preprint, arXiv:1102.5092
- [] Rodighiero G. et al., 2010, A & A, 518, L25
- [] Schaerer D., de Barros S., 2010, A & A
- [] Shim H., Chary R-R., Dickinson M., Lin L., Spinrad H., Stern D., Yan C.-H., 2011, arXiv:1103.4124
- [] Somerville S., Primack J.R., Faber S.M., 2001, MNRAS, 320, 504
- [] Somerville R. S., Hopkins P.F., Cox T.J., Robertson B.E., Hernquist L., 2008, MNRAS, 391, 481
- [] Springel V., White S.D.M., Tormen G., Kauffmann G., 2001, MNRAS, 328, 726
- [] Springel V. et al., 2005, Nature, 435, 629
- [] Stark D.P., Ellis R.S., Bunker A., Bundy K., Targett T., Benson A., Lacy M., 2009, ApJ, 697, 1493
- [] Steidel C.C., Adelberger K.L., Giavalisco M., Dickinson M., Pettini M., 1999, ApJ, 519, 1
- [] Stringer M., Cole S., Frenk C.S., Stark D.P., preprint, arXiv:1011.2745
- [] Teyssier R., Chapon D., Bournaud F., 2010, ApJ, 720, 149
- [] Yabe K., Ohta K., Iwata I., et al., 2009, ApJ, 693, 507
- [] Yan H., Dickinson M., Giavalisco M., Stern D., Eisenhardt P.R.M., Ferguson H.C., 2006, ApJ, 651, 24
- [] Weinmann S.M., Kauffmann G., von der Linden A., De Lucia G., 2010, MNRAS, 406, 2249
- [] Wetzel A.R., 2010, preprint, arXiv:1001.4792
- [] Wilkins S.M., Trentham N., Hopkins A.M., 2008, MNRAS, 385, 687
- [] Wolfe A.M., Chen H.-W., 2006, ApJ, 652, 981