Accretion states of the Galactic microquasar GRS 1758258
Abstract
We present the results of a radio and X-ray study of the Galactic microquasar GRS 1758258, using unpublished archival data and new observations. We focus in particular on the 2000–2002 state transitions, and on its more quiet behaviour in 2008–2009. Our spectral and timing analysis of the XMM-Newton data shows that the source was in the canonical intermediate, soft and hard states in 2000 September 19, 2001 March 22 and 2002 September 28, respectively. We estimate the disk size, luminosity and temperature, which are consistent with a black hole mass . There is much overlap between the range of total X-ray luminosities (on average ) in the hard and soft states, and probably between the corresponding mass accretion rates; in fact, the hard state is often more luminous. The extended radio lobes seen in 1992 and 1997 are still present in 2008–2009. The 5-GHz radio core flux density has shown variability between – mJy over the last two decades. This firmly places GRS 1758258 in the radio-quiet sequence of Galactic black holes, in the radio/X-ray plane. We note that this dichotomy is similar to the dichotomy between the radio/X-ray sequences of Seyfert and radio galaxies. We propose that the different radio efficiency of the two sequences is due to relativistic electron/positron jets in radio-loud black holes, and sub-relativistic, thermally dominated outflows in radio-quiet sources.
keywords:
accretion, accretion discs — X-rays: binaries — X-rays: individual: GRS 1758258 — radio continuum: general — black hole physics.1 Introduction
Understanding the connection between black hole (BH) accretion and jet properties is a fundamental astrophysical problem. It is the key for the modelling of BH growth and feedback effects. Much progress has been achieved over the last two decades, thanks to combined X-ray/radio studies of transient stellar-mass BHs, over timescales of a few months/years. Taken together, X-ray spectral and timing properties, and radio jet properties are the empirical criteria that identify physical “accretion states” (Fender et al., 2004; McClintock & Remillard, 2006).
When the mass accretion rate is below a few percent of the classical Eddington rate, the accretion flow is hotter, geometrically thick, can more easily support a poloidal magnetic field and accelerate/collimate outflows. Radiative efficiency decreases and mechanical efficiency (jet power) increases. Advection-dominated flows may set in (ADAF models: Narayan & Yi 1994; Esin et al. 1997), due to inefficient cooling at low densities. Observationally, the hard state is characterized by flat-spectrum radio emission from the core (direct signature of a continuous, self-absorbed jet), by an X-ray spectrum dominated by a hard power-law (photon index ), and by high short-term variability in the power density spectrum.
At accretion rates above a few percent of the Eddington rate, most stellar-mass BHs are seen to switch to the thermal-dominant (high/soft) state, characterised by an optically thick, geometrically thin disk. This state is radiatively efficient and the jet is suppressed: these BHs are radio quiet. The X-ray emission comes mostly from the inner part of the disk, near the innermost stable circular orbit. The inner radius and peak temperature of the disk depend directly on the accretion rate and BH mass.
However, the physical mechanisms that cause BHs to switch between the hard and soft state are still poorly understood, as are the intermediate states between them. The sample of transient BHs (mostly Galactic BHs with a low-mass donor star), used to define the “canonical” state behaviour may be biased. The luminosity threshold for the collapse of the thick flow and the suppression of the jet changes not only between different sources, but also for individual sources between different outbursts, and between the rising and declining phase of the state transition cycle, due to hysteresis—once it is formed, it takes time for the accretion disk to dissipate after the accretion rate has dropped. Furthermore, some BHs (particularly among the ultraluminous X-ray source class: Soria 2011) do not appear to switch to the thermal-dominant state even at high luminosities, and have an X-ray spectrum persistently dominated by a power-law-like component. The origin of the power law component itself is still unclear, with possible contributions from thermal Comptonization in a hot corona, and synchrotron self-Compton emission from the base of the jet (Markoff et al., 2005).
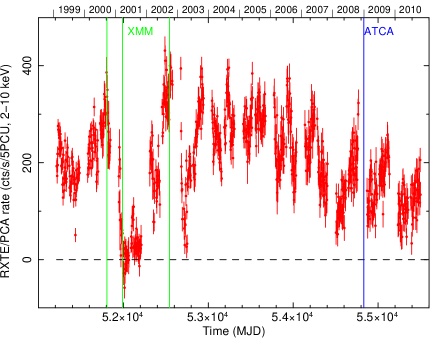
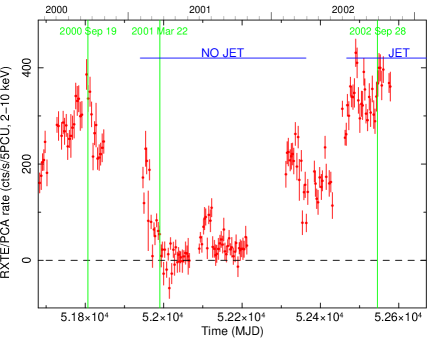
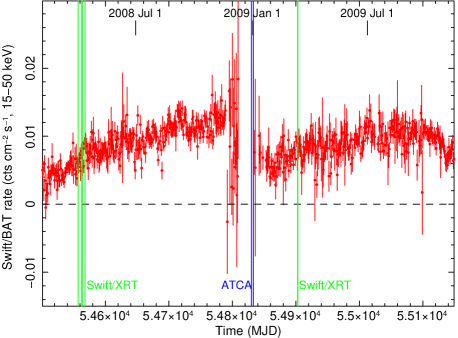
In this paper, we investigate accretion states by studying the X-ray and radio properties of the Galactic microquasar GRS 1758258 (Mandrou, 1990; Sunyaev et al., 1991), which stands out among Galactic BHs for its persistent activity, mostly in a moderately luminous hard state. We focus on its behaviour during 2000–2002 (Figure 1), when it underwent a series of spectral state transitions, and in 2008–2009 (Figure 2), when it was in a more steady hard state. For the X-ray study, we use unpublished XMM-Newton data supplemented by Swift data. For the radio study, we use our recent observation from the Australia Telescope Compact Array (ATCA), supplemented by archival Very Large Array (VLA) data.
2 Main properties of GRS 1758258
The BH candidate GRS 1758258 is located in the direction of the Galactic centre, away from it on the sky. Here we shall assume a distance of kpc. Its BH mass and orbital period are still unknown, because optical studies of the stellar donor are hampered by high extinction (Rothstein et al., 2002; Smith et al., 2002b; Muñoz-Arjonilla et al., 2010). The optical counterpart has a dereddened luminosity consistent with an early A-type main sequence star, but unusual colours (Muñoz-Arjonilla et al., 2010); part of the optical/IR emission may also come from the accretion disk or the jet.
GRS J1758258 has a point-like core with radio and X-ray emission, and an extended lobe structure, with a projected distance of arcmin between the lobes ( pc at kpc). The radio core is variable or transient. For example, we already knew that it was undetected ( mJy) at 6 cm in early 1992 (Rodríguez et al., 1992), when the BH was in an X-ray soft state. It was detected at variable flux levels – mJy in 1992 September, when the BH switched back to the hard state, in 1993 and in 1997 (Mirabel & Rodríguez, 1994; Martí et al., 2002; Hardcastle, 2005). The extended radio lobes, with an optically-thin synchrotron spectrum, appear to be persistent structures rather than fast-moving ejections (Hardcastle, 2005). This is slightly unusual for Galactic microquasars (Heinz, 2002).
In contrast with a sparse radio coverage, there has been an almost continuous hard X-ray monitoring over the last two decades with GRANAT, CGRO, RXTE, INTEGRAL and Swift (Lin et al., 2000; Smith et al., 2002a, b; Pottschmidt et al., 2006; Lohfink et al., 2011). There was also a series of four Chandra observations in 2000–2001 (Heindl & Smith, 2002a), and three XMM-Newton observations in 2000–2002 (Goldwurm et al., 2001; Miller et al., 2002). The X-ray data show that the source is always active (unusual for Galactic BHs with low-mass donor stars), with a variability by a factor of a few. It has spent most of the last two decades in a hard state, with occasional transitions to an intermediate or soft state. The typical – keV luminosity is – erg s-1, corresponding to accretion rates – Eddington for typical stellar-mass BHs with masses and radiative efficiency .
| Date | RMS Noise | Beam | Beam | |
|---|---|---|---|---|
| (Jy) | (Jy/beam) | FWHM | PA | |
| 2001-02-01 | ||||
| 2001-02-06 | ||||
| 2001-03-14 | ||||
| 2001-03-22 | ||||
| 2001-03-25 | ||||
| 2001-04-16 | ||||
| 2001-04-29 | ||||
| 2001-05-19 | ||||
| 2001-06-05 | ||||
| 2001-06-11 | ||||
| 2001-06-18 | ||||
| 2001-07-08 | ||||
| 2001-07-24 | ||||
| 2001-08-04 | ||||
| 2001-08-09 | ||||
| 2001-08-16 | ||||
| 2001-08-26 | ||||
| 2001-08-30 | ||||
| 2001-09-07 | ||||
| 2001-11-05 | ||||
| 2001-12-04 | ||||
| 2002-01-25 | ||||
| 2002-02-03 | ||||
| 2002-02-27 | ||||
| 2002-03-22 | ||||
| 2002-03-30 | ||||
| 2002-07-12 | ||||
| 2002-07-29 | ||||
| 2002-08-05 | ||||
| 2002-08-13 | ||||
| 2002-09-18 | ||||
| 2002-12-07 | ||||
| 2003-01-18 | ||||
| 2003-02-06 | ||||
| 2003-02-26 | ||||
| 2003-07-31 | ||||
| 2003-10-27 | ||||
| 2003-11-21 |
| Date | Instrument | Mode | Exp time |
|---|---|---|---|
| 2000-09-19 | pn | Small Window | 8.97 ks |
| MOS1 | Timing | 9.87 ks | |
| MOS2 | Partial RFS | 1.33 ks | |
| 2001-03-22 | pn | Large Window | 18.43 ks |
| MOS1 | Partial W2 | 20.95 ks | |
| MOS2 | Partial W2 | 20.95 ks | |
| RGS1+2 | Spectro+Q | 2 18.3 ks | |
| 2002-09-28 | pn | Small Window | 5.94 ks |
| MOS1 | Timing | 8.28 ks | |
| MOS2 | Partial W2 | 8.36 ks | |
| RGS1+2 | Spectro+Q | 2 8.53 ks | |
| 2008-04-01 | XRT | PC | 6.9 ks |
| WT | 0.45 ks | ||
| 2008-04-06 | XRT | PC | 3.3 ks |
| WT | 0.38 ks | ||
| 2008-04-07 | XRT | PC | 3.5 ks |
| WT | 0.23 ks | ||
| 2008-04-11 | XRT | PC | 7.4 ks |
| WT | 0.61 ks | ||
| 2009-03-12 | XRT | WT | 2.08 ks |
| 2009-03-13 | XRT | WT | 5.04 ks |
3 Radio observations
3.1 VLA data from 2001–2003
We searched the NRAO VLA Archive Survey database111http://www.aoc.nrao.edu/vlbacald/ for observations of GRS 1758258 during the 2000–2003 sequence of state transitions. A total of 38 unpublished, processed radio maps at 4.86 GHz were found covering the period 2001 February 1 – 2003 November 21 (Table 1). The median root-mean-square (rms) noise level near GRS 1758258 is about 75 Jy beam-1. We usually found that the best way to determine the core flux density was either to fit a point-source elliptical Gaussian, or to use the flux density of the peak pixel in the map. However, for the maps from 2003 February 6 and 26, where it appears that the core is extended, we instead summed the pixels in a box or polygon surrounding the component. The angular resolution was generally too fine to obtain lobe flux measurements (the extended emission was resolved out), and the few maps with lower angular resolution did not have enough sensitivity; therefore, we only used the VLA maps for studying the core emission.
3.2 ATCA observations from 2008–2009
We observed GRS 1758258 at 6 cm with the ATCA in four separate sessions over the period 2008 December 29 – 2009 January 02. The array configuration was 6C, with minimum and maximum baselines of 153 and 6000 m, respectively. We observed simultaneously in two bands centred at 4800 and 5423 MHz, each with an effective bandwidth of 104 MHz. The total integration time on-source was 35.03 h, spread approximately evenly across the four sessions. The primary calibrator was B1934638, and B1752225 the secondary calibrator.
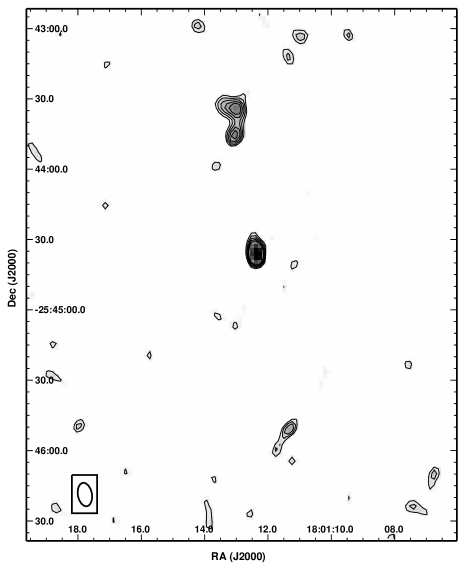
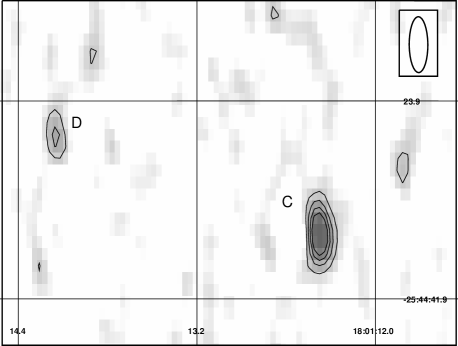
Data reduction and imaging was carried out with miriad (Sault et al., 1995). We imaged all of the data together using a robust weighting parameter (Briggs, 1995) of 0.5; the effective frequency of the combined data is 5.09 GHz. In addition, the multi-frequency deconvolution task mfclean (Sault & Wieringa, 1994) was used because of the frequency gap between the two bands. The cleaned, primary-beam-corrected image (Figure 3) has an angular resolution of (beam position angle ). We also tapered the data to produce an image with the same resolution as the map made from the combined 1992 and 1997 VLA data (Fig. 3 in Martí et al. 2002); the angular resolution in this case is (beam position angle ). A tapered map provides better sensitivity to the low-surface-brightness extended emission from the lobes, which is resolved out in our higher-resolution image. In the vicinity of GRS 1758258, the rms noise levels in the two maps are 16 Jy beam-1 (higher resolution) and 26 Jy beam-1 (tapered). Moreover, we estimate that the calibration uncertainty relative to B1934638 is about 5 per cent in both cases.
4 Main results of our radio study
4.1 Radio core behaviour during 2001–2003
The behaviour of the radio core during the 2001 soft state transition mirrored that observed during the previous major soft transition in 1992 (Gilfanov et al., 1993; Grebenev et al., 1997; Keck et al., 2001). Between 1992 January and July, the core was undetected at 5 GHz, at a flux density mJy (Mirabel & Rodríguez, 1994). It was detected again on 1992 September 10–26 at mJy (Mirabel & Rodríguez, 1994) as the X-ray source returned to a harder state. It remained visible and varied between – mJy during 1993 (Mirabel & Rodríguez, 1994), and between – mJy in 1997 (Lin et al., 2000; Martí et al., 2002; Hardcastle, 2005), while the X-ray source persisted in a hard state.
Systematic VLA monitoring started again in 2001 February (Table 1), when the core was not detected, down to a limit of mJy (3 times the rms noise). At that epoch, the X-ray source was undergoing a series of rapid spectral state changes (Smith et al., 2001a). The short transition timescale suggests that there was already a full disc, partly covered by a rapidly varying Comptonizing region (as discussed in Sections 6.1, 7.2, and in Smith et al. 2001a). At the end of 2001 February, GRS 1758258 settled into a steadier soft state (Smith et al., 2001a). The radio core continued to be undetected during that month, down to mJy (Table 1). It was undetected throughout the rest of 2001, although the VLA observations were too short to place very stringent constraints. When the RXTE/PCA X-ray monitoring resumed on 2002 February 5, the – keV count rate had already increased to a value close to its long-term average (Figure 1), consistent with a return to an intermediate or hard X-ray state. However, the radio core was still undetected to mJy until at least 2002 March 30 (Table 1). The radio jet finally appeared in the 2002 July 12 snapshot, at a 5-GHz flux density mJy. It was then detected in every subsequent observation from 2002 and 2003 (peak pixel in all cases), varying between – mJy (Table 1).
Overall, the radio core behaviour is in agreement with the theoretical expectations and with the behaviour of other Galactic BH transients (Corbel et al., 2001; Fender et al., 2004; Belloni et al., 2010): the jet is suppressed when the X-ray source is in a disk-dominated thermal state. It appears that the jet had already vanished or at least strongly declined in the intermediate states immediately before and after the soft state (2001 February and 2002 January–March). However, the sparse sampling and shallow VLA detection limits do not allow us to constrain the transition more strongly.
4.2 Radio core and lobes in 2008–2009
We found core emission centred at RA(J2000) , Dec(J2000) (Figure 1), with an error of in RA and in Dec. This is still consistent with the position determined from the highest-resolution VLA observations (Muñoz-Arjonilla et al., 2010, and from our direct re-analysis of the VLA data). In the higher-resolution image, the integrated core flux density, determined from an elliptical Gaussian fit with the miriad task imfit, is mJy. Similarly, the integrated core flux density in the tapered map is mJy. Though there is a hint of source extension for the core component in the higher-resolution map (Figure 3, bottom panel), more sensitive data are required to confirm this. The location of the two extended lobes is also consistent with those mapped in the 1997 observations (Martí et al., 2002; Hardcastle, 2005). The peak flux density in the northern lobe (also known as VLA source B) is Jy beam-1 at RA(J2000) , Dec(J2000) . Its integrated flux density is mJy, which we determined by summing the pixels in a box surrounding the lobe. The peak flux density in the southern lobe (VLA source A) is Jy beam-1 at RA(J2000) , Dec(J2000) ; we cannot get a reliable integrated flux density because the signal-to-noise level is too low. We do not have enough sensitivity in the tapered image to determine whether the lobes have changed in flux and morphology. The integrated flux density for the northern lobe was listed as mJy in 1992 (Rodríguez et al., 1992) and mJy in 1997 (Martí et al., 2002). We also note that the nearby VLA source D, located north-east of GRS 1758258, well visible in 1992 and 1997 (Rodríguez et al., 1992; Martí et al., 2002; Hardcastle, 2005) and interpreted as a background source, has faded somewhat; its peak flux density in the higher-resolution image is mJy beam-1.

5 X-ray observations
5.1 XMM-Newton observations from 2000–2002
GRS 1758258 was observed with XMM-Newton on 2000 September 19, 2001 March 22 and 2002 September 28 (Table 2): that is, immediately before, during and immediately after the 2001 soft state. An analysis of the 2001 Reflection Grating Spectrograph (RGS) data was presented by Miller et al. (2002). Here we present the results of the European Photon Imaging Camera (EPIC) observations in the three epochs, and of the 2002 RGS observation; we also re-examine the RGS spectrum from 2001 in view of the new EPIC results.
We downloaded the Observation Data Files from the public archive and used the Science Analysis System (SAS) version 10.0.0 (xmmsas_20100423) to process and filter the event files and extract spectra and lightcurves. We selected single and double events (pattern for the pn and pattern for the MOS), with the standard flagging criteria #XMMEA_EP and #XMMEA_EM for the pn and MOS respectively. After building response and ancillary response files with the SAS tasks rmfgen and arfgen, we used XSPEC (Arnaud, 1996) version 12 for spectral fitting, and standard FTOOLS tasks for timing analysis.
The observing modes for the three EPIC instruments reflect attempts to reduce a potential pile up problem. In 2000, the pn camera was in small window mode, MOS1 in timing mode, and MOS2 in the non-standard prime partial refresh frame store (RFS) mode. In 2001, the pn was in large window mode, and both MOSs in partial window mode. In 2002, the pn was in small window mode, MOS1 in timing mode, and MOS2 in partial window mode. The EPIC data are clearly affected by pile up: typical pn count rates in a circle were ct s-1 and ct s-1 for the MOS in the first two observations, and about half that value in the third observations. We expect a deterioration in the response for count rates ct s-1 for the pn in small window mode, and ct s-1 in large window mode; pile up affects the MOS for rates ct s-1 in small window mode. The MOS1 observations in timing mode from 2000 and 2002 do not suffer from pile-up. However, using timing data for spectral analysis introduces its own set of calibration uncertainties, that are probably as significant as the pile-up error.
We used the SAS task epatplot to estimate the level of pile up for different source extraction regions, by comparing the observed and expected distribution of single and multiple events. After several tests, we chose to extract the source spectra from annuli between an inner radius of and an outer radius of . We repeated the extraction and spectral analysis for source annuli with inner radii of , and and found that the difference in the fit parameters were within the error bars of the values for a inner radius. Thus, we cannot completely eliminate the errors due to pile-up, but we are confident that they are a small effect compared with the spectral state transitions discussed in this paper.
Another calibration issue we had to deal with is the use of the RFS read-out mode for the 2000 MOS2 observation. This mode has been used only for few observations with high count rates (e.g., the Crab Nebula and the N132D supernova remnant) at very early stages of the XMM-Newton mission. The flux in this observing mode has never been properly calibrated. After consultations with the calibration scientists, and from a comparison with those early observations, we concluded that the RFS mode underestimates the true flux by about 30%, but the spectral shape is mostly reliable, consistent with spectra obtained in other modes. To double-check that, we fitted the 2000 MOS2 spectra twice: once independently, and once with fit parameters fixed equal to the pn parameters but with a free normalization constant (which turned out to be , as expected).
For the pn observation in large window mode, we extracted the background from three circles at sufficiently large distances from the source. For the 2000 and 2002 pn observations, in small window mode, we extracted the background from two circular regions of radius, located at the bottom of the observing window, from the source position. However, we checked that the background count rate is only modestly significant for the 2000 pn observation, when it is of the source count rate, and slightly affects the spectral fit only at energies keV. In 2001 and 2002, the background count rate is of the source rate, and its effect on the spectral shape is much less than the errors due to calibration uncertainties and pile-up corrections. For the MOS observations, we could not extract a background from the central chip because the whole observing window is affected by the source emission. From the count rate in the outer chips, we estimated that the MOS background rate in our fitting band is in all three epochs, and can be safely ignored.
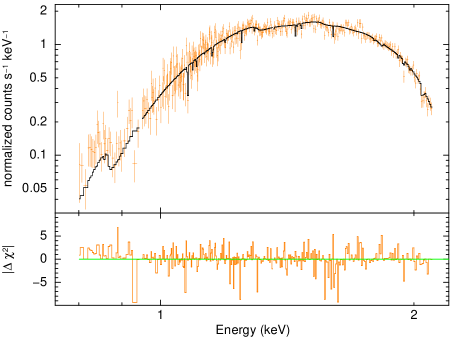
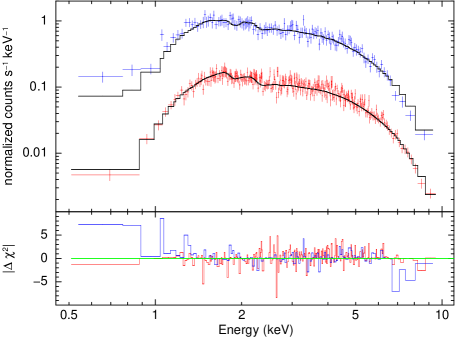
For all spectral fits, we rebinned the spectra to a minimum of 30 counts per bin, so that we could use Gaussian statistics. For plotting purposes only, we rebinned the data to a minimum signal-to-noise ratio of 12 for the pn and 6 for the MOS spectra. We fitted the pn spectra in the – keV range, and the MOS spectra in the – keV range. We plotted the spectra down to keV in Figure 4 for illustration purposes only. The small discrepancy between pn and MOS at – keV may be due to a number of reasons: a different level of pile-up, a higher contamination from extended thermal emission or nearby soft sources in the pn (which has a larger point spread function), a more complex structure of the absorbing medium, or cross-calibration uncertainties. A soft excess below keV is also clearly visible in the RGS spectra from 2001 (Miller et al., 2002). In any case, these are minor uncertainties, irrelevant to the main objectives of our spectral study.
The XMM-Newton/RGS data were also processed and analysed from the Observation Data Files with the sas 10.0 software. Both RGS detectors were operated in the standard Spectro+Q mode for the 2001 and 2002 observations. (Unfortunately, during the 2000 observation both RGS1 and RGS2 were inactive and thus no RGS data were obtained.) We filtered out time intervals with count rates ct s-1 in CCD number 9, which is the most affected by background flares. For the 2001 observation, we removed ks, leaving a net exposure time of ks for each RGS detector. For the 2002 observation, the background level was lower and no time filtering was required; the net exposure time is ks. After extracting the source and background spectra, we created response matrices with rgsproc. For the purpose of spectral fitting, we combined the first-order spectra and response matrices of RGS1 and RGS2 for each observation, using the SAS task rgscombine. The channels in the RGS spectra were then rebinned by a factor of 2 to increase the number of counts per bin. We used the – keV energy range (– Å) for spectral fitting in xspec.
5.2 Swift/XRT observations in 2008–2009
We want to relate our ATCA radio observations of 2008–2009 to the X-ray spectral state at the time. To do that, we looked for archival X-ray observations as close as possible to that epoch. Swift/XRT observed the source four times between 2008 April 01–11, and twice on 2009 March 12–13 (Table 2; see NASA’s Heasarc data archive for a more detailed logbook). We used the on-line XRT data product generator (Evans et al., 2009) to extract lightcurves and spectra, including background and ancillary response files; we selected grade 0–12 events. We downloaded the suitable spectral response files for single and double events in photon-counting (PC) mode and window-timing (WT) mode from the latest Calibration Database (2009 December 1).
In both the 2008 and 2009 observations, the XRT count rate is high enough (a few counts s-1) to create serious pile-up problems in PC mode, but not in WT mode. To attenuate the pile-up problem, the source extraction procedure (Evans et al., 2009) first determines whether the count rate within a 30 pixel () radius is counts s-1: that is the level at which the observed single-pixel event rate is of the input single-pixel event rate (Vaughan et al., 2006). Then, a point-spread-function profile is obtained and compared with a default non-piled-up profile. From this, the extraction procedure determines the radius within which the two profiles differ significantly. Finally, the source extraction region is defined as the annulus between that radius and .
The WT-mode spectra do not suffer from pile up (it would only be significant at counts s-1). However, the lack of spatial information does not allow background subtraction. That appears to be a problem at low energies ( keV), for the particle induced background. In fact, at every epoch when both PC and WT spectra are available, the latter show a low-energy excess with respect to the PC, which is most likely due to soft proton contamination rather than true emission from the source. At energies keV, PC and WT spectra agree within the observational error.
We examined the four individual spectra from the 2008 and the two spectra from 2009, and found that the multiple spectra from each epoch were consistent with each other. The Swift/BAT lightcurve (Figure 2) confirms that there were no unsual flares or state transitions during the two epochs. We coadded the spectra from each of the two epochs to increase the signal to noise. We rebinned and fitted the coadded spectra with XSPEC Version 12.
| Parameter | pn Value | MOS2 Value |
|---|---|---|
| Model: phabs*phabs*(diskbb+pow) | ||
| () | ||
| () | ||
| () | ||
| Parameter | pn Value | MOS2 Value |
|---|---|---|
| Model: const*phabs*phabs*(diskbb+pow) | ||
| Const | ||
| Parameter | pn Value | MOS1 Value | MOS2 Value |
|---|---|---|---|
| Model: phabs*phabs*(diskbb+pow) | |||
| Parameter | pn Value | MOS2 Value |
|---|---|---|
| Model: phabs*phabs*pow | ||
| Const | ||
| Model: const*phabs*phabs*(diskbb+pow) | ||
| Const | ||
| Model: const*phabs*phabs*bknpow | ||
| Const | ||
6 Main results of our X-ray study
6.1 X-ray spectral state in 2000–2002
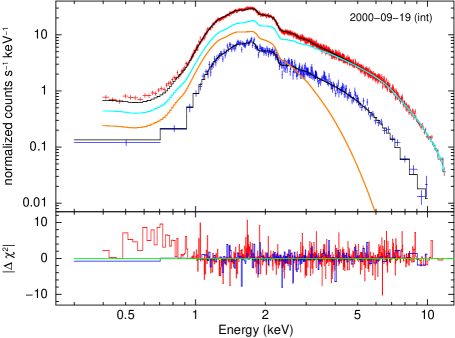
The main finding of our spectral analysis is that the source was in three different states during the three epochs: intermediate state (similar contributions from disk and power-law components) in 2000; soft state (disk dominated) in 2001; and hard state (power-law dominated) in 2002. Here we will give a more detailed description of the spectral properties in the three states.
For the 2000 dataset, we used EPIC pn and MOS2 for the spectral analysis; we used MOS1 for the timing analysis (Section 6.2). We knew that the EPIC MOS2 calibration would underestimate the flux by (Section 5.1). We fitted the pn and MOS2 data in two different ways: first, with fully independent parameters, and then by locking the fit parameters together but allowing for a free normalization factor in the MOS2. We find that single component models (either power-law or disk-blackbody) are ruled out, but an absorbed disk-blackbody plus power law model provides an acceptable fit. Overall, the pn and MOS parameters are consistent with each other (Tables 3,4), if we consider all the uncertainties outlined in Section 5.1. The power-law photon index ; the disk colour temperature keV; the disk normalization . Following a conventional procedure, for fitting purposes, we split the total column density into a fixed Galactic “line-of-sight” component (Kalberla et al., 2005)222Although in this case we are only looking half way through the Galaxy, so the true line-of-sight extinction may be about half of that value. and a free additional intrinsic component. The total column density cm-2 is similar to the values reported in previous X-ray studies. The unabsorbed luminosity in the – keV band is erg s-1, and the direct disk emission contributes for in this band.
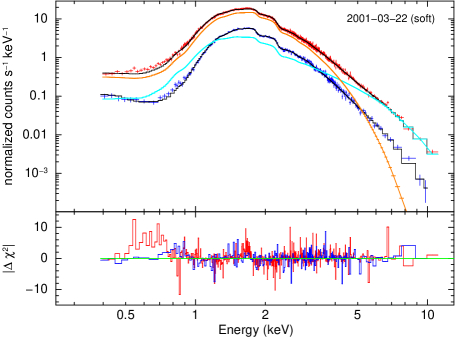
In 2001, all three EPIC instruments were set in spectral modes. We fitted them independently and found that they give a consistent result (Table 5). The X-ray spectrum is again well fitted with an absorbed disk-blackbody plus power-law model. This time, the disk-blackbody component dominates, and the spectrum is consistent with a canonical high/soft state. We are unable to remove the discrepancies between the three instruments in some of the fitting parameters. However, we need to take into account that the pn (large window mode) was more heavily piled up than the MOS—hence, a larger fraction of its soft flux is incorrectly shifted to higher energies (cf. in Table 4). Furthermore, MOS2 had several columns, straddling the source extraction region, that were nominally unflagged but returned an anomalously low count rate compared with other regions symmetrically placed with respect to the source position. Based on these considerations, we believe that MOS1 provides the most accurate spectral fit parameters in 2001. In summary, the power-law index , the disk colour temperature keV, and the disk normalization . The direct thermal emission from the disk contributes of the – keV luminosity. Luckily, there is a VLA observation taken almost simultaneously with the XMM-Newton observation, on 2001 March 22: the radio core was undetected down to mJy (Table 1), which confirms that the source was in the thermal-dominant state.
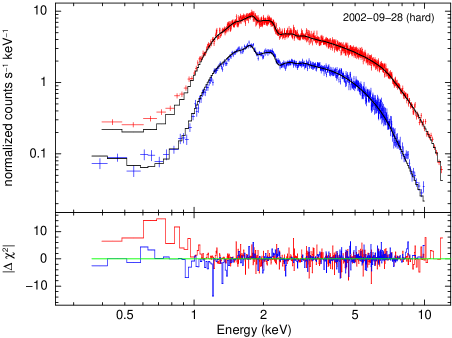
In 2002, we used EPIC pn and MOS2 for our spectral analysis. The pile-up problem was somewhat less severe, and we found no other instrumental problems. We fitted the data simultaneously, keeping the fit parameters constant apart from a free normalization factor (Table 6). We found that a simple power-law with is an acceptable fit. Adding a disk-blackbody component does not provide a significant improvement to the fit, and the disk temperature remains very low and essentially unconstrained (also because of the high column density). We obtain a moderate, statistically significant improvement ( statistic value ) by replacing the single power law with a broken power law (Table 6), with a slope at keV, and at higher energies. Equally good fits are obtained using Comptonization models that account for the small degree of curvature in the spectrum. The closest VLA observation to this epoch was taken on 2002 September 18, and shows radio flux from the core, at mJy (Table 1); this confirms that the jet had started again.
We tried to estimate a “total” X-ray luminosity by extrapolating the EPIC spectra to – keV in the three epochs. We have strong evidence from other satellite observations (Gilfanov et al., 1993; Kuznetsov et al., 1999; Lin et al., 2000; Keck et al., 2001; Pottschmidt et al., 2006) that the power-law spectrum extends to keV, at least in the hard state; on one occasion, it extended to keV (Lohfink et al., 2011). The – keV luminosity was erg s-1 in the intermediate state, erg s-1 in the soft state, and erg s-1 in the hard state. In the hard state, part of the accretion power is transferred as kinetic energy to the electrons in the corona and/or jet. So, hard states should be less radiatively efficient than the thermal-dominant state. Given the inferred luminosities, it is very likely that the mass accretion rate was also slightly higher in the hard state than in the soft state (unless the former was moderately beamed, see Section 7.2). This is unusual for Galactic BHs, as previously noted (Smith et al., 2001a; Pottschmidt et al., 2006). Also unusual is the fact that over 20 years, the total X-ray luminosity has varied only by a factor of 3.
In all three epochs, the pn and MOS1 timing-mode spectra have a small excess at energies keV, but that is not seen in the other MOS spectra, which have a higher spatial resolution and lower background contamination. This residual emission is inconsistent with the highly absorbed blackbody plus power-law components used to model the spectrum at energies keV. It can be formally modelled with an additional optically-thin thermal plasma component at eV behind a line-of-sight column density. We suggest that these residuals are due to imperfectly-subtracted diffuse background emission, and are unrelated to the point-like emission from GRS 1758258, but we do not have enough data to prove it, also taking into account the additional uncertainties due to pile-up.
The RGS spectra (Figure 6) are consistent with the interpretation resulting from the EPIC spectra. In 2001, the RGS spectrum is dominated by a thermal component with a small power-law excess at high energies. The RGS energy band is not sufficient to constrain the power-law component, so we fixed its slope and normalization to the best-fitting values derived from the MOS1 data (Table 5). We obtain that the best-fitting inner-disk temperature, normalization and total column density are also the same as in the MOS1 spectrum (Table 7). The small difference between our results and those of Miller et al. (2002) is due to our different choice of the power-law component. In 2002, there is no need for a thermal component: the RGS spectrum is well fitted with an absorbed power law (Table 7). The photon index of the RGS spectrum is slightly steeper than in the simultaneous EPIC spectra, but marginally consistent considering the large error. Hints of a small soft excess below keV (both in 2001 and 2002) are consistent with what is seen in the EPIC-pn spectra. We do not detect any significant features emission lines either in 2001 or in 2002.
| Parameter | 2001 Value | 2002 Value |
|---|---|---|
| – | ||
| – | ||
6.2 X-ray time variability in 2000–2002
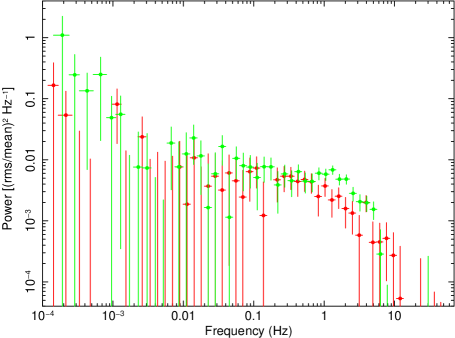
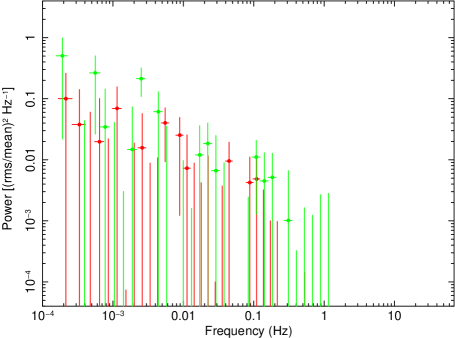
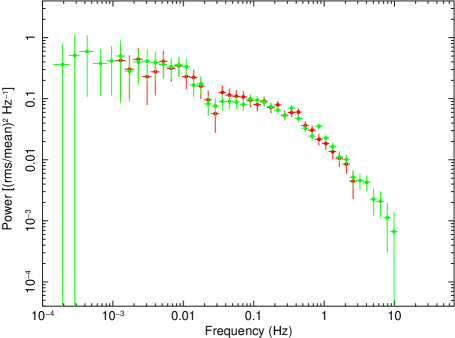
We examined the variability of GRS 1758258 in the three epochs. For each epoch, we used MOS1 (in timing mode for the 2000 and 2002 observations) and pn (which provides the highest count rate). We extracted lightcurves binned to 0.01 s, from the same regions used for the spectral analysis. We computed the Fourier transforms (powspec task in FTOOLS), normalized the resulting power spectra to be the fractional mean squared variability per unit frequency interval, and subtracted the Poisson noise level.
In the 2000 dataset, we found significant short-term variability below 10 Hz, with a power-law red noise component becoming dominant below Hz, a flat top between – Hz, and a steepening above Hz. We do not have enough signal to noise to determine whether there are quasi-periodic oscillations at – Hz, as found by Lin et al. (2000) from the 1997 RXTE observations, but the MOS1 power spectrum hints at their presence (Figure 7, top panel). The rms fractional variability between and Hz is . In 2001, the short term variability was much reduced: the rms fractional variability is consistent with zero. There may be a weak power-law noise component similar to the one seen in the 2000 lightcurves. The 2002 observations show the highest degree of short-term variability, with rms . The strong band-limited noise has a break at Hz. In summary, the timing properties of GRS 1758258 in the three epochs are consistent with those of the canonical intermediate state (probably soft intermediate), high/soft state and low/hard state respectively (Belloni et al., 1996; Méndez et al., 1998; Reig et al., 2003; Motta et al., 2009; Belloni et al., 2010), in perfect agreement with the spectral identification.
6.3 X-ray spectral state in 2008–2009
The Swift/BAT hard X-ray monitoring during 2008–2009 (Figure 2) suggests that the source was in the hard state during that time, before and after our ATCA observation. The discontinuity in the X-ray monitoring between December and January is due to the unfavourable solar orientation, and does not represent significant evidence of state transitions. The X-ray hard state is consistent with our radio core detection between the two epochs (Section 4.2).
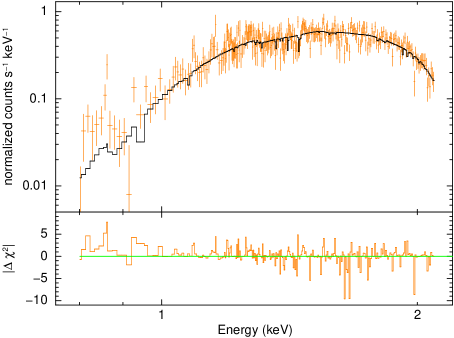
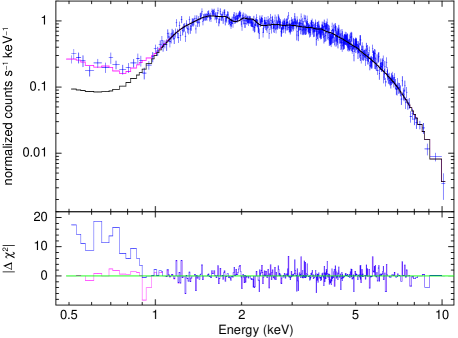
The coadded 2008 April spectra have an on-source time of 21.1 ks in PC mode and 1.7 ks in WT mode. Both spectra are well fitted above 0.9 keV by a simple power-law model with photon index (Table 8, Figure 8) and total column density cm-2. In fact, a simple power law is a good fit for all the (background-subtracted) PC-mode data, down to 0.5 keV. In WT mode, there is a small excess at energies keV, similar to the excess found in some XMM-Newton spectra. We attribute this excess either to unsubtracted particle background or to extended thermal-plasma emission around the source. Overall, the spectral parameters are very similar to those found in 2002 (Table 6 and section 6.1), but the luminosity is a factor of 2 lower.
The 2009 March spectra were taken only in WT mode. Considering the systematic uncertainty of using a timing mode for spectral analysis, we found that both a simple power-law and a broken power-law model provide acceptable fits to the data above 0.9 keV (Table 9, Figure 8); the broken power-law is preferred, suggesting mild spectral curvature. For this reason, equally good fits can be obtained either with phenomenological combinations of a straight power-law and broad-band curved components in the XSPEC arsenal, or with (more physical) Comptonization models (Lohfink et al., 2011). In any case, the photon index over the whole fitting band is again typical of the hard state. There is, again, a small excess at energies keV. That soft component is not consistent with a disk-blackbody spectrum behind the same column density as the power-law emission. As noted before (Section 6.1), it can formally be fitted with an optically-thin thermal plasma component at eV and only line-of-sight column density. We do not think that this soft excess comes directly from GRS 1758258.
In both the 2008 and 2009 Swift datasets, the total X-ray luminosity was erg s-1, a factor of 2 lower than in the 2002 hard state observation. Therefore, in this case, the hard state luminosity was slightly lower than the 2001 soft state luminosity, unlike what is seen in other (more luminous) hard state observations of this BH. This confirms that the spectral state of this BH is not solely determined by the total luminosity or mass accretion rate. Based on these data alone, we cannot speculate about the physical structure of the accretion flow in the 2008–2009 hard state: e.g., whether it was a truncated disk plus advective region, or a full disk covered by a hot corona or outflow. This issue will be investigated elsewhere (Lohfink et al., 2011).
| Parameter | PC Value | WT Value |
|---|---|---|
| Model: const*phabs*phabs*pow | ||
| Const | ||
| Parameter | Value |
|---|---|
| Model: phabs*phabs*pow | |
| Model: phabs*phabs*bknpow | |
7 Discussion
7.1 Disk size and BH mass
The peak colour temperature of the disk is similar (– keV) in the two epochs of our XMM-Newton observations when a disk component is directly visible (Tables 3,4,5). A colour temperature keV was also found by Pottschmidt et al. (2006) from INTEGRAL observations in 2003 March–April, another epoch when the X-ray spectrum was dominated by the soft thermal component. RXTE/PCA observations from 2001 February–March (a few days before our 2001 observations) also showed a dominant disk component with keV (Smith et al., 2001a). A Chandra/ACIS HETG spectrum from 2001 March 24 showed a peak colour temperature keV (Heindl & Smith, 2002b).
The presence of a soft excess was suggested even when the source was in a harder, power-law dominated state. ROSAT/PSPC observations from 1993 March 31–April 1 are consistent with a thermal component with keV (Mereghetti et al., 1994; Keck et al., 2001); in the ASCA observations of 1995 March 29–30, there are hints of a heavily Comptonized seed thermal component with – keV (Mereghetti et al., 1997). However, both observations can also be fitted with simple power laws (Mereghetti et al., 1997; Keck et al., 2001).
The simplest explanation for this consistent value of the temperature is that it corresponds to the peak colour temperature of a full disk, extending all the way to the innermost stable circular orbit. If so, . Since the X-ray luminosity and probably the total accretion rate have varied only by a factor over the last two decades, the peak temperature of a full disk (not significantly hardened by Comptonization) should vary only by a factor , that is only . Most Galactic BH transients have typical disk temperatures keV in their high/soft state (Remillard & McClintock, 2006), with X-ray luminosities a few erg s-1. GRS 1758258 has an X-ray luminosity erg s-1; if its BH has a similar mass to the other Galactic BHs, we do indeed expect a disk temperature keV when all or most of the accretion power is directly radiated by the disk. That is the only state when we can constrain the BH mass from the disk temperature.
We can use the disk normalization parameter for a more quantitative estimate of its BH mass. The best-fit value found in the 2000 XMM-Newton dataset certainly underestimates the thermal emission from the full disk, because at least half of the disk photons have been upscattered into the power-law. This would not change the observed disk temperature but would reduce its flux normalization. In 2001, the disk component dominates and our most reliable spectral fits suggest . The 2003 INTEGRAL study gives during another soft state (Pottschmidt et al., 2006). Let us take an average value of for the sake of our ballpark mass estimate: then, the apparent inner radius km. The physical inner radius km (Kubota et al., 1998). The inclinaton angle is unknown, but the source is unlikely to be perfectly face-on (given the extended jet lobe structure), or edge-on (because no X-ray eclipses have been seen). Assuming a Schwarzschild BH () we obtain a characteristic mass , typical of Galactic stellar-mass BHs, and therefore an average X-ray luminosity Eddington.
7.2 Disk and corona during state transitions
Taken individually, all three main spectral states of GRS 1758258 are similar to the canonical states of Galactic BHs (Remillard & McClintock, 2006; Fender et al., 2004). The characteristic long-term X-ray luminosity erg s-1 is also consistent with the characteristic threshold for state transitions. However, the transition between states in GRS 1758258 is unusual, as previously noted (Smith et al., 2001a; Pottschmidt et al., 2006). The radiatively-efficient soft state has a slightly lower total luminosity333The dramatic drop in the – keV flux detected by RXTE (Figure 1) is largely compensated by the increase in flux from the disk, below keV., and hence lower mass accretion rate, than during most (not all) of the long-duration hard state. For example, our XMM-Newton spectral analysis shows that during the 2001 soft state, the source was slightly less luminous than in the harder states of 2000 and 2002, although slightly more luminous than in the 2008–2009 hard state. Moreover, the disk component has been seen to appear and disappear over very short timescales (Table 10), but always with a peak colour temperature – keV. This is difficult to reconcile with the disk truncation/refill scenario (Esin et al., 1997, 1998) that is often taken as the standard paradigm for hard/soft transitions in Galactic BHs.
| Epoch | Spectral State | Disk Temperature | Power-law Slope | Radio Core? | References |
|---|---|---|---|---|---|
| 2000 Jan–Aug | Hard | disc not seen | – | ? | [1] |
| 2000 Sep | Int | keV | – | ? | [1,2] |
| 2000 Oct–Dec | Hard | disc not seen | – | ? | [1] |
| 2001 Jan 23 | Int | keV | ? | [1,3] | |
| 2001 Jan 29–Feb 21 | Hard | disc not seen | – | NO | [1,3] |
| 2001 Feb 27 | Soft | keV | ? | [3,4] | |
| 2001 Mar 2–24 | Soft | keV | – | NO | [2,3,4,5] |
| 2001 Apr–Nov | Soft | ? | ? | NO | [2,6,7] |
| 2002 Jan–Mar | Int? | ? | ? | NO | [2,4,7] |
| 2002 Jul–2003 Feb | Hard | ? | ? | YES | [2,6,7] |
| 2002 Sep 28 | Hard | disc not seen | – | YES? | [2] |
| 2003 Mar–Apr | Soft/Int | keV | ? | [6,8] |
As an alternative explanation, Smith et al. (2001a, 2002a) suggested that a full accretion disk is already present before the hard-to-soft transition, and is still present at least for some time after the return to the hard state. In this scenario, sometimes the disk is directly visible, but more often it is completely covered by a Comptonizing medium above it. The presence of full disks with inner radii close to the innermost stable circular orbit even in the low/hard state, at luminosities Eddington, was suggested by Reis et al. (2010) from their study of several Galactic BH transients. Their findings suggest that transitions from the high/soft state to the low/hard state may be driven by changes in the corona (perhaps related to jet formation) rather than by the disappearance of the accretion disc. The behaviour of GRS 1758258 suggests the same scenario for transitions in the both directions, from hard to soft and vice versa, over short periods of time.
One mechanism to produce a rapidly changing corona over a steady disk is the two-flow scenario (Smith et al., 2001a, 2002a; Chakrabarti & Titarchuk, 1995): a keplerian accretion flow feeds the disk (evolving over a viscous timescale) and an independent sub-keplerian flow feeds the hot Compton cloud (evolving over a dynamical timescale). Soft states correspond to the temporary shutoff of the sub-keplerian flow. One difficulty of this scenario is that the donor is a low-mass star, an unlikely source for a low-angular-momentum component of the accretion flow.
We suggest another possibility: the hard emission component may come from a magnetically-powered coronal outflow. Radio studies provide independent evidence that there is a jet during the hard states. Coronal magnetic fields may dissipate a large fraction of accretion power and transport it out as Poynting flux or as a magnetically driven wind (Merloni & Fabian, 2002; Kuncic & Bicknell, 2004). In this scenario, the accretion flow may switch between a standard disk and a coronal outflow in response to changes in the configuration of the poloidal magnetic field, and hence in the fraction of angular momentum transported by the azimuthal-vertical component of the magnetic stress rather than by the radial component. The underlying full disk may always be present even during the outflow dominated phases, but it will be masked by the outflow, and also colder and less luminous than in the disk dominated phases, for the same mass inflow rate (Jolley & Kuncic, 2008). Switches between a colder and a hotter disk phase may occur on the thermal timescale, which is shorter than the viscous timescale required to regrow a disk from large radii (: Frank et al., 2002). Magnetohydrodynamic simulations suggest (De Villiers et al., 2003, 2005; Hawley & Krolik, 2006) that magnetized outflows are not isotropic: they are confined by funnel walls. In this scenario, we speculate that for GRS 1758258 we are looking down the funnel, so that the apparent luminosity of the hard state is enhanced by a factor of a few compared with the luminosity in the soft thermal state (which has a more isotropic emission). This would make the true luminosity and accretion rate of the hard state lower than in the soft state, as observed in most other Galactic BHs.
7.3 Radio louder and radio quieter microquasars
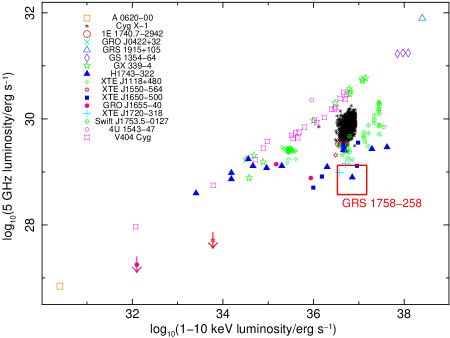
There is now strong evidence, from both the 1992 and 2001 state transitions, that the jet in GRS 1758258 switches off during soft states, similarly to most other stellar-mass BH transients. This is the basis of the canonical model for the disc-jet coupling in black hole X-ray binaries (Fender et al., 2004) and AGN (Körding et al., 2006). When accreting BHs are in the jet-dominated state, there is a fundamental correlation between their X-ray luminosity and radio core luminosity (Merloni et al., 2003; Gallo et al., 2003; Falcke et al., 2004). As more and more Galactic BHs have been studied in radio and X-ray bands, it was found (Gallo, 2007; Soleri et al., 2010; Calvelo et al., 2010; Soleri & Fender, 2011) that there are two distinct groups or sequences of sources, with similar X-ray luminosity and hard spectral state but radio luminosities differing by a factor –.
GRS 1758258 belongs to the radio-quieter group, despite its characteristic large-scale radio jet and lobes. In fact, this source is the radio quietest of all Galactic BHs in that X-ray luminosity range, – times fainter that the radio-loud sequence (Figure 9). Even if its X-ray luminosity were revised downwards by a factor of a few due to geometrical beaming (Section 7.2), GRS 1758258 would still be in the radio-quieter group.
The existence of radio-loud and radio-quiet stellar-mass BHs is reminiscent of the AGN classification. For a given range of black hole masses and accretion rates, some kinds of active galaxies have stronger jets than others (Wilson & Colbert, 1995; Sikora et al., 2007). In the case of AGN, this dichotomy corresponds to morphological differences in the host galaxy: elliptical galaxies are generally more radio-loud than disk galaxies. It is still not clear what corresponding environmental parameter is associated to the radio dichotomy in stellar-mass BHs: no obvious dependence was found on orbital periods, disc sizes, outburst history (Soleri & Fender, 2011).
Spin is often suggested as the intrinsic physical difference between radio loud and radio quiet BHs: fast-spinning black holes can launch more powerful jets (Blandford, 1990). This is consistent with the scenario that black holes in giant elliptical galaxies evolved to higher spins than those in spiral galaxies. However, we do not have enough reliable spin measurements for stellar-mass BHs to test whether the same correlation applies there. It is also still unclear whether the jet power has a direct contribution from the BH spin (Blandford & Znajek, 1977; McNamara et al., 2010; Fender et al., 2010). Furthermore, Broderick & Fender (2011) suggest that BH spin has considerably less impact on AGN jet power than has been previously reported.
Alternatively, the radio dichotomy in stellar-mass BHs may reflect different modes of disc/jet coupling (Soleri & Fender, 2011), or different structures of the accretion flow in the hard state. For example, the efficiency of jet launching may be different between an ADAF-like configuration (truncated disk and hot, advective inner region) and a disc-plus-corona structure (corona on top of a full disk). Both accretion states may be phenomenologically classified as “low/hard state” with similar X-ray properties, but different radio properties.
We note that the observed presence of two distinct sequences of Galactic BHs in the radio/X-ray luminosity plane (Figure 9) is similar to the dichotomy between radio galaxies (including both FRII and FRI objects) and Seyfert galaxies. Both radio galaxies and Seyferts show a strong correlation between core radio and X-ray luminosity (Fig. 2 in Panessa et al. 2007), or core radio and [OIII] luminosity (Fig. 4 in Bicknell 2002), which is another proxy for the radiative accretion luminosity. But the two sequences are shifted by almost three orders of magnitude, with Seyfert galaxies being fainter in the radio for a given X-ray luminosity. Even after both samples are normalized by their masses, according to the fundamental plane relations (Merloni et al., 2003), they still form two distinct sequences, shifted by a factor in radio luminosity (Fig. 7, right panel, in Panessa et al. 2007). Similarly, Broderick & Fender (2011) plotted radio loudness (also determined using core radio luminosities, and with a mass correction applied) as a function of the Eddington ratio. They found that radio galaxies are on average more radio-loud than Seyfert galaxies and LINERS by a factor of for Eddington ratios per cent.
By analogy with the model of Bicknell (2002), we suggest that this dichotomy corresponds to the different radio efficiency of relativistic electron-positron jets (the radio loud sequence) and sub-relativistic, thermally dominated baryonic jets (the radio quiet sequence). In this scenario, there is still a universal correlation between jet power and radiative luminosity, but the same jet power corresponds to different radio outputs in fast leptonic and slow mass-loaded jets. Possible observational tests of this hypothesis include measurements of circular polarization in the radio core, and of the location and intensity of the 511 keV annihilation line. For sources where the jet creates a plasma cocoon around the BH, comparison of the radio luminosity with the mechanical power necessary to inflate the bubble can also constrain the fraction of jet energy carried by protons and ions.
7.4 Extended radio lobes
Our 2008–2009 ATCA observations confirm the presence of extended radio lobes at apparently the same position as in 1992 and 1997, within the uncertainty due to different beam sizes and sensitivities. Such structures are common in radio galaxies but much rarer and fainter in microquasars. It was suggested (Heinz, 2002) that microquasars lack persistent lobes because they are mostly located in a low-density environment compared with AGN (scaled to their respective jet powers), so that any lobes formed have short lifetimes against adiabatic losses. Ejections of fast-moving synchrotron-emitting blobs are well documented in transient Galactic BHs such as GRS 1915105 (Rodríguez & Mirabel, 1999), GRO J165540 (Tingay et al., 1995), and XTE J1550564 (Corbel et al., 2002); see also Mirabel & Rodríguez (1999) for a comprehensive review. Such ejecta tend to decelerate and fade over shorter timescales (months or few years), after travelling a characteristic distance pc (Hao & Zhang, 2009).
The distance between the core and the lobes of GRS 1758258 is an order of magnitude larger than that. Thus, they are unlikely to be individual blob ejections from a historical (unrecorded) outburst, unless the source is located in a very large cavity, that allowed the ejections to move that far before stopping. A more likely explanation is that the lobes correspond to the locations where the heads of a pair of continuous jets (moving in opposite directions) encounter the interstellar medium and dissipate their bulk kinetic energy. Our new radio observations confirm the energy content inferred by Hardcastle (2005), that is a few erg in relativistic electrons. If the jet power is similar to the radiative core power, that is erg s-1 (as is the case for example in Cyg X-1: Russell et al. 2007), such energy can be supplied in a few years. This would also imply that the lobe energy content, and therefore radio flux, can vary on a characteristic timescale of a few years, in response to changes in the injection power.
However, this estimate is very uncertain because we do not yet know the fraction of kinetic and thermal energy stored in protons, ions and non-relativistic electrons. In several extra-Galactic jet sources, an independent estimate of the integrated jet power is available from the size of the jet-inflated cocoon around the BH. In those cases, the total jet power can be up to a few hundred times higher than the power transferred to the radio-emitting relativistic electrons (Cavagnolo et al., 2010; Soria et al., 2010; Pakull et al., 2010). Moreover, the radio core of GRS 1758258 is to times fainter, at a given X-ray luminosity, than the “standard” radio-loud class of Galactic BHs (Section 7.3; Soleri et al., 2010; Soleri & Fender, 2011). We do not know whether that means that the total kinetic jet power (including both leptons and baryons) is correspondingly lower, or only the fraction of kinetic power carried into the lobes by the relativistic electrons is lower. But in either case, the kinetic power energizing the radio-emitting electrons in the lobes is more likely to be erg s-1. corresponding to a timescale yrs, comparable to the flux decay timescale due to adiabatic expansion (Hardcastle, 2005).
8 Conclusions
We have studied the Galactic BH GRS 1758258 in the X-ray and radio bands, during its spectral state transitions of 2000–2002, and during the hard state of 2008–2009. We showed that a compact jet is present during the hard state, and switches off in the soft state. We identified the X-ray states from their spectral and timing properties, constrained the disk parameters during the soft and intermediate state, and estimated a BH mass and an X-ray luminosity –.
We discussed its unusual X-ray state behaviour: the apparent luminosities in the hard and soft states overlap; in fact, it is often higher in the hard state. Since radiative efficiency in the hard state must be at least slightly lower than in the soft (thermal) state, this implies that the mass accretion rate in the hard state is often higher than in the soft state (assuming there is no beaming). This suggests that another physical parameter is more important than changes in the total mass accretion rate, for driving state transitions. The sequence of spectral variability in 2001 also suggests that a full disk was already present at least for several weeks before the main soft transition, when the X-ray source was in a hard or intermediate state. We conclude that the hard state of GRS 1758258 may not be the same as the low/hard state of other BH transients successfully modelled with truncated disks plus ADAFs; it may be an example of a Comptonizing corona/outflow on top of the disk.
We showed that the radio lobes, first seen in 1992, were still present in 2009, apparently at the same location. This supports their interpretation as long-lived relic structures, perhaps associated with the interaction of the jet with the interstellar medium. We are leaving a more detailed study of the lobe evolution to a planned long-term ATCA radio monitoring of this source over the next few years. We measured the radio core luminosity in a series of unpublished VLA monitoring observations over 2001–2003, and compared it with the radio core fluxes measured in 1992–1993, 1997 and 2008–2009. When the compact jet is detected, the 5-GHz flux typically varies between – mJy. Comparing this with the X-ray luminosity, we showed that GRS 1758258 belongs to the radio-faint sequence of Galactic BHs in the radio/X-ray plane. The dichotomy between radio-loud and radio-faint stellar-mass BHs for the same X-ray luminosity and spectral state is reminiscent of a similar dichotomy between Seyfert and radio galaxies in the fundamental plane. BH spin is often suggested as a possible explanation, with fast-spinning BHs able to launch more powerful jets at the same accretion rate. We suggested an alternative explanation: both the radio-loud and radio quiet sequences may have the same jet power at a given accretion rate, but radio-loud BHs have a relativistic electron/positron jet, and radio-quiet BHs (such as GRS 1758258) a sub-relativistic, mass-loaded jet, which is less efficient at emitting synchrotron radiation for the same kinetic power.
Acknowledgments
We thank Maria Diaz-Trigo, Rob Fender, James Miller-Jones, Manfred Pakull, David Smith, Kinwah Wu for useful discussions, and Tasso Tzioumis for assistance with the ATCA observations. RS is grateful for the financial support from Tsinghua University (Beijing) during part of this research. JWB acknowledges support from the UK Science and Technology Facilities Council.
References
- Arnaud (1996) Arnaud, K. A. 1996, Astronomical Data Analysis Software and Systems V, eds. G. Jacoby and J. Barnes, ASP Conf. Series volume 101, 17
- Belloni et al. (2010) Belloni, T. M. 2010, LNP, 794, 53
- Belloni et al. (1996) Belloni, T. M., Méndez, M., van der Klis, M., Hasinger, G., Lewin, W. H. G., van Paradijs, J. 1996, ApJ, 472, L107
- Bicknell (2002) Bicknell, G. V. 2002, NewAR, 46, 365
- Blandford (1990) Blandford, R. D. 1990, in Active Galactice Nuclei, ed. T. J.-L. Courvoisier & M. Mayor (Berlin: Springer), 161
- Blandford & Znajek (1977) Blandford, R. D., & Znajek, R. L. 1977, MNRAS, 179, 433
- Briggs (1995) Briggs D. S., 1995, PhD Thesis, New Mexico Institute of Mining and Technology, Socorro (New Mexico); available online from the NRAO Library, http://www.aoc.nrao.edu/dissertations/dbriggs/
- Broderick & Fender (2011) Broderick, J. W., & Fender, R. P. 2011, MNRAS, submitted
- Calvelo et al. (2010) Calvelo, D. E., et al. 2010, MNRAS, 409, 839
- Cavagnolo et al. (2010) Cavagnolo, K. W., McNamara, B. R., Nulsen, P. E. J., Carilli, C. L., Jones, C., & Bîrzan, L. 2010, ApJ, 720, 1066.
- Chakrabarti & Titarchuk (1995) Chakrabarti, S. K., & Titarchuk, L. G. 1995, ApJ, 455, 623
- Corbel et al. (2001) Corbel, S., et al. 2001, ApJ, 554, 43
- Corbel et al. (2002) Corbel, S., Fender, R. P., Tzioumis, A. K., Tomsick, J. A., Orosz, J. A., Miller, J. M., Wijnands, R., Kaaret, P. 2002, Science, 298, 196
- De Villiers et al. (2003) De Villiers, J. P., Hawley, J. F., & Krolik, J. H. 2003, ApJ, 599, 1238
- De Villiers et al. (2005) De Villiers, J. P., Hawley, J. F., Krolik, J. H., & Hirose, H. 2005, ApJ, 620, 878
- Esin et al. (1997) Esin, A. A., McClintock, J. E., & Narayan, R. 1997, ApJ, 489, 865
- Esin et al. (1998) Esin, A. A., Narayan, R., Cui, W., Grove, J. E., & Zhang, S.-N. 1998, ApJ, 505, 854
- Evans et al. (2009) Evans, P. A., et al. 2009, MNRAS, 397, 1177
- Falcke et al. (2004) Falcke, H., Körding, E., & Markoff, S. 2004, A&A, 414, 895
- Fender et al. (2004) Fender, R. P., Belloni, T. M., & Gallo, E. 2004, MNRAS, 355, 1105
- Fender et al. (2010) Fender, R. P., Gallo, E., & Russell, D. 2010, MNRAS, 406, 1425
- Frank et al. (2002) Frank, J., King, A., & Raine, D. J. 2002, Accretion Power in Astrophysics, Cambridge University Press.
- Gallo (2007) Gallo, E. 2007, in Antonelli L. A. et al., eds, AIP Conf. Proc. Vol. 924, The Multicolored Landscape of Compact Objects and Their Explosive Origins, Am. Inst. Phys., New York, p. 715
- Gallo et al. (2006) Gallo, E., Fender, R. P., Miller-Jones, J. C. A., Merloni, A., Jonker, P. G., Heinz, S., Maccarone, T. J., & van der Klis, M. 2006, MNRAS, 370, 1351
- Gallo et al. (2003) Gallo, E., Fender, R. P., & Pooley, G. G. 2003, MNRAS, 344, 60
- Gilfanov et al. (1993) Gilfanov, M., et al. 1993, ApJ, 418, 844
- Goldwurm et al. (2001) Goldwurm, A., Israël, D., Goldoni, P., Ferrando, P., Decourchelle, A., Mirabel, F. I., & Warwick, R. S. 2001, AIPC, 587, 61
- Grebenev et al. (1997) Grebenev, S. A., Pavlinsky, M. N., & Sunyaev, R. A. 1997, Proceedings of the 2nd INTEGRAL Workshop, “The Transparent Universe”, St Malo, France (September 1996), eds. C. Winkler, T. Courvoisier, & P. Durouchoux, ESA-SP 382, 183
- Hao & Zhang (2009) Hao, J.-F., & Zhang, S. N. 2009, ApJ, 702, 1648
- Hardcastle (2005) Hardcastle, M. J. 2005, A&A, 434, 35
- Hawley & Krolik (2006) Hawley, J. F., & Krolik, J. H. 2006, ApJ, 641, 103
- Heindl & Smith (2002a) Heindl, W. A., & Smith, D. M. 2002, ApJ, 578, L125
- Heindl & Smith (2002b) Heindl, W. A., & Smith, D. M. 2002, ASP Conference Proceedings, 262, 241
- Heinz (2002) Heinz, S. 2002, A&A, 388, L40
- Jolley & Kuncic (2008) Jolley, E. J. D., & Kuncic, Z. 2008, ApJ, 676, 351
- Kalberla et al. (2005) Kalberla et al. 2005, A&A, 440, 775
- Keck et al. (2001) Keck, J. W., et al. 2001, ApJ, 563, 301
- Körding et al. (2006) Körding, E. G., Jester, S., & Fender, R. 2006, MNRAS, 372, 1366
- Kubota et al. (1998) Kubota, A., Tanaka, Y., Makishima, K., Ueda, Y., Dotani, T., Inoue, H., & Yamaoka, K. 1998, PASJ, 50, 667
- Kuncic & Bicknell (2004) Kuncic, Z., & Bicknell, G. V. 2004, ApJ, 616, 669
- Kuznetsov et al. (1999) Kuznetsov, S. I., et al. 1999, Astron. Lett., 25, 351
- Lin et al. (2000) Lin, D., et al. 2000, ApJ, 532, 548
- Lohfink et al. (2011) Lohfink, A. M., Pottschmidt, K., Marcu, D. M., Wilms, J., Reynolds, C. S., & Cadolle Bel, M. 2011, submitted
- McNamara et al. (2010) McNamara, B. R., Rohanizadegan, M., & Nulsen, P. E. J. 2010, ApJ, 727, 39
- McClintock & Remillard (2006) McClintock, J. E., & Remillard, R. A. 2006, in Compact Stellar X-ray Sources, eds W. H. G. Lewin & M. van der Klis, Cambridge Astrophysics Series (Cambridge University Press), 39, 157
- Mandrou (1990) Mandrou, P. 1990, IAUC 5032, 1
- Markoff et al. (2005) Markoff, S., Nowak, M. A., & Wilms, J. 2005, ApJ, 635, 1203
- Martí et al. (2002) Martí, J., Mirabel, I. F., Rodríguez, L. F., & Smith, I. A. 2002, A&A, 386, 571
- Méndez et al. (1998) Méndez, M., Belloni, T., & van der Klis, M. 1998, ApJ, 499, L187
- Mereghetti et al. (1994) Mereghetti, S., Belloni, T., & Goldwurm, A. 1994, ApJ, 433, L21
- Mereghetti et al. (1997) Mereghetti, S., Cremonesi, D. I., Haardt, F., Murakami, T., Belloni, T., & Goldwurm, A. 1997, ApJ, 476, 829
- Merloni & Fabian (2002) Merloni, A., & Fabian, A. C. 2002, MNRAS, 332, 165
- Merloni et al. (2003) Merloni, A., Heinz, S., & di Matteo, T. 2003, MNRAS, 345, 1057
- Miller et al. (2002) Miller, J. M., Wijnands, R., Rodriguez-Pascual, P. M., Ferrando, P., Gaensler, B. M., Goldwurm, A., Lewin, W. H. G., & Pooley, D. 2002, ApJ, 566, 358
- Mirabel & Rodríguez (1994) Mirabel, I. F., & Rodríguez, L. F. 1994, AIPC, 304, 413
- Mirabel & Rodríguez (1999) Mirabel, I. F., & Rodríguez, L. F. 1999, ARA&A, 37, 409
- Motta et al. (2009) Motta, S., Belloni, T. M., & Homan, J. 2009, MNTAS, 400, 1603
- Muñoz-Arjonilla et al. (2010) Muñoz-Arjonilla, A. J., Mart’i, J., Luque-Escamilla, P. L., Sánchez-Sutil, J. R., Sánchez-Ayaso, E., Combi, J. A., & Mirabel, I. F. 2010, A&A, 519, 15
- Narayan & Yi (1994) Narayan, R., & Yi, I. 1994, ApJ, 428, L13
- Pakull et al. (2010) Pakull, M. W., Soria, R., & Motch, C. 2010, Nature, 466, 209
- Panessa et al. (2007) Panessa, F., Barcons, X., Bassani, L., Cappi, M., Carrera, F. J., Ho, L. C., & Pellegrini, S. 2007, A&A, 467, 519
- Pottschmidt et al. (2006) Pottschmidt, K., Chernyakova, M., Zdziarski, A. A., Lubiński, P., Smith, D. M., & Bezayiff, N. 2006, A&A, 452, 285
- Pottschmidt et al. (2008) Pottschmidt, K., et al. 2008, Proceedings of the 7th INTEGRAL Workshop, “An INTEGRAL View of Compact Objects”, Copenhagen, Denmark (September 2008), p.98
- Reig et al. (2003) Reig, P., Belloni, T. M., & van der Klis, M. 2003, A&A 412, 229
- Reis et al. (2010) Reis, R. C., Fabian, A. C., & Miller, J. M. 2010, MNRAS, 402, 836
- Remillard & McClintock (2006) Remillard, R. A., & McClintock, J. E. 2006, ARA&A, 44, 49
- Rodríguez & Mirabel (1999) Rodríguez, L. F., & Mirabel, I. F. 1999, ApJ, 511, 398
- Rodríguez et al. (1992) Rodríguez, L. F., Mirabel, I. F., & Martí, J. 1992, ApJ, 401, L15
- Rothstein et al. (2002) Rothstein, D. M., Eikenberry, S. S., Chatterjee, S., Egami, E., Djorgovski, S. G., & Heindl, W. A. 2002, ApJ, 580, L61
- Russell et al. (2007) Russell, D. M., Fender, R. P., Gallo, E., & Kaiser, C. R. 2007, MNRAS, 376, 1341
- Sault & Wieringa (1994) Sault, R. J., & Wieringa, M. H. 1994, A&AS, 108, 585
- Sault et al. (1995) Sault R. J., Teuben P. J., & Wright M. C. H. 1995, in R. A. Shaw, H. E. Payne, J. J. E. Hayes eds, ASP Conf. Ser. 77, Astronomical Data Analysis Software and Systems IV. Astron. Soc. Pac., San Francisco, p. 433
- Shakura & Sunyaev (1973) Shakura, N. I., & Sunyaev, R. A. 1973, A&A, 24, 337
- Sikora et al. (2007) Sikora, M., Stawarz, L., & Lasota, J.-P. 2007, ApJ, 658, 815
- Smith et al. (2001a) Smith, D. M., Heindl, W. A., Markwardt, C. B., & Swank, J. H. 2001a, ApJ, 554, L41
- Smith et al. (2002a) Smith, D. M., Heindl, W. A., & Swank, J. H. 2002a, ApJ, 569, 362
- Smith et al. (2002b) Smith, D. M., Heindl, W. A., & Swank, J. H. 2002b, ApJ, 578, L129
- Smith et al. (2001b) Smith, D. M., Markwardt, C., Heindl, W. A., & Swank, J. H. 2001b, IAUC, 759, 3
- Soleri et al. (2010) Soleri, P., et al. 2010, MNRAS, 406, 1471
- Soleri & Fender (2011) Soleri, P., & Fender, R. 2011, MNRAS, submitted (arXiv:1101.1214)
- Soria et al. (2010) Soria, R., Pakull, M. W., Broderick, J. W., Corbel, S., & Motch, C. 2010, MNRAS, 409, 541
- Soria (2011) Soria, R. 2011, AN, accepted (arXiv:1009.5986)
- Sunyaev et al. (1991) Sunyaev, R., et al. 1991, A&A, 247, L29
- Tingay et al. (1995) Tingay, S. J., et al. 1995, Nature, 374, 141
- Vaughan et al. (2006) Vaughan, S. et al. 2006, ApJ, 638, 920
- Wilson & Colbert (1995) Wilson, A. S., & Colbert, E. J. M. 1995, ApJ, 438, 62