The catalogue of positions of optically bright extragalactic radio sources OBRS–1
Abstract
It is expected that the European Space Agency mission Gaia will make possible to determine coordinates in the optical domain of more than 500 000 quasars. In 2006, a radio astrometry project was launched with the overall goal to make comparison of coordinate systems derived from future space-born astrometry instruments with the coordinate system constructed from analysis of the global very long baseline interferometry (VLBI) more robust. Investigation of their rotation, zonal errors, and the non-alignment of the radio and optical positions caused by both radio and optical structures are important for validation of both techniques. In order to support these studies, the densification of the list of compact extragalactic objects that are bright in both radio and optical ranges is desirable. A set of 105 objects from the list of 398 compact extragalactic radio sources with declination was observed with the VLBA+EVN with the primary goal of producing their images with milliarcsecond resolution. These sources are brighter than 18 magnitude at V band, and they were previously detected at the European VLBI network. In this paper coordinates of observed sources have been derived with milliarcsecond accuracies from analysis of these VLBI observations following the method of absolute astrometry. The catalogue of positions of 105 target sources is presented. The accuracies of sources coordinates are in the range of 0.3 to 7 mas, with the median 1.1 mas.
Subject headings:
astrometry — catalogues — surveys1. Introduction
The method of Very Long Baseline Interferometry (VLBI) first proposed by Matveenko et al. (1965) allows us to derive the position of sources with nanoradian precision (1 nrad 0.2 mas). The first catalogue of source coordinates determined with VLBI contained 35 objects (Cohen & Shaffer 1971). Since then, hundreds of sources have been observed under geodesy and astrometry VLBI observing programs at 8.6 and 2.3 GHz (X and S bands) using the Mark3 recording system at the International VLBI Service for Geodesy and Astrometry (IVS) network. Analysis of these observations resulted in the ICRF catalogue of 608 sources (Ma et al. 1998). Later, over 6000 sources were observed in the framework of the VLBA Calibrator Survey (VCS) program (Beasley et al. 2002; Fomalont et al. 2003; Petrov et al. 2005, 2006; Kovalev et al. 2007; Petrov et al. 2008), the VLBA regular geodesy RDV program (Petrov et al. 2009b), the VLBA Imaging and Polarimetry Survey (VIPS) (Helmboldt et al. 2007; Petrov & Taylor 2011a), the VLBA Galactic plane Survey (VGaPS) (Petrov et al. 2011b), the on-going Australian Long Baseline Array Calibrator Survey (LCS) (Petrov et al. 2011c), and several other programs. The number of extragalactic sources with positions determined from analysis of observations under absolute astrometry or geodesy programs reached 6455 by June 2011, and it continues to grow rapidly due to analysis of new observations and an on-going campaign of in depth re-analysis of old observations.
The catalogue of positions of all these compact extragalactic radio sources determined with VLBI111Available at http://astrogeo.org/rfc. with accuracies in a range of 0.05–30 mas forms a dense grid on the sky that can be used for many applications, such as differential astrometry, phase-referencing VLBI observations of weak objects, space navigation, Earth orientation parameter determination, and space geodesy. To date, this position catalogue is the most precise astrometric catalogue. However, this high accuracy of positions of listed objects can be exploited directly only by applications that utilize the VLBI technique. Applications that use different observational techniques can benefit from the high accuracy of VLBI positions only indirectly by observing common objects from the VLBI catalogue with instruments at other wavelengths. For last three decades significant efforts were made for connecting the VLBI position catalogue and existing optical catalogues made with the use of ground instruments. An overview of the current status of radio-optical connection and detailed analysis of the differences between VLBI and optical source positions can be found in Andrei et al. (2009). According to them, the standard deviation of the differences between the VLBI and optical catalogues is mas. It was shown by Zacharias & Zacharias (2008) that when modern dedicated ground-based observations are used, the differences are close to 30 mas.
This level of agreement between VLBI and optical positions roughly corresponds to the position accuracy of common objects from ground optical catalogues, typically at a level of 100 mas. The European Space Agency space-born astrometry mission Gaia, scheduled to be launched in 2013, according to Lindegren et al. (2008) promises to reach sub-mas accuracies of determining positions of quasars of 16–20 magnitude that will rival accuracies of absolute astrometry VLBI. Since position catalogues produced with Gaia and VLBI will be completely independent, their mutual rotations, zonal differences and possibly other systematic effects can be interpreted as errors of one of the techniques after resolving the differences due to a misalignment of centers of optic and radio images of quasars and a frequency-dependent core-shift (Kovalev et al. 2008; Porcas 2009; Sokolovsky et al. 2011). Investigation of systematic differences will be very important for the assessment of the overall quality of Gaia results and, possibly, the errors in the VLBI position catalogue.
This comparison will produce valuable results if 1) it will be limited to those common sources which VLBI positions are known with errors smaller than several tenths of a milliarcsecond; 2) the number of sources will be large enough to derive meaningful statistics; and 3) the sources will be uniformly distributed over the sky. However, the number of quasars that are a) bright both in optical and radio wavelengths and therefore, can be detected with both techniques (e.g. brighter than magnitude 18 as suggested by Mignard (2003)) and b) have a compact core, currently is rather limited. Among 3946 radio sources with observed with the VLBA in the absolute astronomy mode, 508 objects have an association with a quasar or a BL Lac object brighter than V from the catalogue of Veron-Cetty & Veron (2010) within a search radius.
It was realized in mid 2000s that the densification of the list of such objects is desirable. A specific program for identifying new VLBI sources in the northern hemisphere, suitable for aligning the VLBI and Gaia coordinate systems, was launched in 2006 (Bourda et al. 2008) with the eventual goal of deriving highly accurate position of sufficiently radio-bright quasars from VLBI observations in the absolute astrometry mode. Since the current VLBI position catalogue is complete to the correlated flux density level of 200 mJy, the new candidate sources should necessarily be by a factor of 2–4 weaker than that level. The original observing sample consisted of 447 optically bright, relatively weak extragalactic radio sources with declinations above . The detailed observing scheme of this project is presented in Bourda et al. (2008). The first VLBI observations resulted in the detection of 398 targets with the European VLBI Network (EVN) (Bourda et al. 2010), although no attempt to derive their positions of produce images was made. VLBI observations of this sample in the absolute astrometry mode promises to increase the number of optically bright radio sources with precisely known positions by 80%.
As a next step of implementing this program, a subset of 105 detected sources was observed with the global VLBI network that comprises the VLBA and EVN observing stations with the goal of revealing their morphology on milliarcsecond scales from VLBI images (Bourda et al. 2011) for consecutive screening the objects with structure that potentially may cause non-negligible systematic position errors. I present here results of astrometric analysis from this VLBI experiment. Observations and their analysis are described in sections 2 and 3. The position catalogue is presented in 4. Concluding remarks are given in section 7.
2. Observations
The observations used in this paper were carried out during a 48-hour experiment GC030 on 7–9 March 2008 with a global VLBI array comprising ten VLBA and 6 EVN stations (eflsberg, hartrao, medicina, noto, onsala60, and dss63 for part of the time), simultaneously at S and X bands. The data were recorded at 512 Mbps. The schedule was prepared by ensuring a minimum of three 5 minute long scans of each target source, while minimizing the slewing time from source to source. In total, 115 objects, including 105 target sources and 10 strong calibrators were observed during a 48-hour observing session. Three target objects were observed in 2 scans, 20 target objects were observed in 3 scans, 43 target objects were observed in 4 scans, 26 objects were observed in 5 scans, 10 objects were observed in 6 scans, 2 objects were observed in 7 scans, and 1 object was observed in 8 scans. Antennas spent 78% time recording signal from target sources.
Although the overall goal of the observing program was absolute astrometry, the design the GC030 experiment suffered several limitation and was not favorable for determining sources coordinates with high accuracy. First, the intermediate frequencies were selected to cover a continuous range at both S and X-bands: 2.22699–2.29099 GHz and 8.37699–8.44099 GHz respectively. There were two rationals behind selection that frequency setup (P. Charlot (2011), private communication). First, at the beginning of 2008, the 512 Mbps mode was new. At that time, that setup was tested only for a case of contiguously allocated intermediate frequencies (IFs). It was not clear whether every non-VLBA station will be able to support the wide-band mode. Since it happened in the past when a change in frequency setup ruined experiments, it was decided to stay on the safe side and make the schedule using contiguously spread IFs. Second, it was known (for example, D. Gordon, private communication, 2010) that AIPS implementation of fringe fitting, task FRING, does not produce correct group delays when the IFs are spread over the wide band. As a workaround, all absolute astrometry/geodesy experiments prior 2010 were processed using a two-step approach: first the fringe fit was made using data from each IF individually, and then group delays over entire band were computed using fringe phases from each individual IF derived in the previous step. The drawback of that approach is that a source should be detected at each IF individually, which raises the detection limit by , where is the number of IFs at each band (4 in our case). Since the target sources were expected to be weak, it was important to avoid a degradation of the detection limit by a factor of 2. Work for developing an alternative fringe fitting procedure (Petrov et al. 2011b), free from this drawback was underway in 2008, when the experiment was scheduled, but not finished at that time. Unfortunately, group delays determined with the contiguously frequency setup are one order of magnitude less precise with respect to the frequency allocation traditionally used for absolute astrometry work with the VLBA.
The second limitation of the GC030 schedule for astrometry use was a relatively rare observation of sources at low and high elevations for better estimation of troposphere path delay in zenith direction. It was found in the past that if to observe calibrator sources at low and high elevations at each station every 1–2 hours, the reliability of estimates of the path delay in the neutral atmosphere is significantly improved, and as a result, systematic errors caused by mismodeling propagation effects are reduced (Petrov et al. 2005).
The third limitation of the GC030 schedule was a small number of sources observed in prior astrometry/geodesy programs at dual S/X bands: only 19 objects. Observations of a large number of sources, typically 30–60 objects in a 24 hour experiment, overlapping with previous observations helps to establish firmly the orientation of the array and to link positions of new sources with positions of other objects.
3. Data analysis
The data were correlated at the Socorro hardware VLBA correlator. The correlator computed the spectrum of cross correlation and autocorrelation functions with frequency setup of 0.25 MHz at accumulation intervals of 1.048576 s long.
The procedure of further analysis is described in full details in Petrov et al. (2011b). Here only a brief outline is given. At the first step, the fringe amplitudes were corrected for the signal distortion in the sampler and then calibrated according to measurements of system temperature and elevation-dependent gain. Since the log files from VLBA sites for the second half of the experiment were lost, no phase calibration was applied. Then the group delay, phase delay rate, group delay rate, and fringe phase were determined for all observations for each baseline at X and S bands separately using the wide-band fringe fitting procedure. These estimates maximize the amplitude of the sum of the cross-correlation spectrum coherently averaged over all accumulation periods of a scan and over all frequency channels in all IFs. After the first run of fringe fitting, 12 observations at each baseline with the strongest signal to noise ratios (SNR) were used to adjust the station-based complex bandpass corrections, and the procedure of computing group delays was repeated. This part of analysis is done with software222Available at http://astrogeo.org/pima.. Then the results of fringe fitting were exported to the VTD/post-Solve VLBI analysis software333Available at http://astrogeo.org/vtd. for interactive processing group delays with the SNR high enough to ensure that the probability of false detection is less than 0.001. This SNR threshold is for the GC030 experiment. Detailed description of the method for evaluation of the detection threshold can be found in (Petrov et al. 2011b). Then, theoretical path delays were computed according to the state-of-the art parametric model as well as their partial derivatives, and small differences between group delays and theoretical path delay were used for estimation of corrections to a parametric model that describe the observations with least squares (LSQ). Coordinates of target source, positions of all stations, except the reference one, parameters of the spline that describes corrections to the a priori path delay in the neutral atmosphere in the zenith direction for all stations, and parameters of another spline that describes the clock function with the time span 1 hour were solved for in separate least square solutions that used group delays at X and S bands individually.
Observations that deviated by more than in the preliminary solution were identified and temporarily eliminated, and additive corrections to a priori weights were determined. The most common reason for an observation to be marked as an outlier is a misidentification of the main maximum of the two-dimensional Fourier-transform of the cross-spectrum. Then the fringe fitting procedure was repeated for observations marked as outliers. But this time the group delay and phase delay rate were evaluated for these observations in a narrow window of 4 ns wide centered around the predicted value of group delay computed using parameters of the VLBI model adjusted in the preliminary LSQ solution. New estimates of group delays for points with the probabilities of false detection less than 0.1, which corresponds to the SNR for the narrow fringe search window, were used in the next step of the interactive analysis procedure. The observations marked as outliers in the preliminary solution and detected in the narrow window at the second round of the fringe fitting were tried again. If the new estimate of the residual was within 3.5 formal uncertainties, the observation was restored and used in further analysis. Parameter estimation, elimination of remaining outliers and adjustments of additive weight corrections were then repeated. In total, 16629 matching pairs of X and S band group delays out of 22750 scheduled were used in the solution. Each source was detected at both bands and had the number of dual-band pairs in the range of 19–321.
The result of the interactive solution provided the clean dataset of ionosphere-free linear combinations of X and S-band group delays with updated weights. The dataset that was used for the final parameter estimation utilized all dual-band S/X data acquired under absolute astrometry and space geodesy programs from April 1980 through December 2010, including the data from the GC030 experiment, in total 8 million observations. Thus, the GC030 experiment was analyzed exactly the same way as over 5000 other VLBI experiments, using the same analysis strategy that was used for processing prior observations for ICRF, VCS, VGaPS, LCS, and K/Q survey (Lanyi et al. 2010) catalogues. The estimated parameters are right ascensions and declination of all sources, coordinates and velocities of all stations, coefficients of B-spline expansion of non-linear motion for 17 stations, coefficients of harmonic site position variations of 48 stations at 4 frequencies: annual, semi-annual, diurnal, semi-diurnal, and axis offsets for 67 stations. Estimated variables also included Earth orientation parameters for each observing session, parameters of clock function and residual atmosphere path delays in the zenith direction modeled with the linear B-spline with interval 60 and 20 minutes respectively. All parameters were adjusted in a single LSQ run.
The system of LSQ equations has an incomplete rank and defines a family of solutions. In order to pick a specific element from this family, I applied the no-net rotation constraints on the positions of 212 sources marked as “defining” in the ICRF catalogue (Ma et al. 1998) that required the positions of these sources in the new catalogue to have no rotation with respect to their positions in the ICRF catalogue. No-net rotation and no-net-translation constraints on site positions and linear velocities were also applied. The specific choice of identifying constraints was made to preserve the continuity of the new catalogue with other VLBI solutions made during last 15 years.
The global solution sets the orientation of the array with respect to an ensemble of extragalactic remote radio sources. The orientation is defined by the continuous series of Earth orientation parameters and parameters of the empirical model of site position variations over 30 years evaluated together with source coordinates. Common sources observed in the GC030 experiment as amplitude calibrators provided a connection between the new catalogue and the old catalogue of compact sources.
As a valuable by-product of GC030 observations, positions of dss63 station were determined (see Table 1). To my knowledge, this is the only S/X experiment with participation of this station that can be found in publicly accessible databases. Velocity of dss63 was constrained to be the same as velocity of dss65 station that is located in 1440 meters from dss63.
Radio images of observed sources in both S and X bands were presented in a graphical form in Bourda et al. (2011). In order to provide a measure of source strengths at long and short baselines for predicting the SNR in future observations, I made my own simplified amplitude analysis and derived the median correlated flux densities at baseline projection lengths shorter than 900 km and longer than 5000 km. This procedure is described in details in Petrov et al. (2011c). It is outlined here briefly. First, I computed the a priori system equivalent flux density (SEFD) using system temperatures and gain curves for each antenna. Fringe amplitudes for every observation used in astrometric analysis, except those marked as outliers, were converted to flux densities by multiplying them by the square root of the product of the a priori SEFDs of both stations of a baseline. Then I adjusted multiplicative gain corrections from logarithms of ratios of observed correlated flux densities of 10 amplitude calibrators to their values predicted on the basis of publicly available brightness distributions444Available at http://astrogeo.org/vlbi_images using least squares. I applied these corrections to estimates of correlated flux densities of observed sources and computed the median value at two ranges of baseline projections. Comparison of estimates of median correlated flux densities derived by this method with estimates of correlated flux densities generated using images produced by a rigorous self-calibration procedure for three 24 hour survey experiments VCS5 (Kovalev et al. 2007) showed that the accuracy of median correlated flux densities estimated using the simplified method is at a level of 15%. These estimates of correlated flux densities are complementary to source image statistics shown in Bourda et al. (2011), for instance, to their total flux densities integrated from X- and S-band images.
| Position (m) | Velocity (mm/yr) | |
|---|---|---|
| X | ||
| Y | ||
| Z |
4. The catalogue
| IAU name | Source coordinates | Position errors | S-band | X-band | Flag | |||||||
|---|---|---|---|---|---|---|---|---|---|---|---|---|
| B1950 | J2000 | Corr | #pnt | short | unres | short | unres | |||||
| hr mn sec | ∘ ′ ′′ | mas | mas | Jy | Jy | Jy | Jy | |||||
| 0003123 | J00061235 | 00 06 23.056086 | 12 35 53.09833 | 0.26 | 0.42 | 198 | 0.137 | 0.071 | 0.138 | 0.083 | X | |
| 0049003 | J00520035 | 00 52 05.568998 | 00 35 38.14614 | 0.89 | 3.16 | 32 | 0.031 | 0.024 | 0.062 | 0.061 | ||
| 0107025 | J01100219 | 01 10 13.160493 | 02 19 52.84055 | 0.65 | 2.26 | 98 | 0.074 | 0.069 | 0.061 | 0.058 | ||
| 0109200 | J01122020 | 01 12 10.190819 | 20 20 21.76438 | 0.31 | 0.67 | 170 | 0.095 | 0.070 | 0.125 | 0.087 | ||
| 0130083 | J01320804 | 01 32 41.126050 | 08 04 04.83517 | 1.38 | 1.57 | 64 | 0.104 | 0.083 | 0.065 | 0.058 | ||
| 0145210 | J01472115 | 01 47 53.822855 | 21 15 39.72637 | 0.40 | 1.15 | 127 | 0.295 | 0.210 | 0.107 | 0.053 | ||
| 0150015 | J01520147 | 01 52 39.610907 | 01 47 17.38264 | 0.86 | 2.75 | 70 | 0.046 | 0.047 | 0.048 | 0.042 | ||
| 0210515 | J02145144 | 02 14 17.934429 | 51 44 51.94772 | 0.39 | 0.36 | 401 | 0.092 | 0.076 | 0.059 | 0.046 | X | |
| 0446074 | J04490729 | 04 49 21.170617 | 07 29 10.69568 | 0.63 | 1.31 | 80 | 0.043 | 0.036 | 0.092 | 0.074 | ||
| 0502041 | J05050415 | 05 05 34.769151 | 04 15 54.57316 | 2.02 | 5.40 | 41 | 0.036 | 0.051 | 0.032 | 0.036 | ||
| 0519074 | J05220725 | 05 22 23.196279 | 07 25 13.47580 | 4.96 | 7.17 | 19 | 0.043 | 0.043 | 0.053 | 0.038 | ||
| 0651428 | J06544247 | 06 54 43.525947 | 42 47 58.73588 | 0.48 | 0.64 | 168 | 0.098 | 0.101 | 0.075 | 0.077 | ||
I have determined positions of 105 sources observed in GC030 experiment. They are listed in Table 2. Although positions of all 5336 astrometric sources were adjusted in the LSQ solution that included the OBRS–1 sources, only coordinates of the 105 target sources observed during GC030 experiment are presented in the table. The 1st and 2nd columns give the IVS source name (B1950 notation) and IAU name (J2000 notation). The 3rd and 4th columns give source coordinates at the equinox on the J2000.0 epoch. Columns 5 and 6 give formal source position uncertainties in right ascension and declination in mas (without factor), and column 7 gives the correlation coefficient between the errors in right ascension and declination. The number of group delays used for position determination is listed in column 8. Columns 9 and 10 provide the median value of the correlated flux density in Jansky at S-band at baseline projection lengths shorter than 900 km and at baseline projection lengths longer than 5000 km. The latter estimate serves as a measure of the correlated flux density of the unresolved component of a source. Columns 11 and 12 provide the median of the correlated flux density at X-band at baselines shorter than 900 km and longer than 5000 km. The last column contains a cross-reference flag: V if a sources was observed in VIPS campaign, X if it was observed at X/S bands in other absolute astrometry campaign, and VX if it was observed in both.
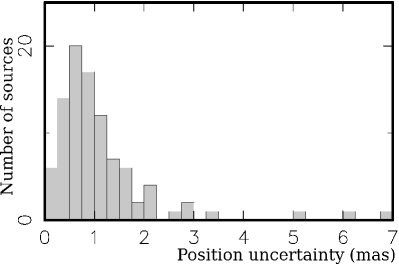
Uncertainties in sources position that were observed only in the GC030 experiment range from 0.3 mas (1345+735 (catalog )) to 7.2 mas (0519-074 (catalog )) with the median 1.1 mas. The distribution of the semi-major axes of position error ellipses is presented in Figure 1.
5. Error analysis
Among 105 target sources, 26 objects were observed in VIPS C-band (5 GHz) program and 9 objects were observed in dual-frequency S/X VLBA experiments under absolute astrometry programs. For comparison purposes, I made a trial solution that used exactly the same setup as the main solution, but excluded 9 common objects from the GC030 experiment. The results of the comparison presented in Table 3 shows that, except for declination of 2043+749 (catalog ), the differences are within formal uncertainties of the OBRS–1 catalogue. The formal uncertainties of source positions are computed from standard deviations of group delay estimates using the law of error propagation. Since the selection of intermediate frequencies was unfavorable for a precise determination of group delays and the sources were relatively weak, the thermal noise dominates the error budget.
Realistic uncertainties of parameter adjustments can be evaluated only by exploiting some redundancy in the data or by using additional information. We do not have enough redundancy to evaluate rigorously the level of systematic errors in the GC030 campaign. Comparison of positions of 9 common sources indicates that systematic errors, if exist, do not exceed 1 mas. Although only 10 atmosphere calibrators were included in the schedule, 3–5 times less than in dedicated absolute astrometry observing experiments, they were observed rather intensively. We can indirectly estimate the level of systematic errors caused by the sparseness of the distribution of calibrator sources by comparing the source distribution in experiment GC030 with that in the prior VLBA Calibrator Survey program VCS1 (Beasley et al. 2002). The azimuthal-elevation distribution of sources observed in that campaign for a central VLBA antenna (Figure 3b in Beasley et al. (2002)) was concentrated in a narrow band at the sky for 95% of the sources, and very few atmospheric calibrators outside that band were used. The reliability of estimation of atmosphere path delays in zenith direction was significantly compromised, and as a result, the formal uncertainties from the LSQ solution had to be inflated by adding in quadrature the error floor of 0.4 mas.
The VCS1 campaign can be considered as an extreme case of the effect of the non-uniform distribution of observed sources. Both calibrator sources and targets in GC030 were distributed more uniformly than in the VCS1 campaign. Analysis of estimates of residual atmosphere path delays does not show abnormalities. I surmise tentatively that systematic errors of the OBRS–1 catalogue are probably do not exceed 0.4 mas, which is insignificant with respect to its random errors. I presented formal uncertainties from the LSQ solution “as is”, leaving investigation of systematic errors in depth in the future when more observations in this mode will be collected.
| Source name | Position difference | XS source position | X/S position uncertainty | ||||||
|---|---|---|---|---|---|---|---|---|---|
| B1950-name | J2000-name | Right ascension | Declination | Corr | # Obs | ||||
| mas | mas | hr mn sec | ∘ ′ ′′ | mas | mas | ||||
| 0003123 | J00061235 | 00 06 23.05607 | +12 35 53.0983 | 0.3 | 0.5 | 0.124 | 62 | ||
| 0210515 | J02145144 | 02 14 17.93433 | +51 44 51.9475 | 0.8 | 0.5 | 0.296 | 99 | ||
| 0708742 | J07147408 | 07 14 36.12502 | +74 08 10.1440 | 0.6 | 0.2 | 0.085 | 88 | ||
| 1721343 | J17233417 | 17 23 20.79594 | +34 17 57.9652 | 0.2 | 0.4 | -0.432 | 76 | ||
| 1759756 | J17577539 | 17 57 46.35883 | +75 39 16.1800 | 1.3 | 0.4 | 0.375 | 276 | ||
| 2043749 | J20427508 | 20 42 37.30776 | +75 08 02.4415 | 1.4 | 1.1 | 0.211 | 45 | ||
| 2111801 | J21098021 | 21 09 19.16511 | +80 21 11.2264 | 9.8 | 2.2 | -0.032 | 13 | ||
| 2316238 | J23182404 | 23 18 33.96785 | +24 04 39.7496 | 0.3 | 0.4 | 0.050 | 72 | ||
| 2322396 | J23253957 | 23 25 17.86983 | +39 57 36.5084 | 0.2 | 0.2 | -0.274 | 118 | ||
6. Discussion
In the course of development of radio astrometry for last 40 years, we learned that in order to derive precise source positions using the method of absolute astrometry, a VLBI experiment should 1) have intermediate frequencies spread as wide as possible over the band(s); 2) observe every 1–2 hours blocks of 3–5 sources with at least one source at elevations above the horizon and one source at elevations above the horizon; 3) collect enough bits for detection target sources at long baselines.
Unfortunately, the selection of intermediate frequencies in the GC030 experiment did not satisfy the first condition. The choice of intermediary frequencies is not very important for producing source images and observers often record a continuous bandwidth. But this choice is critical for absolute astrometry applications, since precision of group delay is reciprocal to the variance of the frequencies in the band. The choice is especially important for astrometry of weak sources, since unlike to observations of bright sources when systematic errors dominate the error budget, the position accuracy of weak sources is determined by the uncertainties of group delays caused by the thermal noise. The frequency setup spread over 494 MHz used in VLBA geodesy/astrometry RDV program (Petrov et al. 2009b) had the uncertainties of group delay by a factor of 11.1 smaller than in the GC030 experiment at a given signal to noise ratio (SNR). The VLBA hardware allows to spread the IFs over 1000 MHz that brings uncertainties of group delay down even further by a factor of 2 (Petrov & Walker 2011d).
It should be stressed that there is no necessity to limit the spread of intermediate frequencies for image experiments. One of the most extensive dedicated imaging program, the VLBI Image and Polarization Survey (VIPS) (Helmboldt et al. 2007) used 4 IFs spread over 494 MHz in order to improve the coverage and to allow for rotation measure determinations (Taylor et at. 2005). Analysis of both VIPS and RDV observations provided excellent source maps (Helmboldt et al. 2007; Piner et al. 2007; Pushkrarev & Kovalev 2008). Maps from absolute astrometry observations typically have dynamic range 1:100–1:1000 (see Petrov et al. (2008) and references therein). These maps allowed Charlot et al. (2007) to determine source structure indexes and make conclusions about suitability of sources for precise astrometry.
The approach proposed by Bourda et al. (2008) to run 3 observing campaigns for an absolute astrometry program, first for detection, second for producing source maps, third for deriving source positions deviates sharply from the strategy used for last 40 years for determining positions of 6000 sources, which used one campaign per program.
Our analysis of GC030 experiment shows that running 2 separate observing campaigns for imaging and astrometry, which doubles requested observing time, is not the best choice. Spreading the intermediate frequencies over 500 MHz would reduce random errors of position estimates by a factor of 11, i.e. the median position error would be 0.1 mas, without compromising imaging results. With such precise group delays, position accuracy would be limited by systematic errors. More intensive observations of troposphere calibrators for mitigation systematic errors would require approximately 5–8% additional observing time according to Petrov et al. (2011b). That means that the goal of the project could be reached by using 2 runs instead of 3, which requires one half of requested resources.
Including eflsberg in the array is beneficial, because this station improves the baseline sensitivity at X-band by a factor of 4, which is important for detecting weak sources. The benefit of using other European stations and especially a station in South Africa which has almost no mutual visibility with both American and European stations is less obvious. In order to access the impact of other stations on the source position estimates, I made a trial solution that excluded medicina, hartrao, noto, onsala60, and dss63 from GC030. Comparison of position differences showed that they are within formal uncertainties. An average increase of uncertainties of the trial solution using the data from the restricted array was 20% for right ascensions and 30% for declinations. The median increase was 28% and 42% respectively. Removing EVN stations from the array would, of course, degrade the quality of images, but as analysis of other VLBA experiment showed, for instance K/Q survey (Lanyi et al. 2010), not to the level that would undermine their usability for the goals of this specific project.
These are important lessons that we learned from analysis of these observations.
7. Summary
Analysis of the first dual-band S/X VLBA experiment of the campaign for observing optically bright extragalactic radio sources allowed us to determine positions of 105 target sources. Despite using the frequency setup unfavorable for absolute astrometry, the position uncertainties ranged from 0.3 to 7 mas with the median value of 1.1 mas. The sources were relatively weak: the median correlated flux density at baselines longer than 5000 km ranged from 25 to 190 mJy with the median value around 60 mJy at both bands, which is a factor of 2 weaker than in the VLBA Calibrator surveys. However, recording at 512 Mbps with integration length of 300 s was sufficient to detect 73% of the observations, including those at long baselines.
A position accuracy of 1 mas is sufficient for using these sources as phase calibrators, but not sufficient for drawing meaningful conclusions from comparison of Gaia and VLBI positions. All the sources will have to be re-observed with the wide-band frequency setup in order to reach 0.1 mas level of accuracy.
In 2010–2011, the remaining 293 sources were observed at the VLBA + EVN. These observations will help us to further extend the position catalogue of optically bright radio sources.
References
- Andrei et al. (2009) Andrei, A. H., Souchay, J., Zacharias, N., et al. 2009, A&A, 505, 385
- Beasley et al. (2002) Beasley, A. J., Gordon, D., Peck, A. B., et al. 2002, ApJS, 141, 13.
- Becker et al. (1995) Becker, R. H., White, R. L., & Helfand, D. J. 1995, ApJ, 450, 559
- Bourda et al. (2008) Bourda, G., Charlot, P., & Le Campion, J.-F. 2008, A&A, 490, 403
- Bourda et al. (2010) Bourda G., Charlot, P., Porcas, R. W., Garrington, S. T., 2010, A&A, 520, 113
- Bourda et al. (2011) Bourda, G., Collioud, A., Charlot, P., Porcas, R. W., Garrington, S. T. 2011, A&A, 526, A102
-
Charlot et al. (2007)
Charlot, P., Fey, A. L., Collioud, A., et al. 2007, in Proceedings of the Journées Systèmes de Référence
Spatio-temporels 2007. Observatoire de Paris, 17-19 September 2007,
ed by N. Capitaine, p 8
http://syrte.obspm.fr/journees2007/PDF/s1_02_Charlot.pdf - Cohen & Shaffer (1971) Cohen M. H. & Shaffer D. B., 1971 AJ, 76, 91.
- Condon et al. (1998) Condon, J. J., Cotton, W. D., Greisen, E. W., et al. 1998, AJ, 115, 1693
- Fomalont et al. (2003) Fomalont, E., Petrov, L., McMillan, D. S., et al. 2003, AJ, 126, 2562.
- Helmboldt et al. (2007) Helmboldt, J. F., Taylor, G. B., Tremblay, S., et al. 2007, ApJ, 658, 203
- Kovalev et al. (2007) Kovalev, Y. Y., Petrov, L., Fomalont, E., Gordon, D. 2007, AJ, 133, 1236.
- Kovalev et al. (2008) Kovalev, Y. Y., Lobanov, A. P., Pushkarev, A. B., Zensus, J. A. 2008, A&A, 483, 759
- Lanyi et al. (2010) Lanyi, G. E., Boboltz, D. A., Charlot, P., et al. 2010, AJ, 139, 1695
- Lindegren et al. (2008) Lindegren, L. Babusiaux, C., Bailer-Jones, C., et al. 2008, in Proc. IAU Symposium, 248, 217
- Ma et al. (1998) Ma, C., Arias, E. F., Eubanks, T. M., et al. 1998, AJ, 116, 516
- Matveenko et al. (1965) Matveenko, L. I., Kardashev, N. S., Sholomitskii, G. B. 1965, Izvestia VUZov. Radiofizika, 8, 651 (English transl. Soviet Radiophys., 8, 461)
- Mignard (2003) Mignard, F. 2003, In: IAU XXV, Joint Discussion 16: “The International Celestial Reference System: Maintenance and Future Realization”, ed. R. Gaume, D. McCarthy and J. Souchay, 133
- Petrov et al. (2005) Petrov, L., Kovalev, Y. Y., Fomalont, E., Gordon, D. 2005, AJ, 129, 1163
- Petrov et al. (2006) Petrov, L., Kovalev, Y. Y., Fomalont, E., Gordon, D. 2006, AJ, 131, 1872
- Petrov et al. (2008) Petrov, L., Kovalev, Y. Y., Fomalont, E., Gordon, D. 2008, AJ, 136, 580
- Petrov et al. (2009b) Petrov, L., Gordon, D., Gipson, J., et al. 2009, Jour. Geodesy, 83(9), 859
-
Petrov & Taylor (2011a)
Petrov, L., Taylor, G. B., 2011a, AJ, in press, preprint
http://arxiv.org/abs/1106.2382 - Petrov et al. (2011b) Petrov, L., Kovalev, Y. Y., Fomalont, E., Gordon, D. 2011b, AJ, 142, 35
- Petrov et al. (2011c) Petrov, L., Phillips, C., Bertarini, A., Murphy T., & Sadler E. M. 2011c, MNRAS, 414(3), 2528
- Petrov & Walker (2011d) Petrov, L. & Walker, R. C. 2011d, NRAO VLBI Scientific memo, 33 http://www.vlba.nrao.edu/memos/sci/sci33memo.pdf
- Piner et al. (2007) Piner, B. G, Mahmud, M., Fey, A. L., et al. 2007, AJ, 133(5), 2357
- Porcas (2009) Porcas, R. W. 2009, A&A, 505, L1
-
Pushkrarev & Kovalev (2008)
Pushkarev, A., Kovalev, Y. 2008, in Proc. of the 9th European VLBI
Network Symposium, 86
http://pos.sissa.it/cgi-bin/reader/conf.cgi?confid=72 - Sokolovsky et al. (2011) Sokolovsky, K. V., Kovalev, Y. Y., Pushkarev, A. B., & Lobanov, A. P. 2011, A&A, in press; arXiv:1103.6032
- Taylor et at. (2005) Taylor, G. B., Fassnacht, C. D., Sjouwerman, L. O., et al. 2005, ApJS, 159, 27
- Veron-Cetty & Veron (2010) Veron-Cetty. M. P., Veron, P. 2010, A&A, 518, A10
- Zacharias & Zacharias (2008) Zacharias, M. I., Zacharias, N. 2008, in Proc. IAU Symp. 248, eds. Jin W., Platais I., & Perryman, M. A. C., Cambridge University Press, 332