Spectroscopy of the stellar wind in the Cygnus X-1 system
1 Introduction
1.1 Stellar winds of O stars
Stellar winds of early (O or B) type stars are driven by the radiation pressure of copious absorption lines present in the ultraviolet part of the spectrum on material in the stellar atmosphere [4]. Therefore the winds are very strong; common mass loss rates are 10. Since primaries of high-mass X-ray binaries are O or early B stars [5], which radiate in the UV, this radiation is strong enough to produce such a wind. According to simulations of line-driven winds, perturbations are present and dense and cool inhomogeneities are created in the wind [6]. Larger density, velocity, and temperature variations compress the gas further, creating “clumps”. Current knowledge about stellar winds assumes two disjunct components of O star winds: cool dense clumps and hot tenuous gas. Sako et al. [16] showed that observed spectra of X-ray binaries can only be explained as originating from an environment, where the cool and dense clumps are embedded in the photoionized gas.
1.2 Cygnus X-1
Cygnus X-1 is a binary system where the X-ray source is a black hole [3, 19], and [14], O 9.7 Iab type star HDE 226868 is its companion [18]. Stellar wind accretion plays a major role in the mass transfer process, because Cyg X-1 belongs to the High-Mass X-ray Binaries (HMXB), which is in contrast to Low-mass X-ray Binaries (LMXB), where Roche lobe overflow is more important and accretion disk accretion occurs. There are strong tidal interactions in the system. Moreover, the donor star fills 90 % of its Roche volume [5, 9]. Therefore the wind is not symmetric, but focused towards the black hole [7], such that density and mass loss rate are higher along the binary axis. The fact that such a high percentage of the Roche lobe is filled, however, means that we cannot exclude Roche lobe overflow taking place as well.
1.3 Hard and soft state of Cygnus X-1
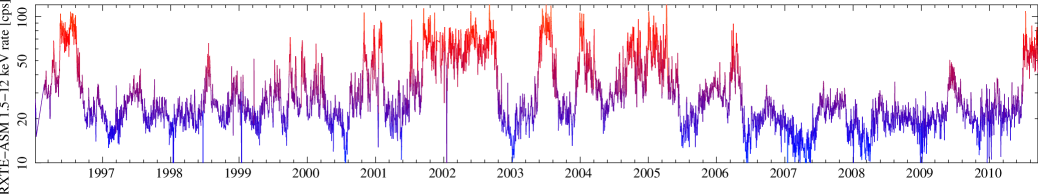
Black hole binaries show two principal types of emission called the hard or soft state, which differ in the shape of the X-ray spectrum, the timing properties and the radio emission. Cyg X-1 spends most of the time in the hard state source with a hard, exponentially cut-off powerlaw spectrum, strong short term variability and steady radio emission [15, 20]. However, transitions between hard and soft states are observed (Fig. 1).
How exactly the wind properties differ between states and what triggers state transitions are questions remaining to be answered. One possibility is that states correspond to different configurations of the accretion flow [17], which cause differences in energy dissipation. Another possibility is that changes of the wind properties themselves trigger state transitions [10]. The mass transfer process in either case (HMXB or LMXB) provides extremely efficient energy release and produces luminosities of in general. For such a luminosity, which is typical for Cyg X-1, the X-ray source produces a considerable feedback on the wind by photoionization of its nearby environment [2], which contributes to the complex wind structure.
2 Observations and data analysis
2.1 Observations and orbital coverage
The spectra used for our analysis were obtained by the High Energy Transmission Grating Spectrometer (HETGS – HETG in combination with ACIS, Advanced CCD Imaging Spectrometer) on board the Chandra observatory. Chandra ACIS observations are performed in two different modes: timed exposure (TE) mode and continuous clocking (CC) mode. In TE mode, the CCD is exposed for some time and then its data are transfered to the frame store, which is read out during the next exposure. The readout time required for the full frame store is 3.2s. In CC mode, the columns are read out continuously, which reduces the readout time to 3ms [8]111Chandra X-ray Center, The Chandra Proposers’ Observatory Guide, 2009, http://cxc.harvard.edu/proposer/POG/. When the source is very bright, more than one photon may reach the same pixel in one frame time (pile-up). These photons are misinterpreted as one single event with higher energy. CC mode is usually used to avoid pile-up.
High-resolution spectra of persistently bright sources like Cyg X-1 provide the unique possibility of probing the structure of the wind directly. However, this structure and therefore also the properties of the wind (density, velocity, ionization state) change with different lines of sight, which correspond to the different orbital phases. Thus, a good coverage of the binary orbit is desirable.
a)
b)
c)
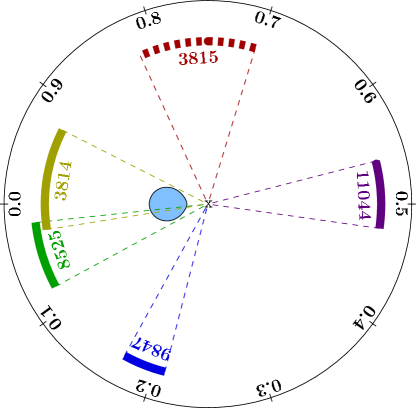
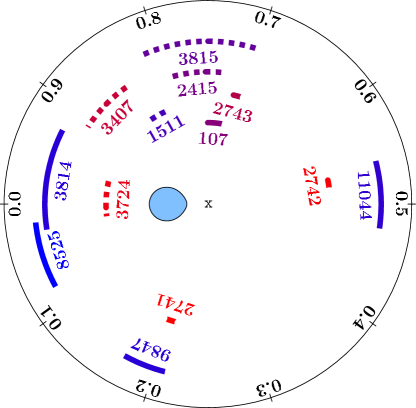
Observations (whether in the hard or soft state) which are currently available cover part of the orbit around phase , between phases and , and around phase , with the latter only obtained in January, 2010 (Fig. 2a). We focus here on the comparison of observations obtained at four distinct phases of , which is defined at the time of superior conjunction of the black hole (ObsID 3814 and ObsID 8525), (ObsID 9847), (ObsID 11044) and (ObsID 3815), see Fig. 2c. The latter was obtained in CC mode, while all others were obtained in TE mode. This difference has no influence on our comparison. While the calibration of CC mode does not allow for an adequate modelling of the whole continuum shape, local absorption lines, which are our primary interest, are not affected.
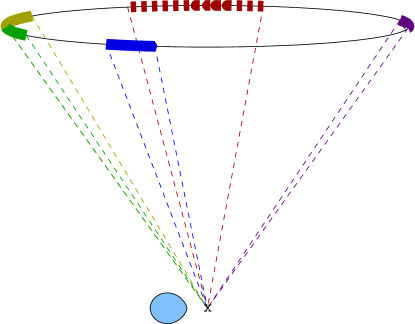
The phase coverage is extremely important, since due to the inclination of 35∘ of the Cyg X-1 orbital plane, it corresponds to looking through the densest part of the wind close to the stellar surface (Fig. 2b). The distribution of X-ray dips with orbital phase peaks around phase [1]. The observation around phase provides a great opportunity to close a gap in defining the general picture of the wind structure.
While all recent Chandra observations caught Cyg X-1 in the hard state at 100 c/s (of Chandra countrate), comparable to the observation at 0 [12], the spectrum was softer and the flux was more than twice as high during the observation at 0.7. The light curves at 0 are modulated by strong and complex absorption dips, but dipping occurs already at 0.7 and has not ceased at 0.2, though the dip events seem to become shorter with distance from 0. The light curve at 0.5 is totally free of dips, yielding 30 ks of remarkably constant flux.
2.2 Absorption dips
According to general assumption, absorption dips, during which the soft X-ray flux decreases sharply, originate from inhomogeneities –“clumps”– present in the wind, where the material is of higher density and lower temperature [4, 16]. According to the softness ratios in the color-color diagram (Fig. 3), different stages of dipping can be classified.
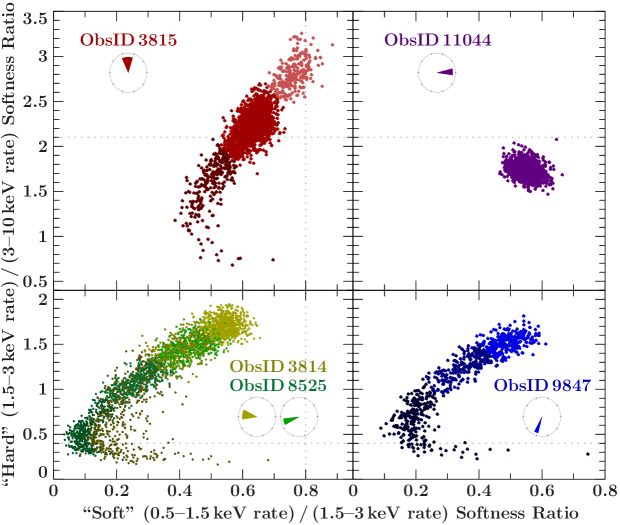
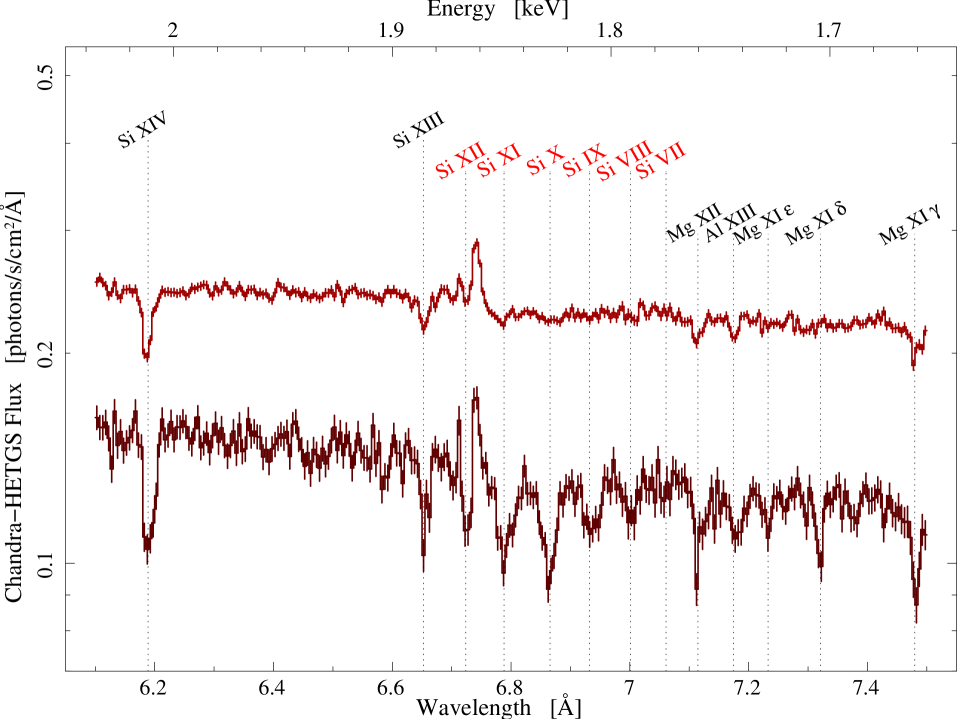
Figure 4 shows the spectrum from the observation at phase 0.7 (ObsID 3815) split into ”dip” and ”non-dip” stages in the wavelength interval of the Si-region between 6 Å and 7.5 Å. While absorption lines of Si xiv and Si xiii are already present in the non-dip spectrum, the dip spectra contain additional strong absorption lines that can be identified with K transitions of lower ionized Si xii–vii. The strength of the low-ionization lines increases with the degree of dipping, indicating that the latter is related to clumps of lower temperature. Moreover, the clumps are of higher density than their surroundings. In 2008 our group organized a multi-satellite observational campaign with XMM-Newton,Chandra (ObsID 8525 and ObsID 9847), Suzaku, RXTE, INTEGRAL and Swift observing Cyg X-1 simultaneously. Dips shortly after phase 0 were so strong, that they were seen by all the instruments involved in the campaign, even RXTE–PCA or INTEGRAL–ISGRI [13].
The light curve from XMM-Newton is shown in Fig. 5 [11]. Where the dips occur in the light curve, the hydrogen column density, , increases strongly.
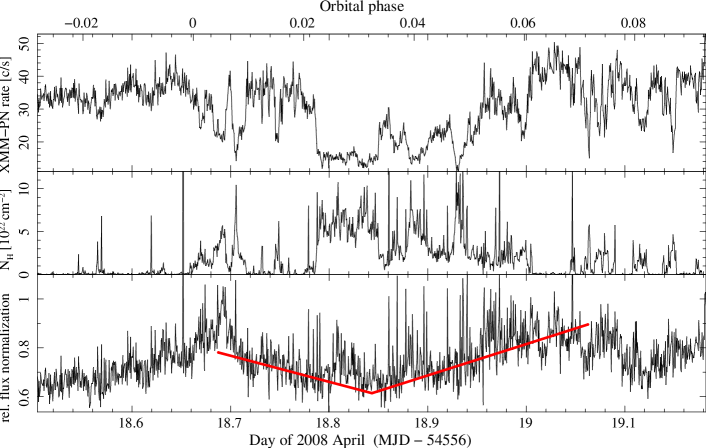
As shown in the third panel, however it is not only the pure absorption which causes the dips. Thomson scattering contributes during these times, causing longer time scale variations, also at hard X-rays. A possible explanation is in the existence of dense and (nearly) neutral clumps (causing the sharp dips) embedded in ionized halos (causing the scattering) [11].
2.3 Spectroscopy
We separate the “non-dip” and the “dip” parts of the observations. The “non-dip” spectrum is extracted from the least absorbed phases at the upper right corner of the color-color diagram (except for ObsID 3815) and the spectroscopic results here refer to these “non-dip” phases. The highly photoionized wind is detected at via numerous strong absorption lines at (Fig. 6).
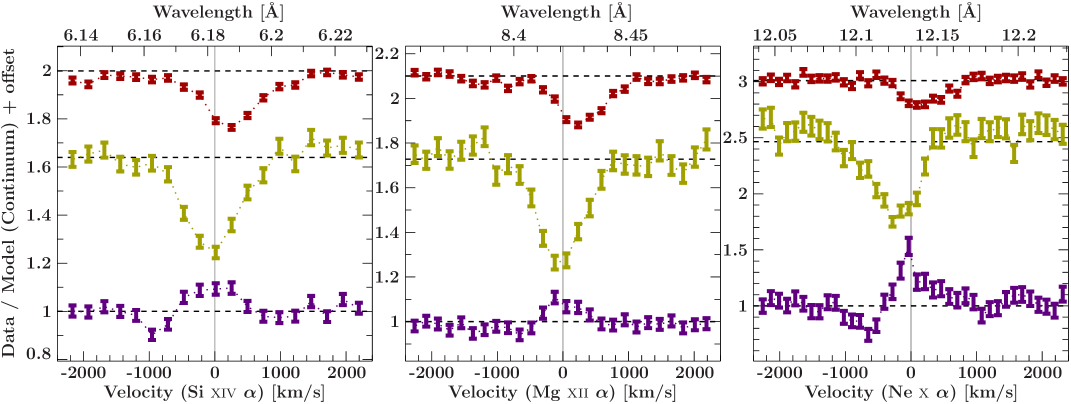
The lack of appreciable Doppler shifts can be explained by the wind flow being orthogonal to the line of sight. In contrast, the recent observation (ObsID 11044) at reveals for the first time for Cyg X-1 clear P Cygni profiles with a strong emission component at a projected velocity , while the weak absorption components occur at a blueshift of 500–1 000 km/s. If we observe the same plasma in both cases, this indicates that the real velocity must be small, i.e., we are probing a dense, low-velocity wind close to the stellar surface. The fact that the absorption line profiles measured at are redshifted by 200–300 km/s indicates that the wind flow is not radial from the star, as a radial wind (i.e., directing away from the star) would always give a blueshifted velocity when projected onto the line of sight at phases .
3 Summary
The new Chandra observation of Cygnus X-1 at orbital phase 0.5 obtained in January 2010 allows us to compare observations at the four distinct orbital phases 0.0, 0.2, 0.5 and 0.75. With such a coverage, the full structure of the wind starts to reveal itself. At phase 0.0 we look through the densest part of the wind, as it is focused towards the black hole. The light curve is modulated by strong absorption dips. The flux decreases strongly during such dips, consistent with being caused by dense and cool clumps of material embedded in the more ionized wind. While absorption lines of Si xiv and Si xiii are already present in the non-dip spectrum, in the dip spectra also K transitions of lower ionized Si appear, whereas the strength of these lines increases with the degree of dipping. An especially interesting result is the totally flat light curve around phase 0.5. While dipping has started around phase 0.7, is the strongest around 0.0 and still present at 0.2, it has vanished at 0.5. We therefore proposed for the next observation between phases 0.25 and 0.4 to investigate the transition between dipping and non-dipping phases. Spectroscopic analysis showed another interesting result. In the spectrum at phase 0.5, clear P-Cygni profiles of Lyman transitions were observed for the first time for Cyg X-1. We observe here strong emission components at a projected velocity in contrast to pure absorption observed at phase 0.0. Detailed modeling of photoionization and wind structure is in progress.
Acknowledgements
The research leading to these results was funded by the European Community’s Seventh Framework Programme (FP7/2007-2013) under grant agreement number ITN 215212 ”Black Hole Universe” and by the Bundesministerium für Wirtschaft und Technologie under grant number DLR 50 OR 0701.
References
- [1] M. Bałucińska-Church et al.: The distribution of X-ray dips with orbital phase in Cygnus X-1., MNRAS, 311, 2000, p.861–868.
- [2] J. M. Blondin: The shadow wind in high-mass X-ray binaries., Astrophys. J., 435, 1994, p.756–766.
- [3] C. T. Bolton: Cygnus X-1-Dimensions of the system., Nature, 240, 1972, p.124.
- [4] J. I. Castor, D. C. Abbott, and R. I. Klein: Radiation-driven winds in Of stars., Astrophys. J., 195, 1975, p.157–174.
- [5] P. S. Conti: Stellar parameters of five early type companions of X-ray sources., Astron. Astrophys., 63, 1978, p.225–235.
- [6] A. Feldmeier, J. Puls, and A. W. A. Pauldrach: A possible origin for X-rays from O stars., Astron. Astrophys., 322, 1997, p.878–895.
- [7] D. B. Friend and J. I. Castor: Radiation-driven winds in X-ray binaries., Astrophys. J., 261, 1982, p.293–300.
- [8] G. P. Garmire et al.: Advanced CCD imaging spectrometer (ACIS) instrument on the Chandra X-ray Observatory., In: “X-Ray and Gamma-Ray Telescopes and Instruments for Astronomy”. (Editors: Truemper, J. E. and Tananbaum, H. D.). Proceedings of the SPIE, 4851, 2003, p.28–44.
- [9] D. R. Gies and C. T. Bolton: The Optical Spectrum of HDE 226868 = Cygnus X-1. III. A Focused Stellar Wind Model for He II lambda 4686 Emission., Astrophys. J., 304, 1986, p.389–393.
- [10] D. R. Gies et al.: Wind Accretion and State Transitions in Cygnus X-1., Astrophys. J., 583, 2003, p.424–436.
- [11] M. Hanke et al.: A Thorough Look at the Photoionized Wind and Absorption Dips in the 226868 X-ray Binary System., In: “The Energetic Cosmos: From Suzaku to Astro-H”. Tokyo: JAXA Special Publication, JAXA-SP-O9-008E, 2010, p.294–295.
- [12] M. Hanke et al.: Chandra X-Ray Spectroscopy of the Focused Wind in the Cygnus X-1 System. I. The Nondip Spectrum in the Low/Hard State., Astrophys. J., 690, 2009, p.330–346.
- [13] M. Hanke et al.: Multi-Satellite Observations of Cygnus X-1., In: “VII Mikroquasar Workshop: Microquasars and Beyond”., PoS (MQW7), 2008.
- [14] A. Herrero et al.: Fundamental parameters of galactic luminous OB stars. II. A spectroscopic analysis of HDE 226868 and the mass of Cygnus X-1., Astron. Astrophys., 297, 1995, p.556–566.
- [15] K. Pottschmidt et al.: Long term variability of Cygnus X-1. I. X-ray spectral-temporal correlations in the hard state., Astron. Astrophys., 407, 2003, p.1039–1058.
- [16] M. Sako et al.: Structure and Dynamics of Stellar Winds in High-Mass X-ray Binaries., In: “High Resolution X-ray Spectroscopy with XMM-Newton and Chandra”. (Editor: G. Branduardi-Raymont). Mullard Space Science Laboratory of University College London, Holmbury St Mary, Dorking, Surrey, UK, 2002.
- [17] D. M. Smith, W. A. Heindl, and J. H. Swank: Two Different Long-Term Behaviors in Black Hole Candidates: Evidence for Two Accretion Flows?, Astrophys. J., 569, 2002, p.362–380.
- [18] N. R. Walborn: The Spectrum of HDE 226868 (CYGNUS X-1)., Astrophys. J., Lett., 179, 1973, p.L123–L124.
- [19] B. L. Webster and P. Murdin: Cygnus X-1-a Spectroscopic Binary with a Heavy Companion ?, Nature, 235, 1972, p.37–38.
- [20] J. Wilms et al.: Long term variability of Cygnus X-1. IV. Spectral evolution 1999-2004., Astron. Astrophys., 447, 2006, p.245–261.