Uniform detection of the pre-main sequence population in the 5 embedded clusters related to the H II region NGC 2174 (Sh2-252)
Abstract
We investigate 5 embedded clusters (ECs) and the extended stellar group itself of the prominent H II region NGC 2174 (Sh2-252), which presents scarce and heterogeneous information, coming from the optical and infrared. Considering the discrepant values of distance and age, the clusters and the H II region appear to be physically unrelated. The analysis is based on field-star decontaminated 2MASS photometry, which allows sampling the pre-main sequence (PMS). We find that Sh2-252A, C, E, NGC 2175s, and Teu 136 are small ECs (radius within pc) characterised by a similar age ( Myr), reddening (), distance from the Sun ( kpc), and low mass (). This age is consistent with the H II region, the presence of O and B stars still in the MS, and the dominance ( in number) of PMS stars in colour-magnitude diagrams (CMDs). NGC 2175 is not a star cluster, but an extended stellar group that encompasses the ECs Sh2-252 A and C. It contains of the member stars (essentially PMS) in the area, with the remaining belonging to the 2 ECs. CMDs of the overall star-forming region and the ECs provide kpc for the NGC 2174 complex, consistent with the value estimated for the physically-related association Gem OB1. Our uniform approach shows that NGC 2174 and its related ECs (except, perhaps, for Teu 136) are part of a single star-forming complex. CMD similarities among the ECs and the overall region suggest a coeval (to within Myr) star-forming event extending for several Myr. At least 4 ECs originated in the event, together with the off-cluster star formation that probably gave rise to the scattered stars of NGC 2175.
keywords:
(Galaxy:) open clusters and associations: general; (Galaxy:) open clusters and associations: individual: NGC 2174 (Sh2-252)1 Introduction
A lingering question related to star formation is whether stars in associations and young stellar groups originate in clusters that dissolve shortly (e.g. Bonatto & Bica 2010b and references therein), or are directly formed throughout the parent molecular cloud. At the bottom of this issue lies the scenario in which star formation is scale-free and hierarchical, with high velocity turbulent gas forming large-scale structures and small clumps being formed by low-velocity compression (Elmegreen 2008). In this context, young stellar groupings would be hierarchically clustered, with the great star complexes at the largest scales and the OB associations and subgroups, clusters and cluster sub-clumps at the smallest (e.g. Efremov 1995).
Hierarchical patterns in extended structures have been detected in the Magellanic Clouds (MCs) and other nearby galaxies (e.g. Bonatto & Bica 2010a, and references therein). At the few parsec scale, Hubble Space Telescope (HST) and VLT-ISAAC photometry of pre-main sequence (PMS) stars in the SMC star-forming region NGC 346/N 66 suggest hierarchical star formation, probably originated from more than one event (Hennekemper et al. 2008; Gouliermis et al. 2008; Sabbi et al. 2007). These works show that part of the PMS stars are found in sub-clusters (some located in the central region of the association and others at the border), with the remaining stars scattered around the association, a scenario directly related to the single or sequential star formation issue.
Recently, our group studied the stellar content of the Sh2-132 H II region, a star-forming complex hosting at least 4 embedded clusters (ECs) and presenting evidence of triggered star formation and hierarchical structuring (Saurin, Bica & Bonatto 2010). However, given its rather large distance ( kpc) and the 2MASS111The Two Micron All Sky Survey, All Sky data release (Skrutskie et al. 2006). photometric depth, we could only sample a fraction of the PMS population. Thus, the present paper focuses on the nearby H II region NGC 2174 (Sh2-252) and related ECs. This complex is located in the Orion constellation and appears to be physically related to the Gem OB1 association ( kpc, Dunham et al. 2010), together with several other Sharpless H II regions and the supernova remnant IC 443 (see Dunham et al. 2010 for a discussion of the objects in the area). Star cluster studies in this region are rather scarce and not uniform, presenting very different values of distance and age, to the point that no physical relation among the clusters and the complex appears to exist (Sect. 2). Thus, our main goal is to investigate the relation of the complex and star clusters. To do so, we must go deep into the PMS, and work both with MS and PMS isochrones to characterise such clusters in detail, and derive accurate CMD fundamental and structural parameters.
| Name | Size | Other designations | Related objects | References | ||||
| (°) | (°) | (hms) | () | () | ||||
| (1) | (2) | (3) | (4) | (5) | (6) | (7) | (8) | (9) |
| Embedded clusters | ||||||||
| Sh2-252A | 189.76 | 0.33 | 06:08:32 | +20:39:24 | in NGC 2175, Sh2-252, Gem OB1 | 03,02 | ||
| Sh2-252C | 189.85 | 0.50 | 06:09:22 | +20:39:33 | KKC 16 | in NGC 2175, Gem OB1,rel IRAS 06063+2040 | 03,02,04 | |
| Sh2-252E | 190.05 | 0.53 | 06:09:53 | +20:30:16 | NGC 2174, CSSS 16, KKC 17 | in Gem OB1,rel IRAS 06068+2030 | 01,03,04 | |
| NGC 2175s† | 190.07 | 0.79 | 06:10:52 | +20:36:45 | OCl-475.1, Pismis 27 | in Sh2-252 | 05,06 | |
| Teutsch 136 | 190.14 | 1.05 | 06:11:58 | +20:40:28 | Koposov 82 | 07,08 | ||
| Possible young open cluster or stellar group | ||||||||
| NGC 2175 | 189.94 | 0.46 | 06:09:22 | +20:33:44 | Collinder 84, OCl-476 | in Sh2-252, in Gem OB1 | 05 | |
-
(†): ‘s’ refers to small; Col. 1: Adopted name; Col. 6: Optical diameter; References in Col. 9: 01: Carpenter et al. (1993); 02: these cluster were included in the Embedded Cluster Catalogue by Bica, Dutra & Barbuy (2003); 03: a cluster image is provided in the 2MASS gallery at http://www.ipac.caltech.edu/2mass/gallery; 04: Kumar, Keto & Clerkin (2006); 05: Pismis (1970); 06: listed in DAML02; 07: Kronberger et al. (2006); 08: Koposov, Glushkova & Zolotukhin (2008).
This paper is organised as follows. In Sect. 2 we recall literature data on the targets. In Sect. 3 we build the field-star decontaminated CMDs. In Sect. 4 we derive structural parameters. In Sect. 5 we estimate fundamental parameters for NGC 2174, NGC 2175, and the individual ECs. In Sect. 6 we estimate cluster mass. Concluding remarks are given in Sect. 7.
2 Previous data on NGC 2174 and related objects
The prominent H II region Sh2-252 was originally catalogued by Sharpless (1959), who related it to an emission nebula (NGC 2174) and a loose stellar distribution (NGC 2175). Currently, NGC 2174 refers to the whole H II region, while NGC 2175 refers to a possible young open cluster (OC) or a stellar group of scattered stars in the nebula. We will thus refer to NGC 2174 (Sh2-252) for the H II region, and NGC 2175 for the possible stellar group.
Different designations and parameters for star clusters and candidates in the direction of NGC 2174 are available in the literature. For instance, Pismis (1970) and Dias et al. (2002, hereafter DAML02 - www.astro.iag.usp.br/wilton) list an OC, NGC 2175, within the H II region NGC 2174. Pismis (1970) finds a small cluster in the area, designated as NGC 2175s, where ‘s’ refers to small. DAML02 refers to NGC 2175s as Pismis 27. Pismis (1970) inferred that NGC 2175s and NGC 2175 have different reddening values ( and 0.25, respectively), and are located at different distances ( and 1.95 kpc, respectively). Star counts also suggest that the distribution of stars in NGC 2175 corresponds to a spherical shell. Pismis (1970) provides the fundamental parameters222Adopted by WEBDA - www.univie.ac.at/webda for the possible OC NGC 2175: kpc, , and age Myr. In DAML02 they are kpc, , and age Myr.
For NGC 2175s, Koposov, Glushkova & Zolotukhin (2008) derived kpc, , and Myr, while Teutsch 136 is cited as a new infrared cluster, but without parameter determination. Kumar, Keto & Clerkin (2006) derived kpc, , number and mass of member stars and , and effective radius for Sh2-252C; for Sh2-252E they found kpc, , , , and . The remaining objects in the area (Table 1) have no parameters yet determined.
Discrepant values for the distance to the H II region have also been provided by kinematical methods. For instance, based on UBV photometry and spectroscopy, Georgelin, Georgelin & Roux (1973) derived a kinematical distance of kpc. On the other hand, the CO radial velocities of Blitz, Fich & Stark (1982) implied the distance kpc. More recently, Reid et al. (2009) used trigonometric parallaxes to derive kpc and a (revised) kinematical distance of kpc. Such a difference in the kinematical distance may be accounted for by the nearly anti-Galactic direction of Sh2-252.
| Cluster | Age | |||||||
| (hms) | () | (°) | (°) | (Myr) | (mag) | (kpc) | (kpc) | |
| (1) | (2) | (3) | (4) | (5) | (6) | (7) | (8) | (9) |
| Embedded clusters | ||||||||
| Sh2-252A | 06:08:32.2 | 20:39:18.0 | 189.77 | 0.34 | ||||
| Sh2-252C | 06:09:21.6 | 20:38:37.0 | 189.87 | 0.50 | ||||
| Sh2-252E | 06:09:52.7 | 20:30:15.2 | 190.05 | 0.54 | ||||
| NGC 2175s | 06:10:54.6 | 20:36:49.5 | 190.07 | 0.80 | ||||
| Teutsch 136 | 06:11:58.1 | 20:49:29.5 | 190.14 | 1.05 | ||||
| Possible young open cluster or stellar group | ||||||||
| NGC 2175 | 06:09:22.4 | 20:33:06.5 | 189.95 | 0.46 | ||||
-
Cols. 4 and 5: Galactic coordinates; Col. 8: distance from the Sun; col. 9: distance from the Solar circle.
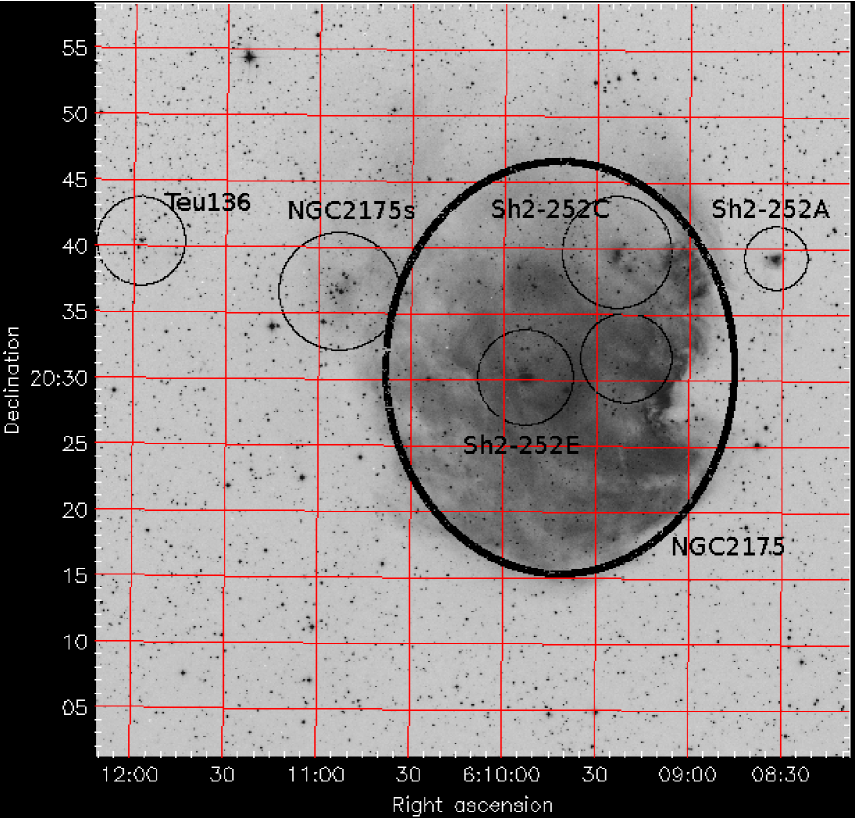
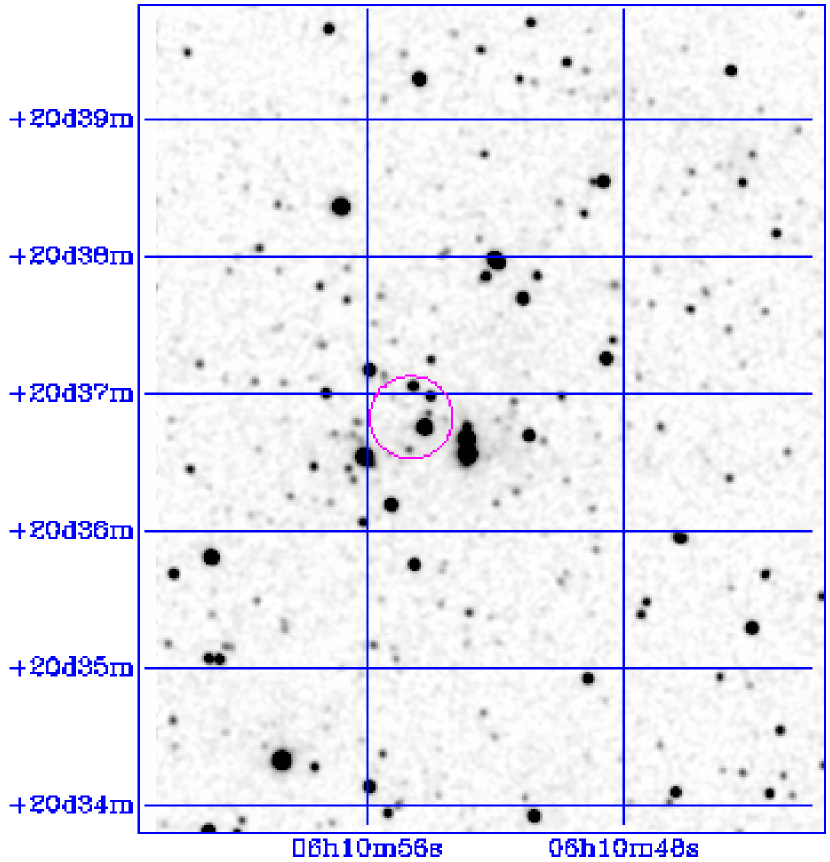
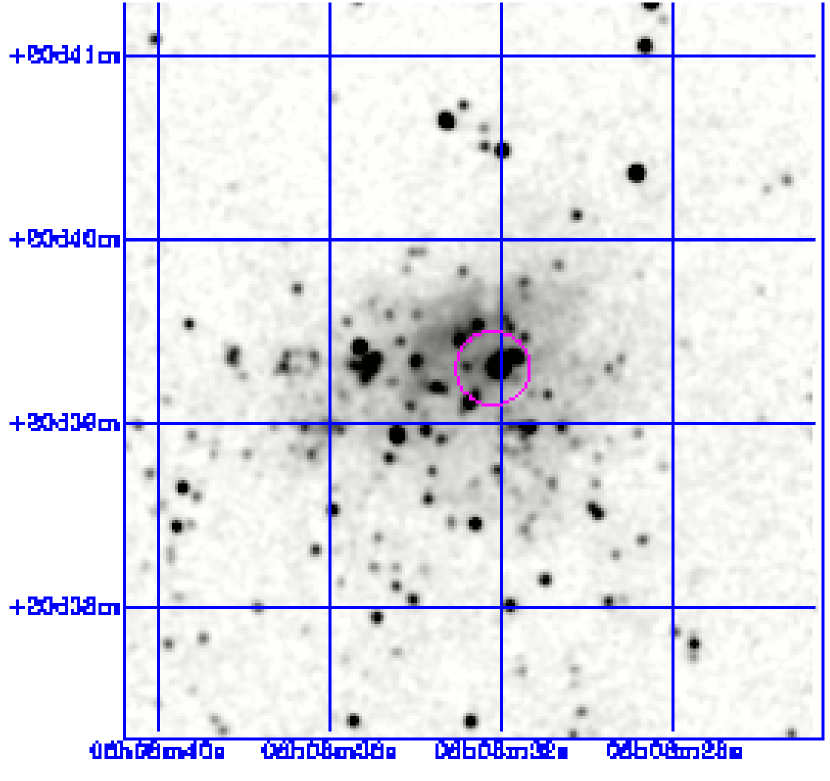
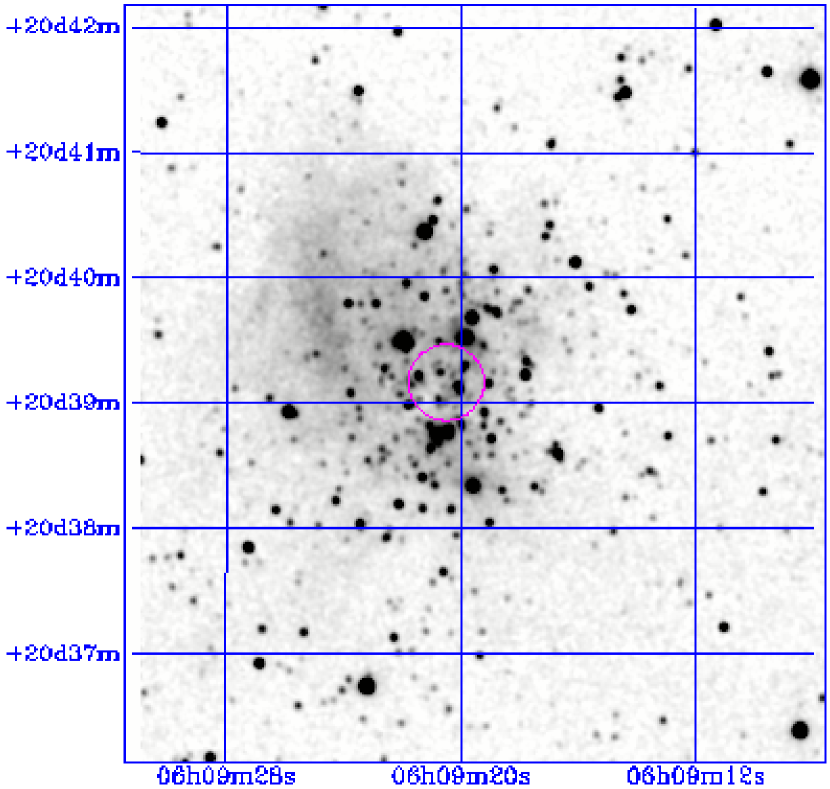
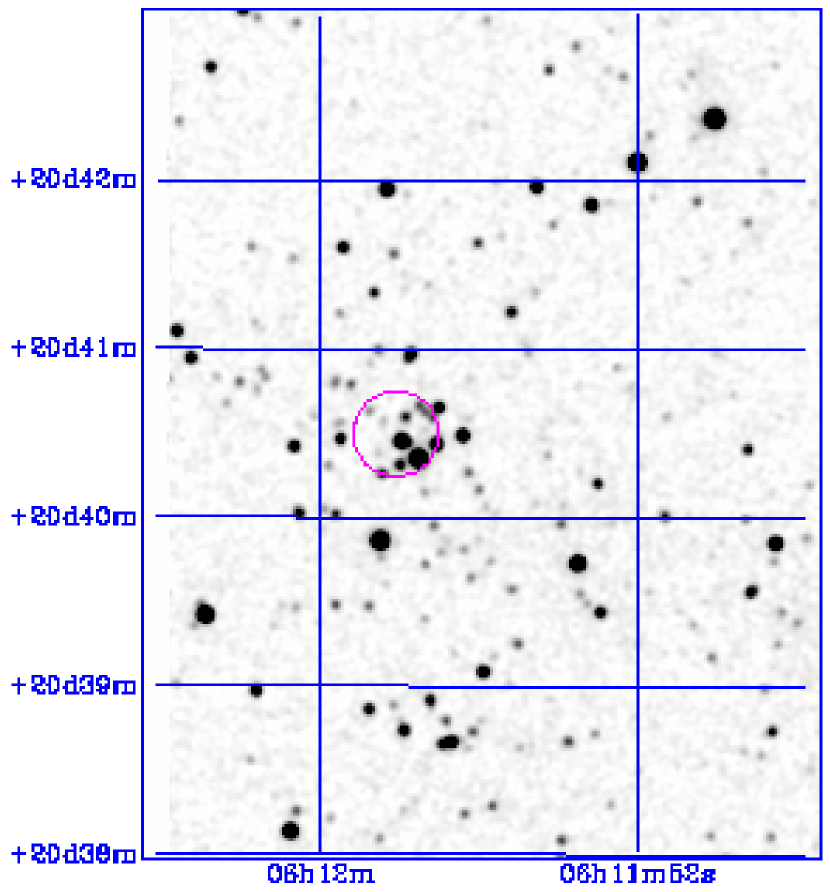
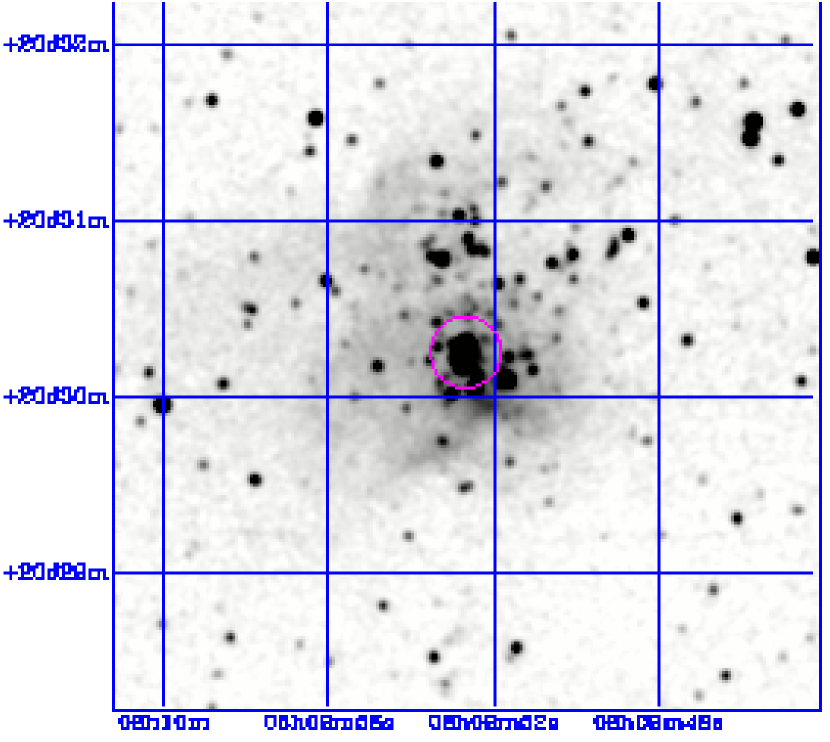
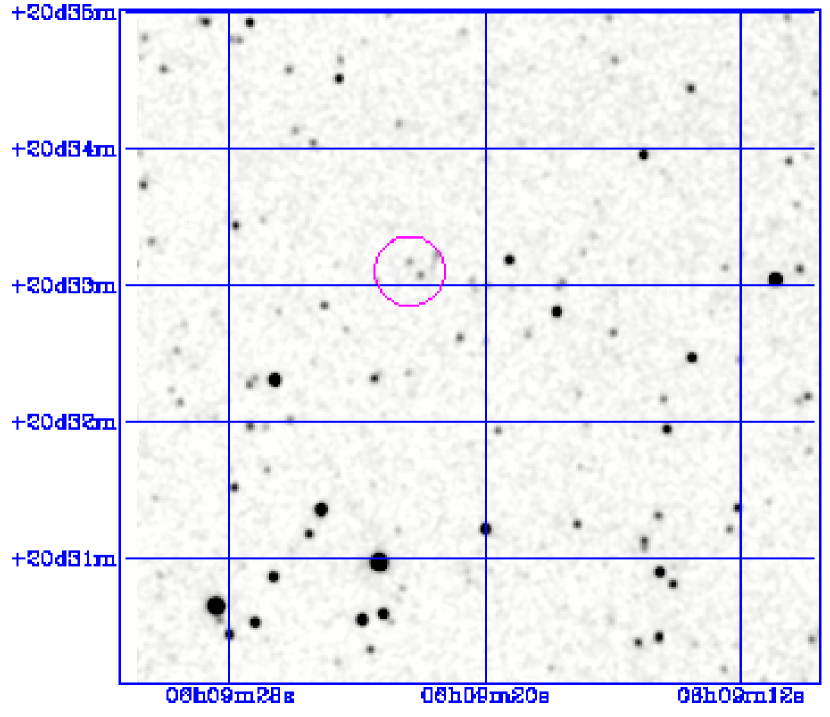
A few relatively bright stars mixed with nebular gas and/or dust emission are seen in the B image (Fig. 1, taken from LEDAS333Leicester Database and Archive Service (LEDAS) DSS/DSS-II service on ALBION; ledas-www.star.le.ac.uk/DSSimage.). Close-ups of the clusters (and the stellar group NGC 2175) are shown in the smaller field 2MASS images. Table 1 provides parameters found in the literature for the clusters and candidates. Cluster designations and coordinates - as derived in the present paper - are given in Table 2. Note the small differences between our coordinates and those given in the literature. This occurs because the central coordinates were re-computed with field-star decontaminated photometry (Sect. 3). According to our approach, the cluster centre corresponds to the coordinates that produce the smoothest stellar radial density profile (RDP) and, at the same time, the highest stellar density in the innermost region (Sect. 4).
3 Decontaminated CMDs
Figure 1 shows that the H II region NGC 2174 (and related objects) still retain part of the parent gas and dust. Thus, we employ the 2MASS , , and photometry to probe the photometric properties with an adequate depth, especially at the faint stellar sequences. Additionally, 2MASS provides the spatial and photometric uniformity required for wide extractions and high star-count statistics. The photometry for each target (Table 1) was extracted from VizieR444http://vizier.u-strasbg.fr/viz-bin/VizieR?-source=II/246, and only stars with errors lower than 0.1 mag are used.
Clusters that contain important fractions of faint stars and/or are projected near the Galactic equator, require field-star decontamination for the proper identification and characterisation of the member stars. Although projected towards the Galactic anti-centre, the present clusters are found near the plane, having CMDs dominated by PMS stars (see below). Thus, we apply the decontamination algorithm first developed in Bonatto & Bica (2007) and improved in Bonatto & Bica (2010b) to minimise confusion with red dwarfs of the Galactic field.
Representative CMDs of the targets are shown in the top panels of Figs. 3 and 4. For NGC 2175, we first consider a region of radius , which is located outside the borders of the neighbouring Sh2-252C and Sh2-252E (Fig. 1) and, thus, is expected to be free from contamination by stars of both objects; a wider region will be considered in Sect. 5. An indication of a young age comes from a comparison with the CMDs extracted from equal-area offset fields (middle panels), which is consistent with the presence of gas and dust (Figs. 1 and 2).
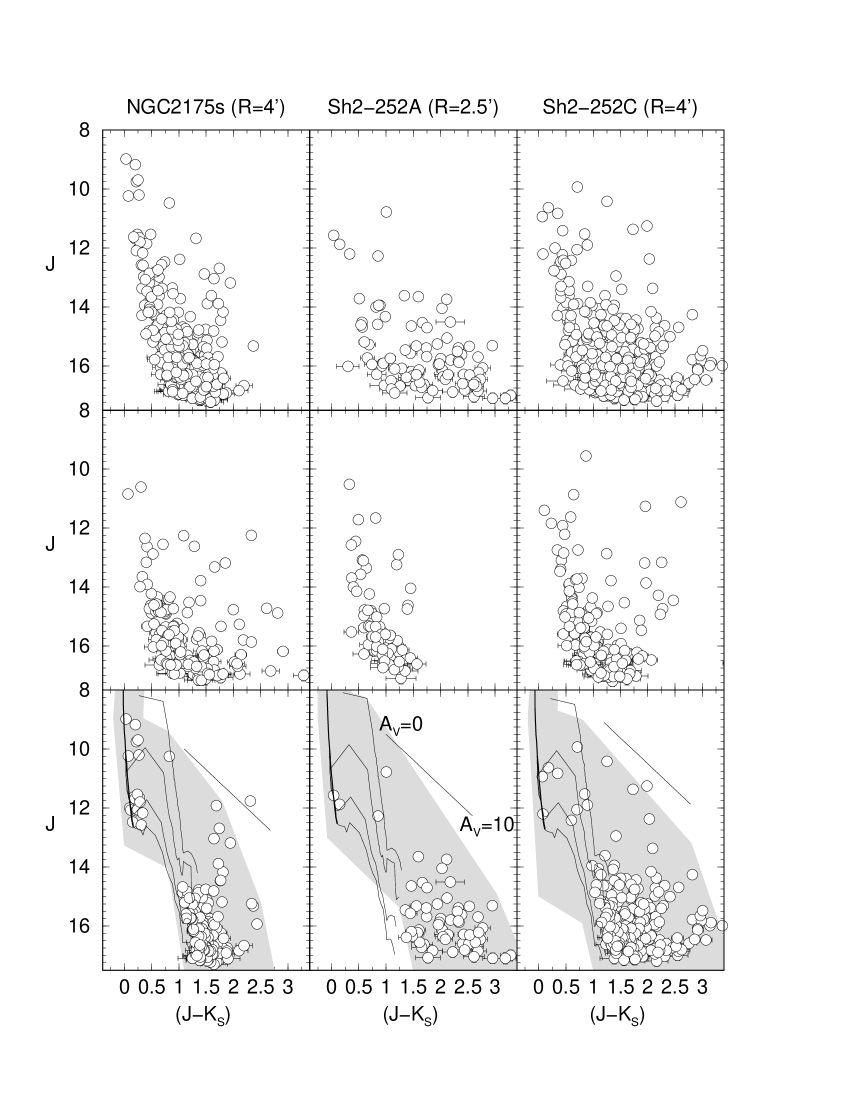
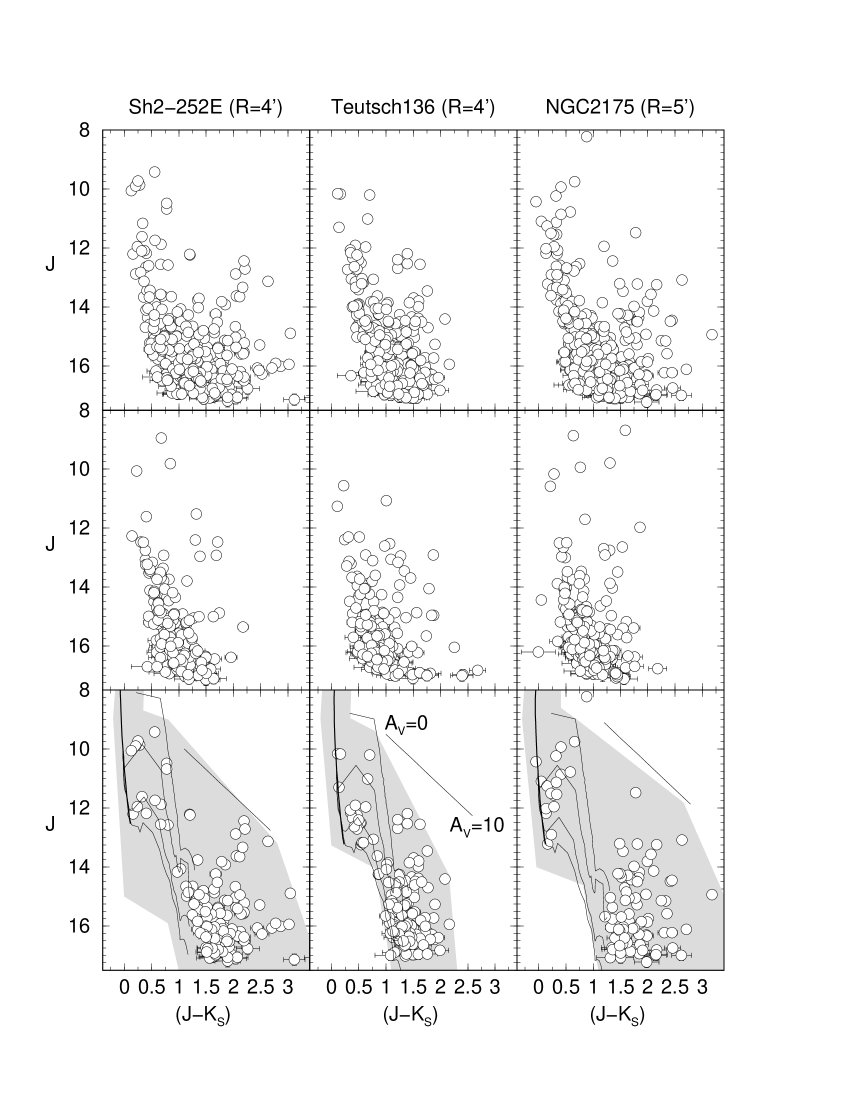
Indeed, the decontaminated CMDs (bottom panels of Figs. 3 and 4) present similar features: they are essentially characterised by stellar sequences of mildly reddened, young clusters, with a nearly-vertical, developing MS and a significant population of PMS stars. Given the time-scales associated with stellar formation ( yr for low-mass stars), very young clusters are expected to contain a population of PMS stars (e.g. Bonatto & Bica 2010b, and references therein). Thus, the assumption that the red and faint stars belong to the PMS is consistent with the Myr of age of the ECs in the complex (Sect. 5). Internal differential reddening is implied by the colour distribution at faint magnitudes (), which is wider than the spread predicted purely by PMS models. A comparison with the reddening vector (for ) shows different degrees of differential reddening, being lower for NGC 2175s and Teu 136, and higher for the remaining cases. If most of the colour spread is due to non-uniform reddening - and not to systematic differences in the stellar content - the upper limit to the differential reddening would be mag.
4 Structural parameters
Probable member stars of each cluster are selected by a colour-magnitude filter, which is wide enough to include MS and PMS stars, the photometric uncertainties, and binaries (Figs. 3 and 4); they are used to build the projected stellar radial density profile (RDP) around the cluster centre. As discussed elsewhere (e.g. Bonatto & Bica 2010b, and references therein), this filtering enhances the RDP contrast relative to the background, especially in crowded fields (e.g. Bonatto & Bica 2007).
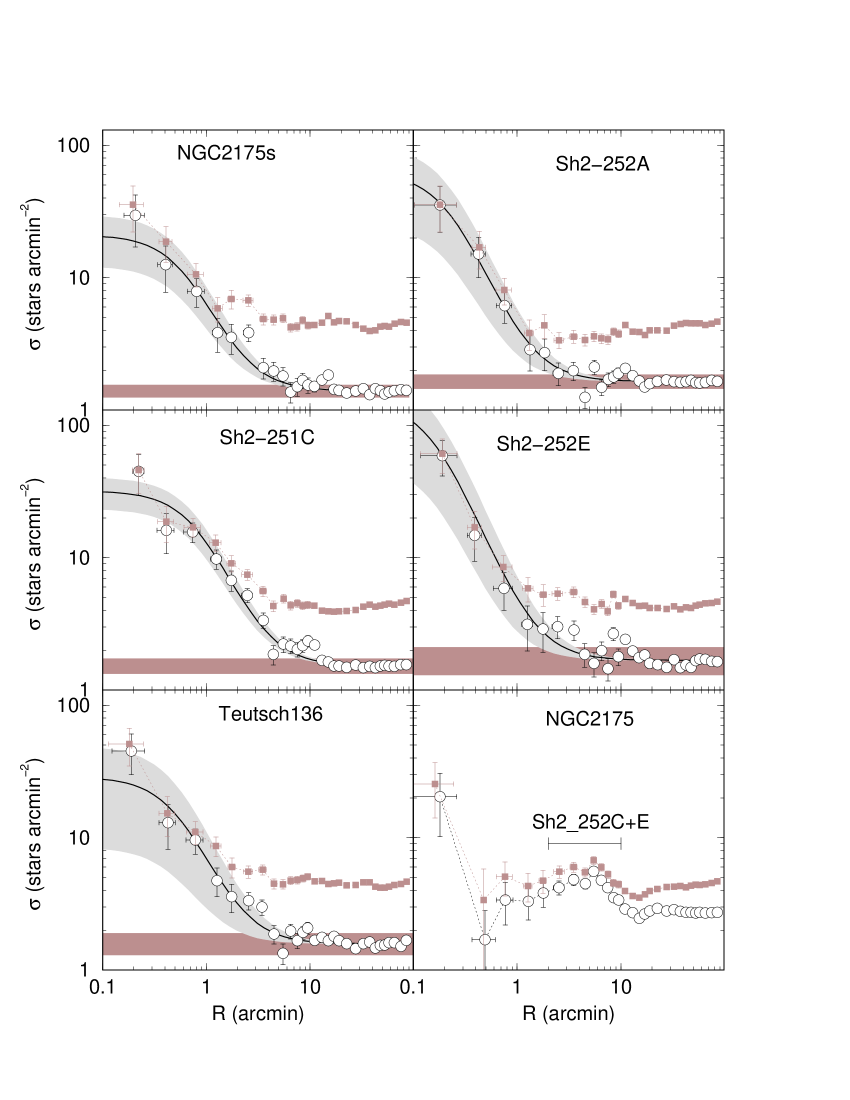
Both sets of RDPs (before and after applying the colour-magnitude filters) are shown in Fig. 5, where the contrast enhancement due to the filtering is clearly seen. Except for NGC 2175, the remaining RDPs are typical of star clusters projected on a stellar fore/background: they follow a power-law (on a log-log scale) with a core near the centre, usually with fluctuations due to neighbouring clusters and/or stellar concentrations. Indeed, the RDPs are well represented by the King-like (King 1962) function , where and are the central and residual stellar densities, and is the core radius.
We also use the RDPs to estimate the cluster radius (), taken as the distance from the cluster centre where the RDP and field fluctuations are statistically indistinguishable (e.g. Bonatto & Bica 2005). In this sense, is an observational truncation radius, whose value depends both on the radial distribution of member stars and the field density. The RDP fits (and uncertainties) are shown in Fig. 5, and the corresponding structural parameters are given in Table 3.
| Cluster | |||||||
|---|---|---|---|---|---|---|---|
| (arcmin) | (arcmin) | (pc) | (pc) | (pc) | |||
| (1) | (2) | (3) | (4) | (5) | (6) | (7) | (8) |
| Pismis 27 | 0.335 | ||||||
| Sh2-252 A | 0.410 | ||||||
| Sh2-252 C | 0.447 | ||||||
| NGC 2174 | 0.405 | ||||||
| Teutsch 136 | 0.511 |
-
Col. 5: arcmin to parsec scale.
The RDPs are essentially defined by the red and faint stars (that we identify as PMS), since they predominate in the CMDs by in number. Thus, coupled to the field-star decontamination, the cluster-like RDPs consistently indicate that these stars belong to the PMS, not being unsubtracted red dwarfs. Otherwise, the RDPs would be characterised by random fluctuations (e.g. Bonatto & Bica 2008b).
5 The distance to NGC 2174 and the nature of NGC 2175
5.1 Distance and age of NGC 2174
Evidence drawn in previous sections suggest that we are dealing with a coeval star formation in NGC 2174 that produced at least 5 ECs physically related to the H II region. In this sense, we can use the CMD morphology of the whole area to derive the average fundamental parameters of NGC 2174. For this purpose, we decontaminate a region of 25′ in radius (Fig. 6), thus including NGC 2175 and the ECs Sh2-252A, C, E, and NGC 2175s.
To derive the fundamental parameters we use the Padova isochrones (Girardi et al. 2002) computed for the 2MASS filters555http://stev.oapd.inaf.it/cgi-bin/cmd. For the PMS we use the isochrones of Siess, Dufour & Forestini (2000). We restrict the analysis to solar metallicity isochrones because the clusters are expected to be young and located not far from the Solar circle (see below), a region essentially occupied by OCs (Friel 1995). Reddening transformations are based on the absorption relations , , , and (Dutra, Santiago & Bica 2002), with , considering the extinction curve of Cardelli, Clayton & Mathis (1989).
Given the poorly-populated MS, the significant population of PMS stars, and the differential reddening, we estimate the fundamental parameters by eye, using the decontaminated CMD morphology (Fig. 6) as constraint. Beginning with zero distance modulus and reddening, the MSPMS isochrones are shifted in colour and magnitude until an acceptable fit for the blue border of the MS and PMS sequences is obtained. The rather poorly-populated and nearly vertical MS accepts any isochrone of age within 1—10 Myr. Considering the differential reddening, a similar age spread results for the PMS stars, which are basically contained within the 0.2 Myr and 10 Myr isochrones. This age range is consistent with the gas and dust-embedded ECs in the area, suggesting an age-spread of Myr in the star formation.
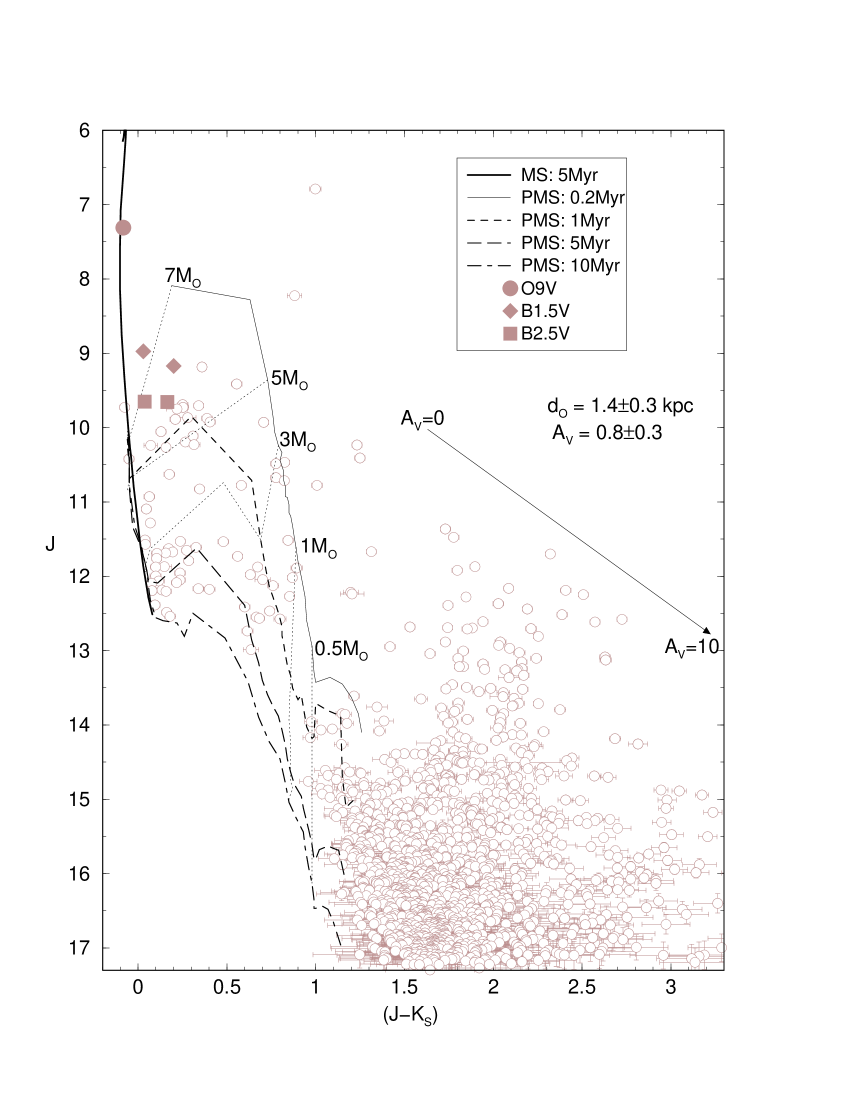
Additionally, the presence of a few O and B stars still in the MS, some of these projected within the ECs Sh2-252E and NGC 2175s, constrain the age of the complex to a few Myr. The spectral types, coordinates (J2000), and location of these ionising stars are: O9 V (=06:09:40, =+20:29:15.4), near the west border of Sh2-252E; B1.5 V (=06:10:53, =+20:36:33.8), near the centre of NGC 2175s; B1.5 V (=06:10:59, =+20:34:19.6), slightly to the south of the latter; and two B2.5 V stars (=06:09:50, =+20:37:05.2, and =06:09:55, =+20:38:31.6), located to the north-east of the centre of NGC 2175. Thus, based on the gas and dust-embedded character of the ECs (Figs. 1 and 2), and the ionising stars, we adopt Myr as the age for the bulk of stars in NGC 2174.
5.2 Nature of NGC 2175
According to the literature (Table 1), NGC 2175 encompasses the ECs Sh2-252C and Sh2-252E (Fig. 1). In fact, the decontamination shows that most of the stars () in the region belong to both ECs, with the remaining following the same CMD morphology as the ECs (Fig. 4), which might suggest an EC. However, the RDP centred on NGC 2175 (Fig. 5) is irregular and shows only a very narrow peak, followed by the excesses produced by the neighbouring ECs. This indicates that NGC 2175 is not a star cluster. Instead, its stellar content may be (i) stars that already have escaped from the neighbouring ECs, (ii) a leftover of a disrupted EC, or (iii) a result of a star formation throughout the molecular cloud not related to a cluster. Perhaps, given the rather young age of the star-formation event, the first two scenarios may not apply, since the stars would have to scatter over a region of pc in radius in less than Myr. This would favour NGC 2175 as an off-cluster star formation in the molecular cloud.
5.3 Fundamental parameters of individual clusters
Since the decontaminated CMD morphologies of the individual clusters (Figs. 3 and 4) resemble that of the wide-field CMD of NGC 2174 (Fig. 6), a similar isochrone solution is expected to apply to all ECs in the complex. Thus, we simply use the NGC 2174 solution as a fundamental-parameter template. The adopted solutions are shown in Figs. 3 and 4, and the fundamental parameters are given in Table 2.
We find only small variations on reddening () and distance ( kpc) among the CMDs (Table 2). Teu 136 may be the exception, in the sense that it is somewhat more reddened () and more distant ( kpc) than the others. Obviously, given the uncertainty in , the clusters can be said to be at the same distance. However, since Teu 136 is located beyond the east border of the H II region (Fig. 1), it may be just a young cluster projected close, but not physically related to the complex. Our reddening value for Sh2-252C is about 10% of that derived by Kumar, Keto & Clerkin (2006), while our distance from the Sun is about 30% of theirs. On the other hand, both works agree with respect to the distance of Sh2-252E.
Compared to the remaining cases (Figs. 3 and 4), the decontaminated CMD of the dust-shrouded EC NGC 2175s presents the best constraints, in terms of stellar sequences (it contains at least 2 B1.5 V stars), for finding an independent isochrone solution. Under the same strategy applied for NGC 2174, we find ( or ), the observed and absolute distance moduli and , respectively, and kpc. These values are consistent with those of the wide-field NGC 2174, and with the kpc obtained by Koposov, Glushkova & Zolotukhin (2008). Given the and coordinates (Table 1), NGC 2175s is located kpc outside the Solar circle and pc above the plane.
6 Stellar mass estimate
Followed by a developing, poorly-populated MS, PMS stars are the dominant (in number) component in the CMDs of our clusters (Figs. 3 and 4). Consequently, most of the cluster mass is still stored in the PMS stars. Thus, to estimate the cluster mass we simply consider the number of MS and PMS stars (for ) on the field-decontaminated photometry.
The mass of each MS star is taken from the mass-luminosity relation corresponding to the isochrone solution (Sect. 5.3). Summing up these values for all stars produces the total number () and mass () of MS stars. MS stars are detected within the range (Table 4). For the PMS, on the other hand, the presence of differential reddening precludes such an estimate of individual masses. Thus, we simply count the number of PMS stars and adopt an average PMS mass value to estimate and . To compute the average PMS mass value we use the Kroupa (2001) initial mass function666Defined as , it assumes the slopes for , for , and for . for PMS masses between . The result is . The estimated values are given in Table 4, which also gives the average mass density () of each cluster.
| MS | PMS | MSPMS | ||||||
|---|---|---|---|---|---|---|---|---|
| Cluster | ||||||||
| () | (stars) | () | (stars) | () | (stars) | () | () | |
| (1) | (2) | (3) | (4) | (5) | (6) | (7) | (8) | (9) |
| NGC 2175s | 1.7-6.5 | |||||||
| Sh2-252A | 2.7-3.8 | |||||||
| Sh2-252C | 1.7-6.5 | |||||||
| Sh2-252E | 1.7-5.5 | |||||||
| Teu 136 | 2.7-5.5 | |||||||
-
Col. 2: Effective mass range of the MS. Col. 9: average mass density.
As anticipated by the CMDs (Figs. 3 and 4) and the small sizes (Table 3), we are dealing with low-mass clusters () having poorly-populated MSs and with most () of the stars still in the PMS. Indeed, the mass stored in the PMS stars is the dominant ( to ) component of the detected cluster mass, which is consistent with the young ages. However, given the presence of dust and gas (Figs. 1 and 2), differential reddening, and the 2MASS photometric limitation (which precludes detection of very-low mass PMS stars), the mass values may be somewhat higher than quoted in Table 4.
7 Summary and conclusions
Previous works on the H II region NGC 2174 (Sh2-252) came up with discrepant values for the age and distance from the Sun of the deeply-embedded star clusters (and candidates) in the area, to the point that no physical relation among them - and the complex - could have been inferred.
We investigate the above issue with field-star decontaminated 2MASS photometry (to enhance CMD evolutionary sequences) and stellar RDPs, to derive fundamental and structural parameters of the 5 previously catalogued embedded clusters (Sh2-252A, C, E, NGC 2175s, and Teu 136) and one candidate (NGC 2175).
The decontaminated CMDs are characterised by similar properties: a poorly-populated and developing MS, a dominant fraction ( in number) of PMS stars, a similar foreground absorption, mag, and some differential reddening. Taken together, the presence of gas, dust, some O V and B V stars, and the MSPMS CMD morphologies consistently constrain the age of the ECs (and the extended stellar group) to less than Myr (the bulk of the stars are probably Myr old), with a time-spread of Myr for the star formation. The MSPMS stellar masses are low, within to . Within the uncertainties, the distances from the Sun of Sh2-252A, C, E, NGC 2175s, and NGC 2175 are essentially the same, kpc, which agrees with that estimated for the physically-related association Gem OB1. Teu 136 appears to be slightly more distant ( kpc) and reddened ( mag) than the other objects. Since Teu 136 is beyond the north-east border of NGC 2174, it may be just an EC projected near the H II region. The decontaminated wide-field CMD of NGC 2174, which is expected to reflect the average properties of the stars in the region, provides the distance kpc and the foreground absorption .
The stellar RDPs of Sh2-252A, C, E, NGC 2175s, and Teu 136 follow a King-like function characterised by small core and cluster radii, with and , respectively. NGC 2175, on the other hand, is not a cluster, and its stars probably originated on the same star-formation event that gave rise to the ECs. Thus, NGC 2175 may be classified as a young stellar group.
What can be concluded from our uniform, near-infrared approach, is that NGC 2174 and its related ECs (Sh2-252A, C, E, NGC 2175s, and perhaps, Teu 136) are part of a single star-forming complex located at kpc from the Sun. Thus, we are dealing with a coeval (to within Myr) star-forming event that extended for Myr. Besides the scattered stars of NGC 2175 (probably an off-cluster star formation in the molecular cloud), the event gave rise to at least 4 ECs in the complex. Finally, the derivation of constrained distance values for star-forming complexes is important for spiral arm structure studies (e.g. Russeil 2003), by providing a kinematically-independent determination, especially for central and anti-centre directions.
Acknowledgements
We thank an anonymous referee for interesting comments and suggestions. We acknowledge support from the Brazilian Institution CNPq. This publication makes use of data products from the Two Micron All Sky Survey, which is a joint project of the University of Massachusetts and the Infrared Processing and Analysis Centre/California Institute of Technology, funded by the National Aeronautics and Space Administration and the National Science Foundation. This research has made use of the WEBDA database, operated at the Institute for Astronomy of the University of Vienna.
References
- Bica, Dutra & Barbuy (2003) Bica E., Dutra C.M. & Barbuy B. 2003, A&A, 397, 177
- Blitz, Fich & Stark (1982) Blitz L., Fich M. & Stark A.A. 1982, ApJS, 49, 183
- Bonatto & Bica (2005) Bonatto C. & Bica E. 2005, A&A, 437, 483
- Bonatto & Bica (2007) Bonatto C. & Bica E. 2007, MNRAS, 377, 1301
- Bonatto & Bica (2008b) Bonatto C. & Bica E. 2008b, A&A, 485, 81
- Bonatto & Bica (2010a) Bonatto C. & Bica E. 2010a, MNRAS, 403, 996
- Bonatto & Bica (2010b) Bonatto C. & Bica E. 2010b, A&A, 516, 81
- Cardelli, Clayton & Mathis (1989) Cardelli J.A., Clayton G.C. & Mathis, J.S. 1989, ApJ, 345, 245
- Carpenter et al. (1993) Carpenter J.M., Snell R.L., Schloerb F.P. & Skrutskie M.F. 1993, ApJ, 407, 657
- Dias et al. (2002) Dias W.S., Alessi B.S., Moitinho A. & Lépine J.R.D., 2002, A&A 389, 871,
- Dunham et al. (2010) Dunham M.K., Rosolowsky E., Evans II N.J., Cyganowski C.J., Aguirre J., Bally J., Battersby C., Bradley E.T. et al. 2010, ApJ, 717, 1157
- Dutra, Santiago & Bica (2002) Dutra C.M., Santiago B.X. & Bica E. 2002, A&A, 383, 219
- Efremov (1995) Efremov Yu.N. 1995, AJ, 110, 2757
- Elmegreen (2008) Elmegreen B.G. 2008, in Globular Clusters - Guides to Galaxies, ESO Astrophysics Symposia. ISBN 978-3-540-76960-6. Springer Berlin Heidelberg, 2009, p. 87
- Friel (1995) Friel E.D. 1995, ARA&A 1995, 33, 381
- Georgelin, Georgelin & Roux (1973) Georgelin Y.M., Georgelin Y.P. & Roux S. 1973, A&A, 25, 337
- Girardi et al. (2002) Girardi L., Bertelli G., Bressan A., Chiosi C., Groenewegen M.A.T., Marigo P., Salasnich B. & Weiss A. 2002, A&A, 391, 195
- Gouliermis et al. (2008) Gouliermis D.A., Chu You-Hua, Henning T., Brandner W., Gruendl R.A., Hennekemper E. & Hormuth F. 2008, ApJ, 688, 1050
- Hennekemper et al. (2008) Hennekemper E., Gouliermis D.A., Henning T., Brandner W. & Dolphin A.E. 2008, ApJ, 672, 914
- King (1962) King I. 1962, AJ, 67, 471
- Koposov, Glushkova & Zolotukhin (2008) Koposov S.E., Glushkova E.V. & Zolotukhin I.Yu. 2008, A&A, 486, 771
- Kronberger et al. (2006) Kronberger M., Teutsch P., Alessi B., Steine M., Ferrero L., Graczewski K., Juchert M., Patchick D. et al. 2006, A&A, 447, 921
- Kroupa (2001) Kroupa P. 2001, MNRAS, 322, 231
- Kumar, Keto & Clerkin (2006) Kumar M.S.N., Keto E. & Clerkin E. 2006, A&A, 449, 1033
- Piskunov et al. (2007) Piskunov A.E., Schilbach E., Kharchenko N.V., Röser S. & Scholz R.-D. 2007, A&A, 468, 151
- Pismis (1970) Pismis P. 1970, BOTT, 5, 219
- Reid et al. (2009) Reid M.J., Menten K.M., Zheng X.W., Brunthaler A., Moscadelli L., Xu Y., Zhang B. & Sato M. 2009, ApJ, 700, 137
- Russeil (2003) Russeil D. 2003, A&A, 397, 133
- Sabbi et al. (2007) Sabbi E., Sirianni M., Nota A., Tosi M., Gallagher J., Meixner M., Oey M.S., Walterbos R., Pasquali A., Smith L.J. & Angeretti L. 2007, AJ, 133, 44
- Saurin, Bica & Bonatto (2010) Saurin T.A., Bica E. & Bonatto C. 2010, MNRAS, 407, 133
- Sharpless (1959) Sharpless S. 1959, ApJS, 4, 257
- Siess, Dufour & Forestini (2000) Siess L., Dufour E. & Forestini M. 2000, A&A, 358, 593
- Skrutskie et al. (2006) Skrutskie M.F., Cutri R., Stiening R., Weinberg M.D., Schneider S.E., Carpenter J.M., Beichman C., Capps R. et al. 2006, AJ, 131, 1163