A Pan-Carina YSO Catalog: Intermediate-Mass Young Stellar Objects in the Carina Nebula Identified Via Mid-Infrared Excess Emission
Abstract
We present a catalog of 1439 young stellar objects (YSOs) spanning the 1.42 deg2 field surveyed by the Chandra Carina Complex Project (CCCP), which includes the major ionizing clusters and the most active sites of ongoing star formation within the Great Nebula in Carina. Candidate YSOs were identified via infrared (IR) excess emission from dusty circumstellar disks and envelopes, using data from the Spitzer Space Telescope (the Vela–Carina survey) and the Two-Micron All Sky Survey. We model the 1–24 m IR spectral energy distributions of the YSOs to constrain physical properties. Our Pan-Carina YSO Catalog (PCYC) is dominated by intermediate-mass (2 M☉ M☉) objects with disks, including Herbig Ae/Be stars and their less evolved progenitors. The PCYC provides a valuable complementary dataset to the CCCP X-ray source catalogs, identifying 1029 YSOs in Carina with no X-ray detection. We also catalog 410 YSOs with X-ray counterparts, including 62 candidate protostars. Candidate protostars with X-ray detections tend to be more evolved than those without. In most cases, X-ray emission apparently originating from intermediate-mass, disk-dominated YSOs is consistent with the presence of low-mass companions, but we also find that X-ray emission correlates with cooler stellar photospheres and higher disk masses. We suggest that intermediate-mass YSOs produce X-rays during their early pre-main sequence evolution, perhaps driven by magnetic dynamo activity during the convective atmosphere phase, but this emission dies off as the stars approach the main sequence. Extrapolating over the stellar initial mass function scaled to the PCYC population, we predict a total population of YSOs and a present-day star formation rate (SFR) of M☉ yr-1. The global SFR in the Carina Nebula, averaged over the past Myr, has been approximately constant.
Subject headings:
circumstellar matter — ISM: individual (NGC 3372) — stars: formation — stars: luminosity function, mass function — stars: pre-main sequence — X-rays: stars1. Introduction
The Great Nebula in Carina (NGC 3372) is among the most active massive star-forming complexes in the Galaxy. Over 70 O-type stars ionize a giant H II region (Smith, 2006a) and power a bipolar superbubble that has erupted from a 100-pc scale giant molecular cloud complex (Smith et al., 2000). The Carina Nebula is often considered to be the nearest analog of extragalactic starburst regions ( kpc; Smith, 2006b), and it is also the least obscured. Carina thus presents a rich target for the study of resolved young stellar populations evolving in an environment dominated by some of the most massive stars known. While numerous studies have targeted individual rich ionizing clusters in Carina (Feinstein et al., 1980; Massey & Johnson, 1993; DeGioia-Eastwood et al., 2001; Ascenso et al., 2007; Sana et al., 2010), global observations of the stellar populations across the complex are challenging. Due to its large angular size (), it is difficult to achieve the requisite wide observational coverage of the Carina Nebula at high spatial resolution. Its position near the Galactic midplane () means that wide-field images at visual and infrared (IR) wavelengths are dominated by contaminating populations of unassociated stars. The Chandra Carina Complex Project (CCCP), a 1.2 Ms total X-ray integration covering a 1.42 deg2 field in the center of the Carina Nebula, provides an unprecedented opportunity to overcome these observational challenges and study the young stellar populations from a global perspective, yet at the detailed level of resolving individual stars (Townsley et al., 2011).
X-ray observations of star-forming regions are highly sensitive to low-mass pre-main-sequence (PMS) stars (T Tauri stars), which generate hard X-rays via convectively-driven magnetic flaring activity (Preibisch et al., 2005) and to OB stars that produce soft X-rays primarily through micro-shocks in their strong stellar winds (Lucy & White, 1980; Feldmeier et al., 1997). Both classical T Tauri stars with circumstellar disks and protostars with accreting envelopes are observed to be significantly less luminous in X-rays compared to diskless, weak-lined T Tauri stars (Stassun et al., 2004; Telleschi et al., 2007; Prisinzano et al., 2008). The CCCP observations are expected to be insensitive to intermediate-mass (2 M☉ M☉) young stellar objects (YSOs), including Herbig Ae/Be stars with disks and their less evolved progenitors, which lack a known mechanism for the production of strong X-ray emission (Stelzer et al., 2006). This important stellar population traces recent and ongoing star formation in massive complexes like Carina. Because such stars have high bolometric luminosities and possess dusty disks and envelopes that reprocess the stellar radiation into strong mid-IR emission, surveys with the Spitzer Space Telescope are very sensitive to them (Koenig et al., 2008; Robitaille et al., 2008; Kang et al., 2009; Povich & Whitney, 2010, hereafter PW10). The entire Carina Nebula was included in the Spitzer Vela–Carina survey. This complementarity between the IR and X-ray observations motivates us to search for candidate YSOs throughout the Carina Nebula using Vela–Carina survey data in conjunction with supplementary IR datasets.
The Carina complex contains at least M☉ in molecular gas mass (Grabelsky et al., 1988) but hosts few bright embedded IR sources or other signposts of ongoing massive star formation; hence historically the Carina Nebula has been regarded as a relatively evolved H II region, with a current star formation rate (SFR) that is negligible in comparison with its historical rate (Smith & Brooks, 2008, and references therein). Within the past decade, a new view of star formation in Carina has emerged, in which active star formation has migrated to the outer reaches of the nebula, in particular the region known as the South Pillars, where remnant molecular cloud material has been shredded and sculpted into myriad clumps, pillars, and elephant-trunk structures by stellar winds and radiation, the two dominant feedback mechanisms produced by massive stars during their lifetimes (Megeath et al., 1996; Smith et al., 2000; Rathborne et al., 2004; Smith & Brooks, 2007). Smith et al. (2010b, hereafter SP10) presented the first Spitzer imaging study of Carina using the Infrared Array Camera (IRAC; Fazio et al., 2004) and found over 900 candidate YSOs widely distributed throughout two large fields covering the South Pillars and a portion of the opposite wall of the southern superbubble lobe. Carina remains a highly active star-forming region, but it may be unusual among Galactic giant molecular glouds (GMCs) in the sense that the dominant mode of current star formation activity appears to be triggering by feedback from the local massive stellar population (SP10).
Our present study expands upon the Spitzer point-source results presented by SP10 in several ways: (1) The Vela–Carina observations extend Spitzer coverage to the entire Carina Nebula, including the central ionizing clusters and regions to the North. The wide-field coverage enables us to analyze relatively empty “control” fields far from the Carina GMC and correct for contamination in our YSO sample from unassociated sources with similar mid-IR colors. (2) We incorporate 24 m photometry from the Multiband Imaging Photometer for Spitzer (MIPS; Rieke et al., 2004) to constrain the evolutionary stages and luminosities of individual YSOs better than what is possible with IRAC photometry alone. (3) We analyze the subsample of YSOs that match CCCP catalog sources to investigate the physical properties of candidate X-ray-emitting protostars and intermediate-mass PMS stars with disks.
In this paper, we present a highly-reliable catalog of 1,439 predominantly intermediate-mass YSOs throughout the Carina Nebula, selected via their IR excess emission. This Pan-Carina YSO Catalog (PCYC) complements and augments the CCCP X-ray catalog (Broos et al., 2011a). The data analysis steps used to construct the PCYC are summarized in §2, and the methodology used to model the physical properties of the YSOs is described in §3. In §4, we present the ensemble properties of the YSO population, in §5 we analyze the subset of our sample associated with X-ray emission, and in §6 we highlight five noteworthy YSO clusters and sub-groups and several interesting individual YSOs. We discuss our results in the context of the star formation history of the Carina Nebula and the physical mechanism(s) powering X-ray emission from YSOs in §7. We summarize our conclusions in §8.
2. Data Analysis and YSO Sample Selection
2.1. Observations
The Vela–Carina survey (Spitzer Proposal ID 40791, PI
S. R. Majewski), was modeled after
the Galactic Legacy Infrared
Mid-Plane Survey Extraordinaire (GLIMPSE; Benjamin et al., 2003). It used
the 4 mid-IR bands of Spitzer/IRAC (3.6, 4.5, 5.8, and 8.0 m) to
image 86 deg2 of the Galactic plane in a strip 2∘ high in
latitude over longitudes (Zasowski et al., 2009),
an area than included the
Carina complex. PSF-fitting photometry was performed using the GLIMPSE
point-source extractor, a modified version of DAOPHOT (Stetson, 1987)
optimized for crowded fields with strong, varying background nebular
emission. The GLIMPSE extractor produces two source lists, the
99.5%-reliable Point Source Catalog and the more complete Point
Source Archive.111For details of the data processing and
products, go to
[http://irsa.ipac.caltech.edu/data/SPITZER/GLIMPSE/doc/glimpse1_dataprod2̌.0.pdf]http://irsa.ipac.caltech.edu/data/SPITZER/GLIMPSE/doc/glimpse1_dataprod_v2.0.pdf.
The depth of the Vela–Carina photometry is
very similar to that of GLIMPSE, reaching mag (less
sensitive in regions of bright nebular emission). Both the Catalog and
the Archive sources have been matched (bandmerged) with
photometry from the Two-Micron All-Sky Survey Point Source Catalog
(2MASS; Skrutskie et al., 2006), and the resulting source lists provide
photometry in 7 IR bands, from 1.2 m through 8.0 m. We use
primarily the highly-reliable Catalog for this work, as experience
shows that this drastically reduces the number of false-positives,
candidate YSOs that are generated as the result of systematic
photometric errors. The Vela–Carina Catalog contains 60,515 point
sources inside the CCCP survey area (Table 1).
We do retrieve a few
sources from the Archive that are matched to bright candidate YSOs
detected by the Midcourse Space Experiment (MSX), as described
in §2.4 below.
| Sources | All | CCCP-matched | Description |
|---|---|---|---|
| In Vela–Carina Catalog | 60,515 | 4,664 | Detected IRAC point sources, 99.5% reliable |
| Fit with SED Models | 54,155 | 4,080 | Detected in of 7 2MASS+IRAC bands |
| Stellar Photospheres | 50,586 | 3,444 | Well-fit by stellar atmosphere SEDs |
| Possible IR Excess | 3,569 | 636 | Poorly-fit by stellar atmosphere SEDs |
| Marginal IR Excess | 1,923 | 213 | Excess in only IRAC [5.8] or [8.0] band |
| Reliable IR Excess | 1,646 | 423 | Intrinsically red objects |
| In PCYCaaIncludes 3 Vela-Carina Archive sources with MSX counterparts. | 1,439 | 410 | YSO catalog, corrected for contamination |
| Stage 0/I | 247 | 62 | Dominant SED models: infalling envelopes |
| Stage II | 478 | 190 | Dominant SED models: optically thick disks |
| Stage III | 83 | 13 | Dominant SED models: optically thin disks |
| Ambiguous | 631 | 144 | Inconclusive SED model classification |
The CCCP catalog contains over 14,000 point sources detected by the Advanced CCD Imaging Spectrometer (ACIS; Garmire et al., 2003) of the Chandra X-ray Observatory. Broos et al. (2011a) matched the Vela–Carina Archive to the CCCP X-ray catalog and found 6,543 counterparts to CCCP sources. The Vela–Carina Catalog is a subset of the Archive, and provides mid-IR counterparts for 4,664 CCCP sources (Table 1).
The Carina Nebula was observed with Spitzer/MIPS during late July 2007 as part of program GO-30848 (MIPSCAR; P.I. N. Smith). The program consisted of a series of MIPS scans that covered most of the area of the star forming region but avoided the bright emission of the Homunculus nebula around Carinae. This yielded a large mosaic image of the 24 emission that contains the entire CCCP survey area.
2.2. Identification of Candidate YSOs
YSOs possess dusty circumstellar disks and infalling envelopes that reprocess radiation from the central stars, producing characteristic IR excess emission. YSOs can be identified in broad-band photometric imaging observations via their IR colors or spectral energy distributions (SEDs). Our procedure for identifying candidate YSOs is adapted from Povich et al. (2009), SP10, and PW10. Here we outline the main steps used in constructing our highly-reliable catalog of candidate YSOs, and we summarize the number of sources found within the CCCP survey area for each step in Table 1. Using a -minimization SED fitting tool (Robitaille et al., 2007), we fit reddened Castelli & Kurucz (2004) stellar atmospheres (allowing to vary between 0 and 40 mag according to the extinction law of Indebetouw et al., 2005) to the SEDs of 210,742 sources in the Vela-Carina Catalog located within a field, 54,155 of which fell within the CCCP survey area (Table 1).222The full field analyzed is much larger than the CCCP field; regions of active star formation identified in this wider field will be the subject of a future paper. Only sources detected in of the 7 Catalog bands (–8 m) were fit. To avoid biasing the fits for sources where the photometric uncertainties may have been underestimated in the Catalog, before fitting any models we conservatively reset the uncertainties to a minimum value of 10%. We considered sources for which ( is the unreduced goodness-of-fit parameter of the best-fit model; SP10) to be well-fit by stellar atmosphere SEDs; among sources in the CCCP field that were fit with SED models, 93.4% were consistent with normally-reddened stellar photospheres (Table 1) and hence were removed from consideration for the PCYC.
We then filtered out sources with “marginal” IR excess emission, where the excess appears in only the single IRAC [5.8] or [8.0] band, using the SP10 color criteria, modified to de-redden the colors of background stars viewed through the Carina cloud by up to mag. Using to denote magnitudes in the various IRAC bands and for the uncertainties on the colors computed from the (minimum 10%) uncertainties on Catalog flux densities, the selection criteria were as follows:
The color excess used for the de-reddening was calculated as
where the are opacities given by the extinction law (Indebetouw et al., 2005). This step is crucial to distinguish intrinsically red objects from sources affected by potential systematic photometric errors (Povich et al., 2009); IRAC [5.8] and [8.0] are less sensitive to point sources and more affected by nebular emission compared to IRAC [3.6] and [4.5]. We discarded 1,923 of these “marginal” IR excess sources, leaving 1,646 “reliable” intrinsic IR excess sources, which form the basis for our sample of candidate YSOs (Table 1). Throwing out the majority of the possible IR excess sources in this manner may seem overly conservative, but we note that among the CCCP-matched subsample, only 1/3 of sources were caught by this filter (Table 1). The Vela–Carina survey images are dominated by K- and M-type giants in the Galactic field that are not expected to emit X-rays (Rosner et al., 1995). If the majority of marginal IR excess sources were actually due to emission from disks, perhaps transitional disks with large inner holes, we would expect the fraction of sources rejected at this step among the X-ray detected subsample to be similar to, if not higher than, the fraction rejected from the full sample. Instead, the significantly lower frequency of marginal IR excess sources with X-ray counterparts affirms that the majority of these sources are unassociated field stars. The 213 CCCP-matched sources in Table 1 rejected on account of marginal IR excess are examined again by Povich et al. (2011, hereafter P11).
2.3. MIPS 24 m Aperture Photometry
Our data analysis is tailored to the goal of fitting YSO model SEDs from Robitaille et al. (2006, hereafter RW06) to the available IR photometry of each candidate YSO. Because the SEDs of highly embedded YSOs peak in the thermal IR near 100 m, photometry at m is often required to constrain bolometric luminosities and to distinguish envelope-dominated (Stage 0/I) from disk-dominated (Stage II) YSOs (RW06; Indebetouw et al., 2007). Following PW10, we measured MIPS 24 m flux densities using aperture photometry. We located the position of each candidate YSO and centered an extraction aperture of radius 3.5″ and background annulus of inner and outer radii 7″ and 13″, respectively, on the MIPS 24 m mosaic of Carina. We extracted 24 m flux densities for each source, estimating the background level using the Daophot MMM algorithm (Stetson, 1987). Our choice of extraction aperture required an aperture correction333MIPS Instrument Handbook v1.0, [http://ssc.spitzer.caltech.edu/mips/mipsinstrumenthandbook/]http://ssc.spitzer.caltech.edu/mips/mipsinstrumenthandbook/ of 2.8. The uncertainty introduced by the aperture correction is more than offset by the greater accuracy of the local background determination and the ability to separate close sources (PW10).
PW10 analyzed MIPSGAL 24 m survey data (Carey et al., 2009) covering the M17 SWex IR dark cloud. The MIPSCAR observations are shallower than the MIPSGAL observations and affected by extremely bright nebular emission produced by warm dust in the Carina H II region. While of the YSOs cataloged by PW10 were detected at 24 m, the detection fraction is only for the PCYC. We can, however, derive useful upper limits on 24 m flux densities in the majority of cases. Upper limits provide critical constraints for the SED fitting, since the RW06 models may predict variations of more than an order of magnitude in 24 m flux density even when the IRAC flux densities are well-measured. Detections and upper limits were defined as follows: The formal uncertainty on the aperture photometry is generally dominated by the uncertainty on the photometric background determination but also takes into account photon counting statistics (including the contribution of the zodiacal background light). Taking to be the extracted flux density, sources for which were considered undetected at 24 m, and upper limits of for and for were assigned. The results of our aperture photometry are presented in Table 2, in which the 24 m quality flags (column 20) are set to 1 for detections and 3 for upper limits. No photometric information can be obtained for sources falling within regions of the 24 m mosaic where the nebular emission saturates (for example, in the vicinity of Car); these are given quality flags of 0. For the 24 m detections we set the minimum uncertainty to to account for systematic uncertainties. One potential source of systematics is the mid-IR extinction law for m, which appears to vary with environment. Recent observational work with Spitzer has found that, in molecular clouds, the absorption at 24 m is similar to, not less than, the absorption at 8 m (e.g. Flaherty et al., 2007). We therefore used the high-column-density () mid-IR extinction law of McClure (2009) when fitting the RW06 models to the SEDs of the candidate YSOs.
2.4. MSX Detections of Luminous Candidate YSOs
We incorporate 8–21 m photometry from the MSX Galactic Plane Survey Point Source Catalog (Price et al., 2001) into our YSO sample in 2 ways: (1) Spatial correlation of MSX sources with the candidate YSOs and (2) visual identification of bright mid-IR sources within the CCCP field that were excluded from the Vela-Carina Catalog because they were either marginally resolved or saturated. Moderately saturated sources were included in the more complete Vela-Carina Point Source Archive, and we added 3 MSX sources with Archive matches to the sample. Only 11 PCYC sources have MSX counterparts (indicated in Table 2), but these include the most luminous YSOs in the cloud. Most of these objects were previously cataloged by Rathborne et al. (2004) or Smith & Brooks (2007). The addition of up to 4 MSX datapoints provides strong constraints on the mid-IR SEDs along with replacements for Spitzer photometry suffering from saturation at 8.0 or 24 m.
2.5. Removal of Contaminating IR Excess Sources
While it is dominated by YSOs, the sample of reliable IR excess sources (Table 1) may also contain the following types of contaminants: variable stars, dusty asymptotic giant branch (AGB) stars, unresolved planetary nebulae, and background galaxies (Robitaille et al., 2008; Povich et al., 2009). Although few in number, luminous AGB stars are the most important contaminants, as they can masquerade as massive YSOs. The majority of AGB stars have mag, and the few extreme AGB stars that are redder are highly luminous and would be conspicuously bright (Whitney et al., 2008; Povich et al., 2009). Applying this color cut removed 1% of sources. We correct for the remaining contamination by analyzing the spatial distribution of IR excess sources.
While YSOs associated with the Carina Nebula exhibit a high degree of clustering (SP10), contaminating sources, including foreground YSOs, are distributed uniformly. We used the nearest-neighbor group-finding algorithm described by Povich et al. (2009) to identify sources exhibiting a significant degree of clustering with respect to 3 “control” fields located outside of the CCCP field. The algorithm was tuned to be sensitive to groupings of sources. The control fields were boxes centered at , , and , containing a mean surface density of reliable IR excess sources of deg-2. The surface density of reliable IR excess sources inside the 1.42 deg2 CCCP field is deg-2 (Table 1), hence the expected contamination fraction from sources unassociated with the Carina Nebula is . After removing sources from the sample that did not satisfy the clustering criterion, the source density in the final PCYC is deg-2, indicating a residual contamination level of deg-2, or 5%.
3. Model-Based YSO Characterization and Classification
Basic IR photometric data for the 1439 YSOs in the PCYC are presented in Table 2. Using the Robitaille et al. (2007) SED fitting tool, we fit YSO models from RW06 to the available photometry of each source. We allowed the fitting tool to accept a range of distances of kpc, guided by the well-established distance to Car from expansion measurements of the Homunculus nebula (Smith, 2006b) and by the assumption that the depth of the Carina Nebula along the line of sight is not greater than its pc diameter observed on the sky. We define the set of well-fit models for each YSO according to , and assign a –weighted, normalized probability to each model (Povich et al., 2009). This enables us to construct probability distributions for the model parameters and thereby constrain physical properties such as luminosity, mass, and accretion rate. In general, the parameters are not normally distributed, so the physical properties for individual sources must be interpreted with care. We present results from the model fitting to the PCYC sources in columns (2)–(8) of Table 3. For each YSO, we list characteristic values of 3 parameters along with corresponding uncertainties. The characteristic values for the stellar parameters mass () and bolometric luminosity () are calculated as the probability-weighted means of the parameter distributions,
| (1) |
Circumstellar parameters in the RW06 models, such as envelope accretion rate (), span many orders of magnitude. We define the characteristic circumstellar parameters as the medians of the parameter distributions,
| (2) |
because this approach is less affected by any extreme outlying values returned by the fitting procedure. For both stellar and circumstellar parameters, we compute the uncertainty as the standard deviation on the characteristic parameter value .
The YSO models are divided into evolutionary stages that parallel the well-known empirical T Tauri classification system based on IR colors or spectral indices: Stage 0/I YSOs are still embedded in their infalling, natal envelopes; Stage II YSOs have optically thick circumstellar disks; Stage III YSOs have optically thin disks (RW06). We construct probability distributions of evolutionary stage for each YSO and classify a YSO as Stage 0/I, II, or III if ; we refer to the classification of sources not meeting this criterion as “Ambiguous” (Povich et al., 2009). We prefer the RW06 stage classification system to the traditional T Tauri class system because (1) it makes the model-dependent nature of the taxonomy explicit rather than implicit, (2) the incorporation of Ambiguous classifications acknowledges the limitations of imposing distinct categories on a continuous evolutionary sequence, and (3) a model-based system provides physical insight into intermediate- and high-mass YSOs for which a classification based on the empirical colors of low-mass T Tauri stars may not be meaningful. The distribution of stage classifications across the PCYC is presented in Table 1, and the classification for each YSO is given in Table 3 (column 8).
The 410 YSOs detected in X-rays are identified in Table 3 by CCCP catalog name (column 9). Feigelson et al. (2011, hereafter F11) divided the CCCP field into 4 broad regions (A, B, C, and D) and also identified 20 X-ray clusters and 31 smaller groups. We assign every PCYC source to one of these regions and possibly also to one of the clusters/groups according to the region/cluster/group membership of the nearest CCCP catalog source (columns 10 and 11 of Table 3).
The PCYC (Tables 2 and 3) is a compilation of individual candidate YSOs in Carina that we hope will provide a rich dataset for future follow-up studies. For the present work, we are concerned primarily with the ensemble properties of the population. The large sample size provides robust statistics to compensate for potentially large uncertainties on individual YSOs whose physical properties, such as stellar mass and bolometric luminosity, may not be well-constrained by the RW06 models.
4. Global Properties of the Carina YSO Population
4.1. Spatial Distribution
The positions of sources in the YSO catalog are plotted on an IRAC 8.0 m mosaic image from the Vela–Carina survey in Figure 1. While YSOs are distributed widely throughout the CCCP field, the population generally traces the broad North–South stellar “backbone” joining the major ionizing clusters Trumpler (Tr) 14 and 16 with the Collinder (Cr) 228/South Pillars region (Townsley et al., 2011, F11). Contours of the major molecular clouds traced in CO emission and the locations of 8 dense C18O molecular cloud cores (Yonekura et al., 2005) are also plotted in Figure 1. While the spatial distribution of YSOs throughout the Carina Nebula exhibits highly complex structure, with clustering on multiple spatial scales, a general pattern is readily discernible. The majority of YSOs are located inside H II region cavities near, but less frequently within, the boundaries of dense molecular clouds and the ends of pillars.
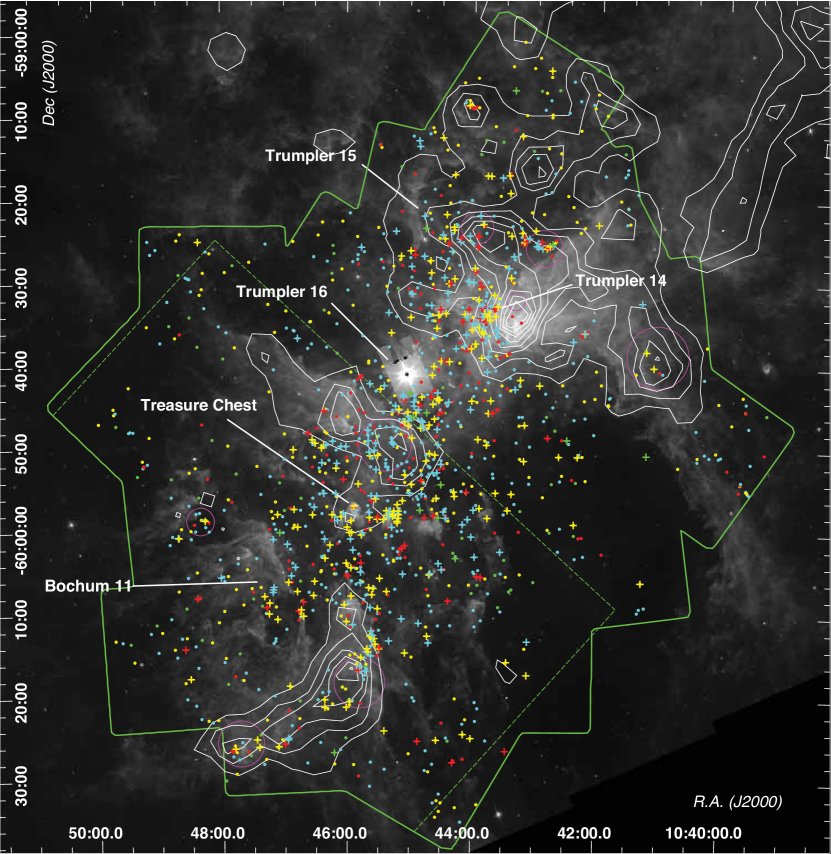
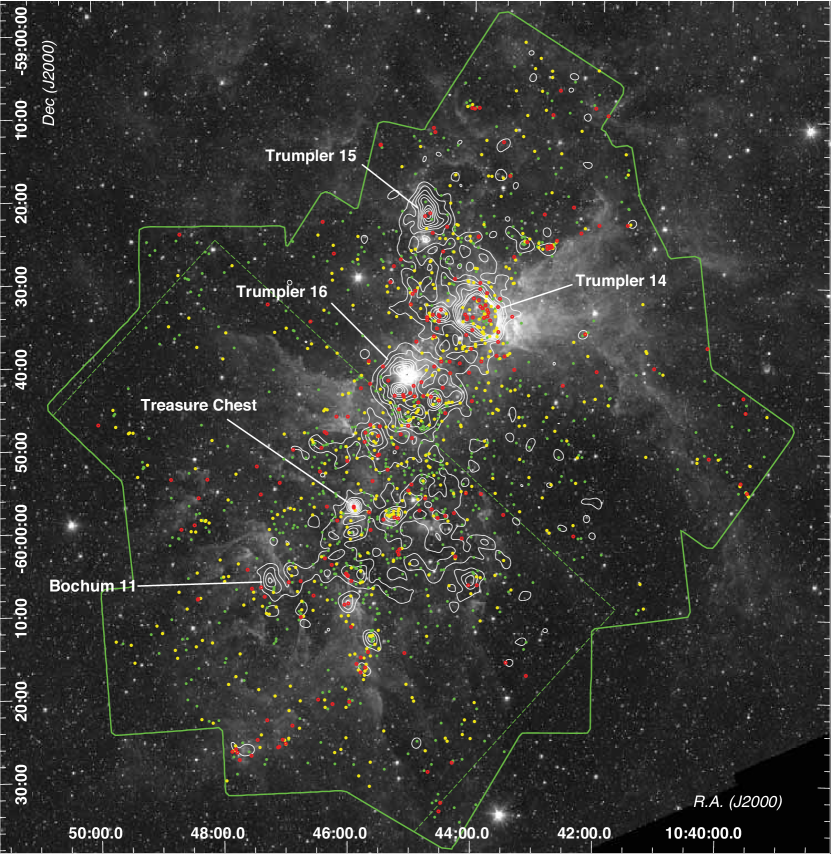
Another view of the PCYC is presented in Figure 2, in which a Vela–Carina 3.6 m mosaic is presented with YSOs color-coded by mass. YSOs in 3 mass ranges roughly corresponding to the mass ranges of Herbig Be stars, Herbig Ae stars, and T Tauri stars are colored red, yellow, and green, respectively. Density contours of CCCP sources from F11 depict all of the major clusters as well as numerous smaller stellar groupings. The largest concentration of intermediate-mass YSOs is found not in the South Pillars, but in Tr 14 itself. Numerous sub-clusters of Tr 16 (F11) also have associated YSOs.
Several caveats regarding the Spitzer point-source detections must be kept in mind when analyzing the PCYC. The strong and variable nebular emission across the Carina Nebula, especially at 8.0 and 24 m, creates complicated, position-dependent variations in the sensitivity limit for mid-IR point-source detections. In addition, the IRAC images are confusion-limited in the dense cluster centers. The PCYC is very incomplete near Car, a highly saturated Spitzer source visible at the center of Figures 1 and 2, and in the Treasure Chest, a very young, embedded cluster (Smith et al., 2005), where only 3 candidate YSOs are detected due to extreme crowding and nebulosity. Other potential areas of sensitivity problems include the crowded center of Tr 14 and the ionization front between Tr 14 and the Car I molecular cloud core to the west (Yonekura et al., 2005; Ascenso et al., 2007) where the diffuse mid-IR nebular emission is bright. Nevertheless, the dearth of active star formation within the Car I cloud core appears to be real, not simply a sensitivity effect.
All of the Spitzer YSO sub-clusters cataloged by SP10 are apparent in Figures 1 and 2. In addition, we detect 3 new, tight clusters or groups of YSOs in the Northwest corner of the CCCP area, 2 of which are associated with significant overdensities of X-ray sources (F11). We discuss these new YSO clusters in more detail in §6. YSOs are also detected embedded in the ends of most dust pillars, both in the South Pillars and elsewhere in the Carina Nebula. Some of these are the driving sources of the Herbig-Haro jets found in Hubble Space Telescope images (Smith et al., 2010a). YSOs are also associated with several of the candidate proplyds identified by Smith et al. (2003), specifically proplyds 104405.4–592940 (PCYC 429), 104619.7–595044 (1126), 104632.9–600353 (1173), and 104519.3–594423 (842 and 841). All of the YSOs associated with proplyds have either Stage 0/I or Ambiguous classifications, and none are detected in X-rays.
4.2. YSO Mass Function and Present-Day Star Formation Rate
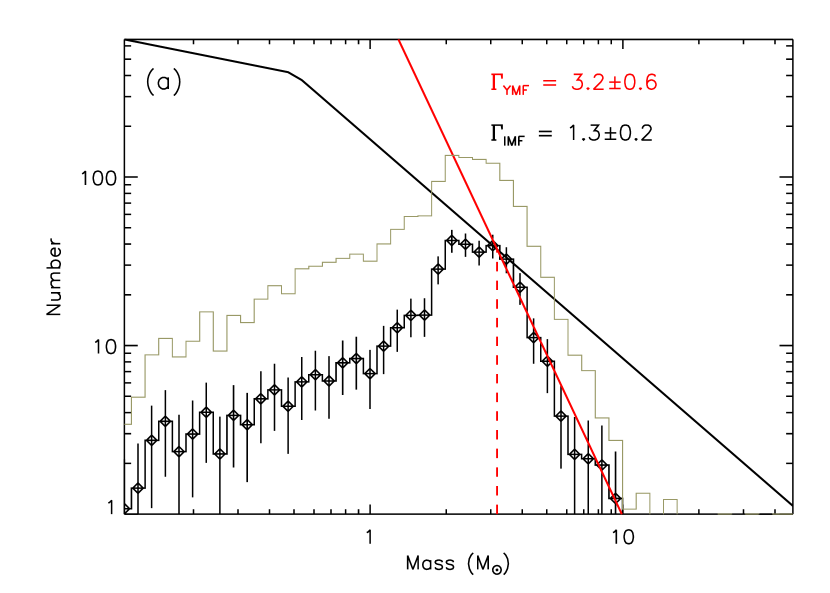
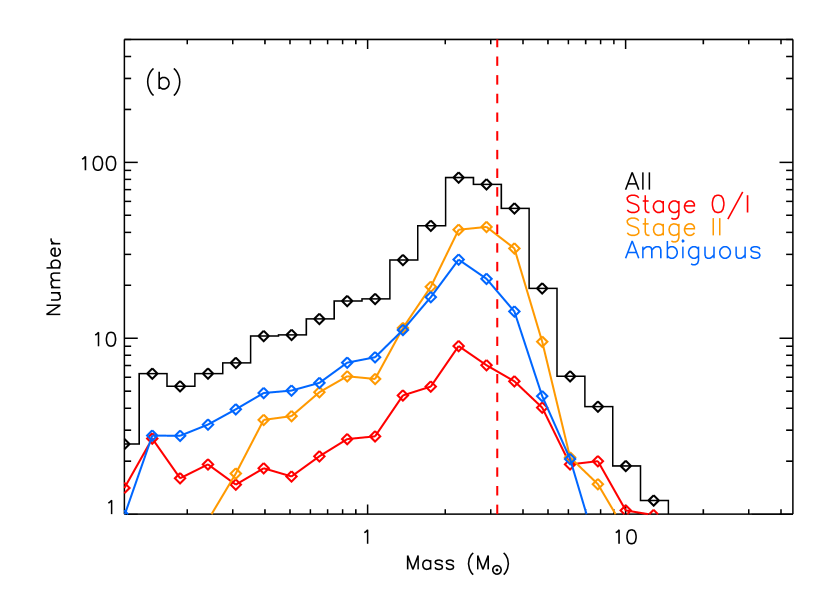
Summing the individual probability distributions of defined by the set of models fit to each YSO, we construct the YSO mass function (YMF; Shepherd et al., 2007; Povich et al., 2009; Kang et al., 2009, PW10) for all 1439 YSOs in the PCYC (Figure 3). The YMF is defined similarly to the stellar initial mass function (IMF), , where is the number of stars in the (logarithmic) mass interval . The Carina YMF exhibits a power-law form for M☉, departing from the power-law due to incompleteness for M☉ (Figure 3a). The power-law slope is significantly steeper than the standard Salpeter–Kroupa IMF slope (Kroupa, 2001). PW10 found a very similar YMF shape, with , for a sample of 488 YSOs in M17 SWex, a GMC complex extending pc outward from the bright Galactic H II region M17.
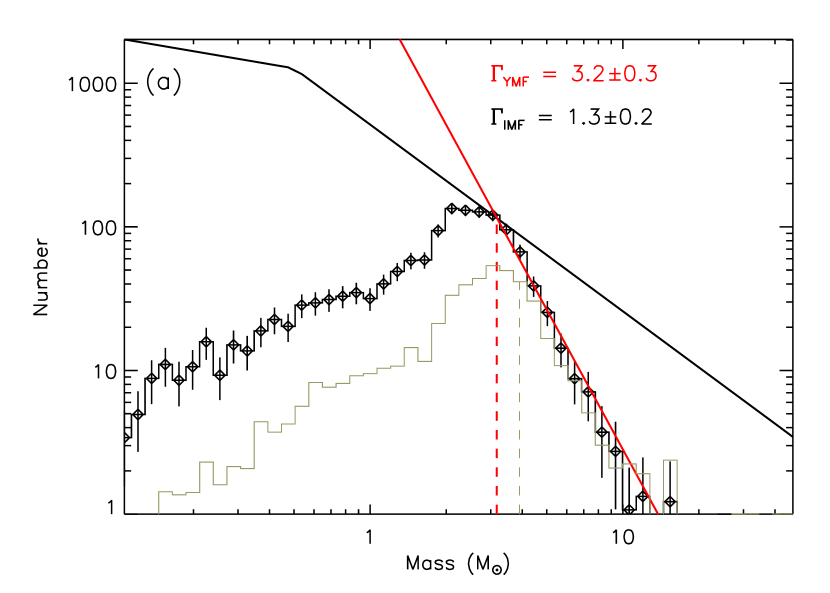
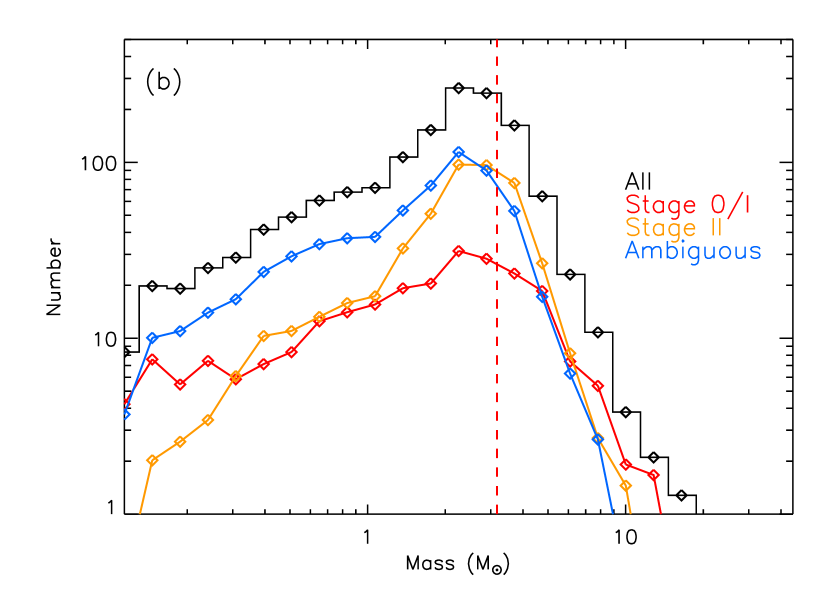
In Figure 3b, the YMF has been broken down by most probable evolutionary stage. This shows that the overall shape of the YMF is dominated by a narrow component from Stage II objects, but also includes a broader component from Stage 0/I objects. The YMF shape of the Ambiguous sources is a blend of these two components. (Stage III YSOs constitute only 6% of the PCYC and are not plotted.) Ambiguous YSOs dominate the (incomplete) low-mass range, which is expected because fainter sources are more likely to lack 24 m detections and other photometric measurements of sufficient quality to tightly constrain their properties. Stage 0/I YSOs are preferentially detected over Stage II YSOs at lower masses because the reddest objects are generally brighter in the mid-IR for a given mass. The steep intermediate-mass slope of the YMF traces both Stage II YSOs and Ambiguous YSOs that are most likely dominated by Stage II objects in this mass range, given the overall distributions of Stage 0/I versus Stage II YSOs. This supports the idea that disk evolution is an important selection effect that steepens the observed YMF slope (PW10).
SP10 considered the idea that rapid disk destruction in massive stars could preferentially remove them from the YSO sample and affect the observed mass function but concluded that this effect does not significantly impact an IMF derived from the YSOs in Carina. This conclusion was based upon a perceived similarity between the empirical and luminosity functions of the Carina YSOs and the scaled - and -band luminosity functions (KLFs and LLFs) for the Orion Nebula Cluster (ONC; Muench et al., 2002). However, Muench et al. (2000) caution that LFs are not reliable tracers of IMFs when the photometry is dominated by IR excess emission. To illustrate the problem, consider the bright end of the KLF. The few most luminous YSOs in the SP10 sample, which are also included in the PCYC, have similar to Ori C, the most luminous star in the ONC. But while the most massive YSOs in Carina are M☉ objects, Ori C is an O star of M☉! While the ONC is a young cluster, the majority of its stars have lost their inner disks, and the KLF used by Muench et al. (2002) to derive the cluster IMF was dominated by emission from stellar photospheres. To better understand the IMF traced by the YSOs in Carina, we rely instead on the RW06 models to relate statistically the observed IR emission to stellar mass. Our approach is subject to its own set of biases and systematics, but it has been designed for the problem at hand and has been tested in numerous other studies (e.g. Whitney et al., 2008; Povich et al., 2009; Kang et al., 2009). We are also aided by the ability to compare Carina to M17 SWex, where a similar sample of YSOs has been analyzed using the same tools (PW10).
The YMF of 488 YSOs in M17 SWex from PW10 is overplotted in Figure 3a for comparison with the PCYC. The similarity between these YMFs is striking; the only obvious difference appears to be a lower mass completeness limit for the PCYC. Both Carina and M17 are 100-pc scale GMC complexes at similar heliocentric distances, each containing several M☉ in molecular gas mass, and each in the process of forming a large OB association. The sensitivity of the GLIMPSE observations to YSOs in M17 SWex was limited primarily by interstellar extinction through the IR dark cloud. In contrast, the interstellar extinction to the Carina YSOs is much lower, and the sensitivity is limited instead by bright nebular emission produced by the H II regions. It is not obvious, however, why high extinction should be a much greater impediment to YSO detections than bright nebulosity. The implied difference in sensitivity is dramatic, meaning that if the YMF of PW10 is intrinsically similar to the PCYC, its completeness at M☉ (corresponding to main-sequence B9 stars) is as low as .
The M17 SWex GMC complex appears to be forming its first generation of stars and lacks very massive, early O stars (PW10). The Carina molecular cloud complex has been thoroughly disrupted by the process of forming tens of thousands of stars, including some of the most massive stars known in the Galaxy (Smith & Brooks, 2007). The environmental differences between these two massive star-formation regions lead us to expect that there are intrinsic differences between the YSO populations, and these differences might be manifest in the YMFs. In particular, we expect that the PCYC includes a larger proportion of more evolved YSOs than the M17 SWex population.
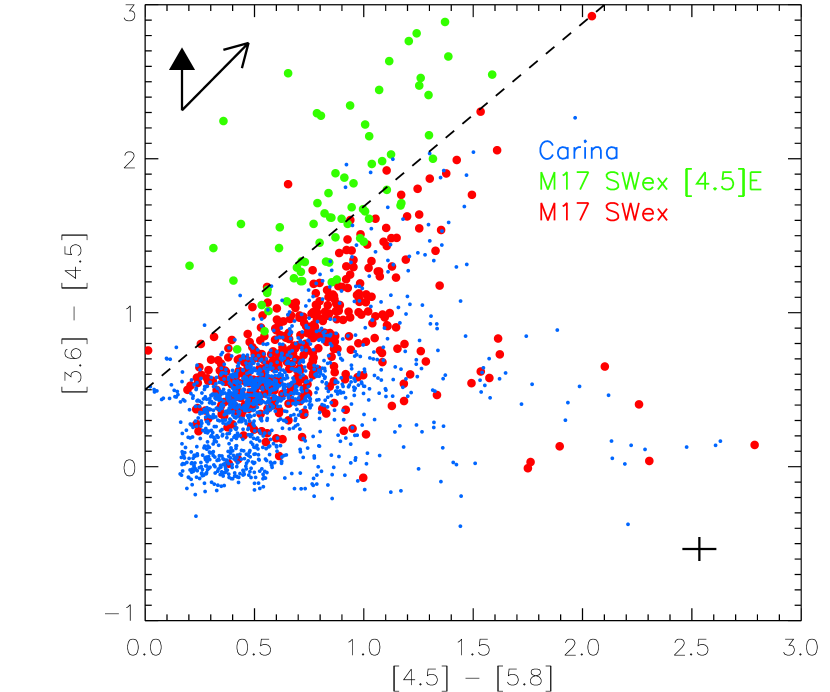
A useful empirical comparison of the PCYC with the M17 SWex YSOs is provided by the plot of the IRAC versus color space presented in Figure 4. PW10 identified a class of predominantly Stage 0/I YSOs that exhibited excess 4.5 m emission (denoted [4.5]E) with respect to the RW06 model SEDs and hypothesized that such sources are unresolved analogs of the extended green objects (EGOs), candidate molecular outflows from massive YSOs cataloged from the GLIMPSE images by Cyganowski et al. (2008). In this interpretation, such sources are expected to be very young, with ages yr, since outflows are powered by rapid accretion (Richer et al., 2000; Shepherd et al., 2007). We find that of [4.5]E candidates from PW10 are found above the line
| (3) |
in Figure 4; these “strong” [4.5]E sources represent 7% of the YSOs in M17 SWex, but of the PCYC. SP10 searched the Spitzer images of Carina for EGOs and found only four candidates. The corresponding dearth of [4.5]E sources supports the conclusion that these objects trace the same phenomenon as the EGOs. The difference between the two regions could be partly environmental; SP10 suggest that the harsh radiation fields permeating the Carina Nebula may dissociate molecules in the outflows, removing the source of the EGO emission. But this comparison also indicates that very young YSOs with high accretion rates are less frequent in Carina than in M17 SWex. Indeed, only 17% of the PCYC are unambiguous Stage 0/I YSOs, compared to 27% Stage 0/I YSOs in the M17 SWex sample (PW10).
The presence of a dusty, circumstellar disk (or an envelope that will presumably evolve into a disk) is a prerequisite for inclusion in the PCYC, hence the upper limit on the age of the YSOs is approximately the disk lifetime. The “canonical” disk lifetime for a solar-mass, classical T Tauri star is Myr (Haisch et al., 2001). If the primary mechanism for destroying dust disks around intermediate-mass YSOs is photo-evaporative dissipation driven by radiation from the central star (Hollenbach et al., 1994; Monnier & Millan-Gabet, 2002), then the disk lifetime should decrease as a strong function of stellar mass. Disk lifetimes for intermediate-mass stars, including Herbig Ae/Be stars, appear to be significantly shorter than for T Tauri stars, typically Myr (Hernández et al., 2007; Povich et al., 2009, PW10). The disk fraction among intermediate-mass stars may therefore be one of the most sensitive chronometers available for massive star-formation regions like Carina.
PW10 showed that the shape of the YMF depends critically on the mass-dependent disk fraction, and hence the recent star formation history. Assuming a constant SFR, the observed YMF slope is steepened by disk evolution above a critical mass for which the disk lifetime is less than the age spread of the YSO population . For , , the disk fraction becomes unity, and the YMF traces the underlying IMF, presumably a Salpeter–Kroupa slope (). As a result, decreases with time. Unfortunately, for the PCYC M☉, meaning that the critical mass falls in the range where our observations are incomplete. This limit means that the critical mass of the PCYC is lower than M☉ found by PW10 for the M17 SWex sample (Figure 3a), and this could be explained by disk evolution proceeding over a longer timescale in the Carina complex. The PCYC does contain a significant population of Stage II/III YSOs with relatively evolved disks. This population is located near the line in Figure 4, hence reddening by interstellar dust is negligible, and the lack of IR excess emission at wavelengths m suggests that the inner disks have been cleared of dust.
Assuming that the underlying IMF of the Carina young stellar population has a normal Salpeter–Kroupa form, we can estimate the present-day SFR in Carina from the PCYC. Scaling the IMF of the ONC (Muench et al., 2002) to match the PCYC YMF where it departs from a power-law at M☉ gives a prediction of YSOs to a limiting mass of 0.1 M☉, corresponding to a total mass in stars of M☉. These numbers are lower limits due to incompleteness. Adopting a conservative upper limit of Myr as the age spread sampled by the PCYC, we arrive at a lower limit on the recent SFR in the Carina Nebula of M☉ yr-1. If the Galactic SFR is a few M☉ yr-1 (Murray & Rahman, 2010; Robitaille & Whitney, 2010), then the star formation activity of the entire Milky Way is equivalent to a few hundred Carina complexes.
5. Properties of the X-ray-Emitting YSO Population
The PCYC contains 410 X-ray-detected, predominantly intermediate-mass YSOs, including 62 Stage 0/I YSOs that are candidate X-ray-emitting protostars, the largest such sample compiled to date (Table 1). Because Herbig Ae/Be stars fall into an X-ray “desert” between low-mass T Tauri stars with convection-driven emission and OB stars with wind-driven emission, we expect that many of the PCYC sources are intrinsically X-ray quiet. This motivates us to assume the null hypothesis that X-ray emission apparently associated with intermediate-mass YSOs is generally produced by an unresolved low-mass, T Tauri binary companion (Stelzer et al., 2006; Evans et al., 2011). In such a scenario, the intermediate-mass primary is X-ray quiet but dominates the IR emission, and the physical properties derived from the IR SED modeling are expected to be uncorrelated with the presence of an X-ray-detected secondary. This null hypothesis can therefore be disproved if we observe statistically significant differences between the modeled properties of YSOs with X-ray counterparts and those without.
The detection of a faint X-ray source is highly dependent on location, because the sensitivity of the ACIS observations varies significantly across the CCCP field (Broos et al., 2011a). The sensitivity limit of the PCYC has a complicated positional dependence due to large spatial variations in extinction and nebulosity. Physical properties inferred from the IR modeling can range over orders of magnitude, and observed X-ray luminosity versus stellar mass (or versus ) relations have over an order of magnitude scatter (e.g. Preibisch et al., 2005). Potential correlations between properties derived independently from X-ray and IR observations are likely to be overwhelmed by severe noise. To avoid this problem, we divide the PCYC into CCCP-matched (PCYC-X) and unmatched (PCYC-U) subsamples and compare physical properties derived from SED fitting between these subsamples. The PCYC-U includes both YSOs that are intrinsically X-ray quiet and YSOs that happened to fall below the CCCP detection limit. There is likely to be substantial overlap in the physical parameters between these subsamples. Rather than attempt the potentially intractable task of correcting for the incredibly complicated, competing sensitivity variations between the X-ray and IR sample selections, we regard sample overlap as an inevitable, additional source of noise in our comparisons. At best, we might hope to discern some general, qualitative trends from the ensemble population, given the large sample size.
The YMF of the 410 YSOs in the PCYC-X (the X-YMF) is plotted in Figure 5. The intermediate-mass slope and power-law departure mass M☉ (Figure 5a) are consistent with the full PCYC YMF. This similarity is striking, given that we might have expected the X-YMF to skew toward lower-mass YSOs drawn from the T Tauri population. Instead, there appears to be a subtle trend in the opposite direction, with the M☉ mass range suppressed in the X-YMF. This trend is also apparent when the X-YMF is plotted by evolutionary stage (Figure 5b).
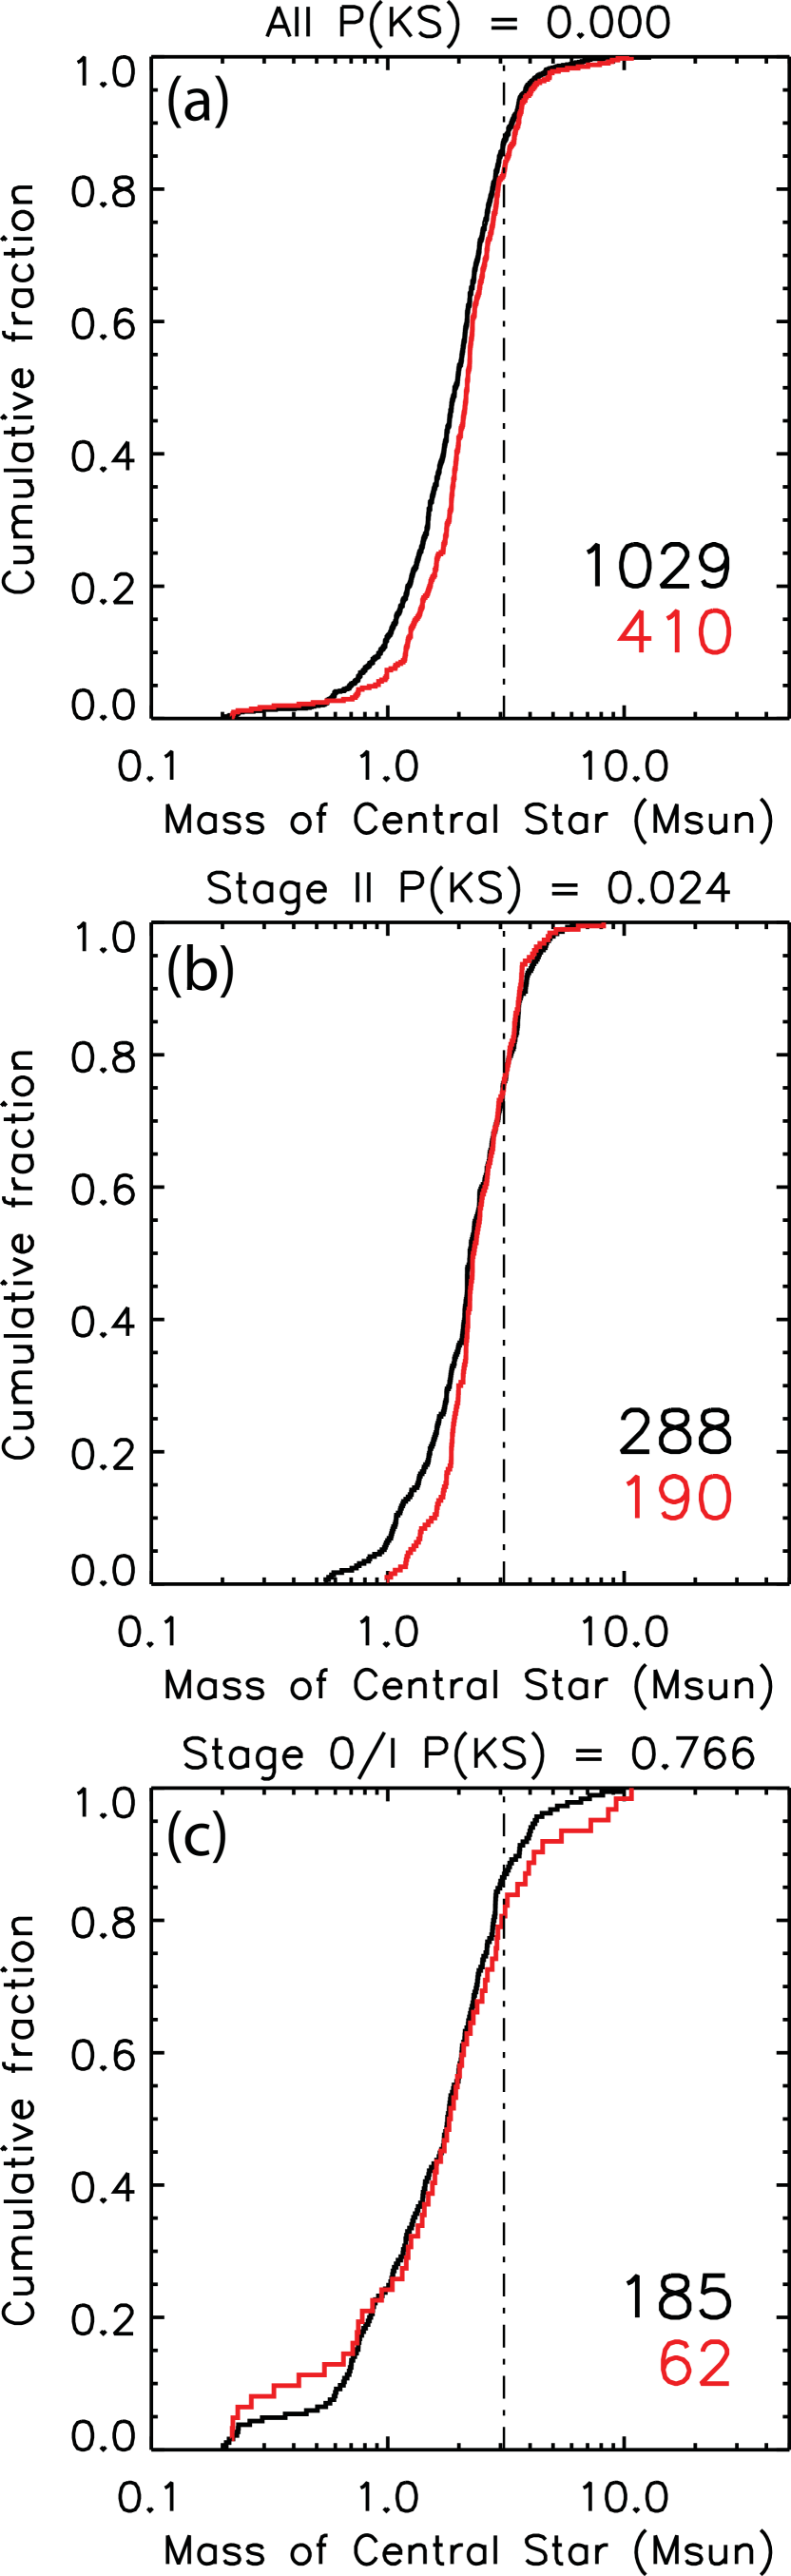
Differences between the PCYC-X and PCYC-U are easier to discern from the cumulative mass distributions (Figure 6), constructed from the characteristic for each YSO (column 4 of Table 3). Two curves are plotted in each panel, representing the PCYC-U and the PCYC-X (red) subsamples. The panel headers give the probability from a Kolmogorov–Smirnov (KS) test that the two curves are drawn from the same underlying distribution. Figure 6a shows that the PCYC-X as a whole includes a significantly lower fraction of sources with M☉. Figure 6b reveals that this difference is produced by the Stage II sources. Evidently the Vela–Carina Spitzer observations are more sensitive than the CCCP observations to low-mass, disk-bearing stars. A KS test shows no significant difference between the cumulative mass distributions of the two samples of Stage 0/I sources, although the two curves do appear to diverge for (Figure 6c).
5.1. Intermediate-Mass, Disk-Dominated YSOs with X-ray Counterparts
In Figure 6b the mass distributions of both the PCYC-X and PCYC-U samples appear to be very similar for M☉. In Figure 7 we present a comparison of 6 key YSO model parameters for the unambiguous Stage II YSOs in the intermediate-mass range M☉, equivalent to A through late B stars on the main sequence. The parameters plotted are stellar mass , bolometric luminosity (which includes luminosity derived from accretion), stellar temperature , normalized envelope accretion rate , disk mass , and total extinction to the stellar surface (defined as the sum of the contributions to extinction produced by dust along the line of sight and circumstellar dust ). The characteristic values of the stellar parameters , , ) were calculated using Equation (1), and the characteristic values of the circumstellar/environmental parameters were calculated using Equation (2).
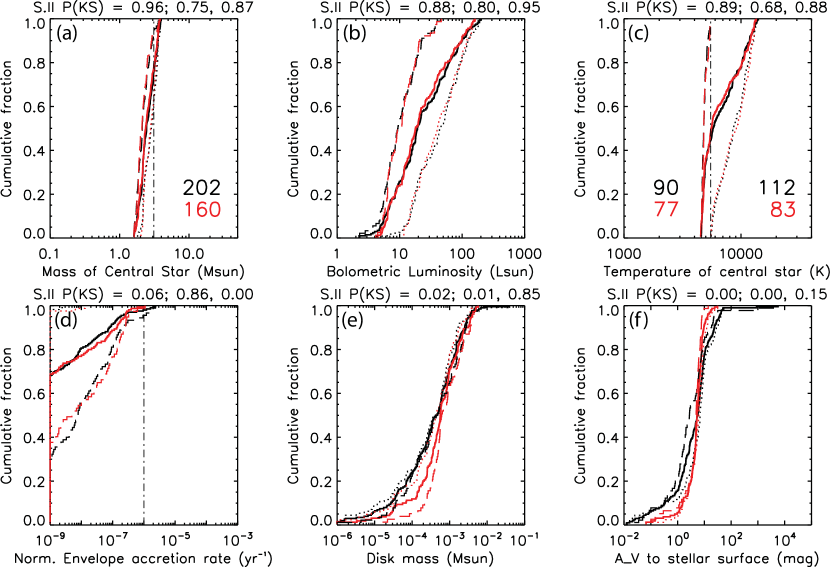
We further subdivide our intermediate-mass Stage II sample by stellar temperature, into sets with K (167 YSOs, 77 in the PCYC-X) and K (195 YSOs, 83 in the PCYC-X). We were motivated to make this division by the hypothesis that intermediate-mass stars with cooler photospheres are more likely to have convective atmospheres and perhaps generate X-rays by a mechanism analogous to that of lower-mass T Tauri stars (e.g. Stassun et al., 2004; Preibisch et al., 2005).
We find that none of the mass, luminosity, or temperature distributions (Figures 7abc) shows any significant correlations with the presence of X-ray emission. The normalized envelope accretion rates are low by definition for Stage II YSOs, and the distributions shown in Figure 7 confirm that these objects lack significant infalling envelopes. We do observe that the distribution functions for the low- division (dashed curves) have systematically lower luminosity and mass compared to the high- division, which is expected from PMS stellar evolutionary tracks.
There are no statistically significant differences in the cumulative distribution functions of the model parameters among the high- division that correlate with X-ray emission.444The one exception is normalized envelope accretion rate, in Figure 7d; however this is not a meaningful result because the envelope accretion rates are near zero in Stage II YSOs, and this parameter is not expected to be well constrained by the SED fitting. This result is consistent with our null hypothesis; we cannot rule out the possibility that X-ray emission associated with Stage II YSOs with K actually originates in unresolved, lower-mass T Tauri companions. In contrast, the distribution functions of and (Figures 7ef) definitively fail the KS test for the low- division and demonstrate that X-ray emission is not a completely random phenomenon among the intermediate-mass Stage II YSOs. PCYC-X sources are significantly underrepresented among YSOs with the lowest disk masses, M☉ (Figure 7e). We have uncovered a population of intermediate-mass PMS stars with massive disks and intrinsic X-ray emission, but the X-ray emission apparently dies off as the disks evolve. This result seems diametrically opposed to the observational paradigm in which X-ray luminosity from low-mass PMS stars increases as these objects evolve from classical T Tauri stars to weak-lined T Tauri stars (Preibisch et al., 2005; Telleschi et al., 2007), a transition that reflects the cessation of disk-fueled accretion that may suppress X-ray emission (Stassun et al., 2004).
The main result illustrated by Figure 7 is that disk mass correlates far more strongly with X-ray emission than any of the stellar parameters, demonstrating that rapid disk evolution provides a highly sensitive chronometer for intermediate-mass PMS stars. The apparent paradox with T Tauri X-ray emission is resolved when we recall that this trend is observed only among our carefully selected sub-division of intermediate-mass PMS stars with M☉ and K. These stars will presumably evolve into Herbig Ae/Be stars, at which point their X-ray brightness would fall below the CCCP detection limits (Stelzer et al., 2006; Broos et al., 2011a). At present, they are very young objects with relatively massive disks, still contracting toward the main sequence, and they have spectral types of G2 or later. They could thus be regarded as more massive, more luminous analogs of classical T Tauri stars.
A direct imprint of circumstellar disks on X-ray emission can be inferred from the distribution of total extinction (; Figure 7f). The top 5% of the PCYC-U reach absorptions up to times higher than the top 5% of the PCYC-X. These sources are probably high-inclination systems, where nearly edge-on disks completely absorb any X-ray emission along the sightline to the central stars.
5.2. Candidate X-ray-Emitting Protostars
The 62 unambiguous Stage 0/I YSOs in the PCYC-X subsample are presented in Table 4, which lists values for some of the YSO model parameters along with 3 observed X-ray quantities; total-band (0.5–8 keV) net counts, median energy (), and energy flux (). As Figure 6c shows, the mass distributions of Stage 0/I YSOs are very similar between the PCYC-X and PCYC-U subsamples for . To investigate which properties other than mass may correlate with X-ray emission from protostars, in Figure 8 we present distribution functions comparing the same 6 YSO model parameters used to analyze the intermediate-mass Stage II population (Figure 7), this time plotting the unambiguous Stage 0/I YSOs with M☉.
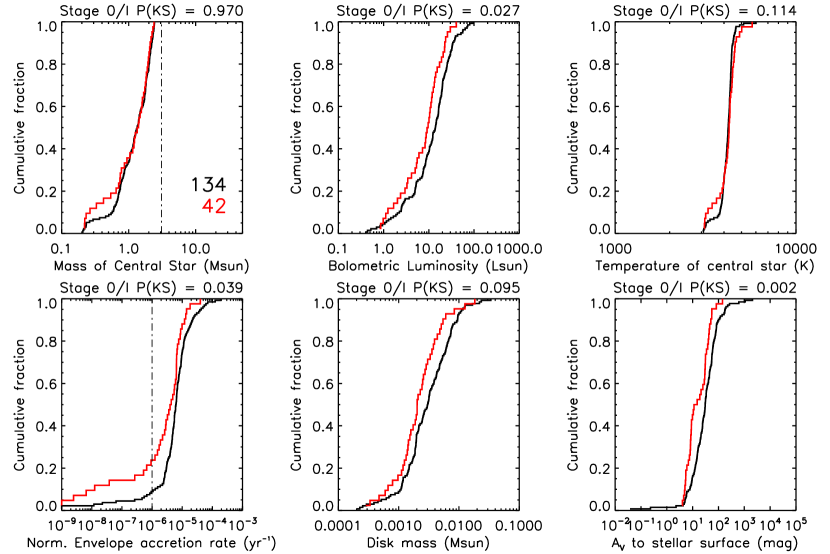
KS tests reveal that the mass distributions for these low-mass Stage 0/I YSOs are statistically the same between the PCYC-X and PCYC-U (Figure 8a), yet the luminosity distributions are significantly different, with the X-ray emitters systematically preferring lower values of (Figure 8b). Hence we may deduce that X-ray detected Stage 0/I YSOs are less luminous for a given stellar mass. Furthermore, both the normalized envelope accretion rates and total absorption (columns 6 and 7 of Table 4) show parameter distributions skewed to significantly lower values for the X-ray emitters, while is marginally higher for the X-ray emitters. As protostars contract, they become hotter and less luminous, their accretion rates slow, and outflow-carved, bipolar cavities grow in their envelopes, reducing the obscuration to the central star. Taken together, the distributions shown in Figure 8 demonstrate that brighter X-ray emission correlates with more evolved Stage 0/I YSOs.
Previous identifications of candidate X-ray emitting Class 0/I YSOs in nearby star formation regions have observed characteristically hard X-ray spectra, with keV (Getman et al., 2007; Prisinzano et al., 2008). X-ray spectra observed from embedded protostars are expected to be hard because soft X-rays are preferentially absorbed both by the dense circumstellar envelopes and the surrounding dense molecular cloud cores (Getman et al., 2007). About half (26/62) of our sample of candidate X-ray emitting Stage 0/I YSOs have hard X-ray counterparts in the CCCP catalog ( keV); these objects are high-probability candidate X-ray emitting protostars, grouped together in Table 4. The remaining Stage 0/I YSOs in Table 4 are matched to soft X-ray sources, more consistent with expectations for Class II/III objects (Preibisch et al., 2005; Prisinzano et al., 2008). YSOs in this latter group may be in transition between the envelope-dominated and disk-dominated phases. Many of them would not have been selected as Class 0/I objects by the conservative mid-IR empirical criteria of Prisinzano et al. (2008), for example. The model-based Stage 0/I classification, however, indicates that the YSOs in Table 4 are still very young (they possess envelopes); whether or not they are identified as “candidate protostars” is primarily a semantic choice. As expected, the IR SED modeling indicates that the soft X-ray group is less embedded than the hard X-ray group, with median mag compared to 30 mag (column 7 of Table 4). Recalling that most YSOs in the Carina Nebula are found outside of dense molecular clouds (§4.1), the typical absorption may also be less than expected from observations of YSOs in other star-forming molecular clouds that have not been disrupted by feedback from extremely massive stars.
6. Butterfly Collection: Intriguing YSO Sub-Clusters
In this section, we identify and briefly discuss YSOs found in candidate embedded sub-clusters in the CCCP field. These YSOs are highlighted, with their group membership identified, in Tables 2 and 3. There are a few caveats to remember. The properties of individual YSOs may not be well-constrained by the RW06 models. Sources might be multiple or otherwise confused in our multiwavelength datasets, and apparent spatial matches between CCCP sources and Vela–Carina sources do not guarantee physical association. We believe that these clusters are sufficiently interesting individual “butterflies” among the larger stellar population in the Carina complex to merit targeted follow-up multiwavelength observations that would provide higher spatial resolution, wider wavelength coverage, and/or spectroscopy.
6.1. A Perfectly Ordinary Stage 0/I YSO Associated with an Extraordinary Obscured X-ray Cluster
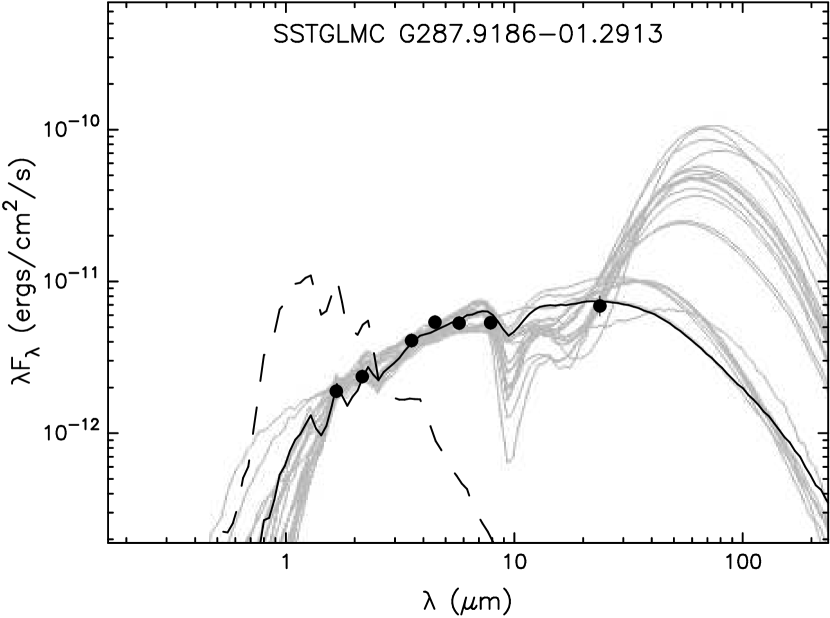
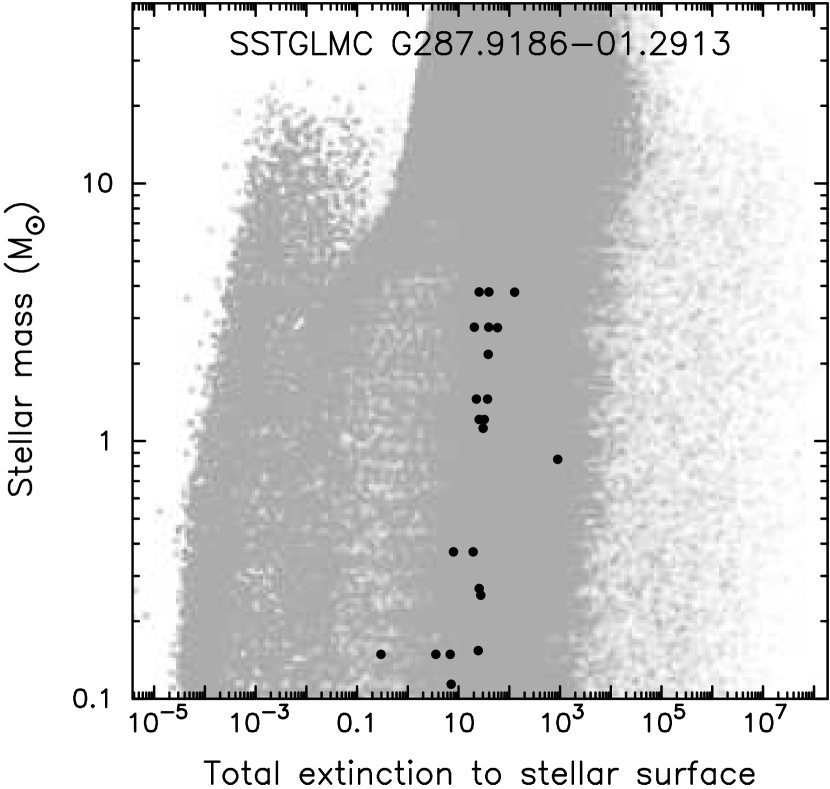
Townsley et al. (2011) report the discovery of a group of 4 X-ray sources in the South Pillars region that are remarkably luminous, hard, and highly-obscured. Three of these sources were matched to a single Vela–Carina Catalog source, G287.9186-01.2913 (Broos et al., 2011a), or PCYC source 699 (Tables 2–4). The primary CCCP match to PCYC 699 is CXOGNC J104451.91-602511.9, the brightest ( erg cm-2 s-1) and second-hardest ( keV) X-ray source associated with any candidate protostar in the Carina Nebula (Table 4). This source is variable and spectacularly luminous in X-rays, with L☉, corrected for mag total absorption (Townsley et al., 2011). In stark contrast, there is nothing remarkable about PCYC 699, save perhaps for the fact that its physical parameters are more poorly constrained than usual. The RW06 model fits to the SED of PCYC 699 are plotted in Figure 9 along with a parameter plot showing versus for each fit. A degeneracy in the long-wavelength SED beyond 24 m, where we have no data, produces 2 distinct families of model fits (Figure 9): intermediate-mass YSOs with relatively high circumstellar extinction and low-mass YSOs with lower circumstellar extinction. The model fits corresponding to the highest extinction are consistent with the absorption of the X-ray source, but even taking into account the wide range of stellar mass and luminosity allowed by the model fits, there is no interpretation that would allow PCYC 699 to be considered a massive YSO. It is a relatively faint 24 m source, and, unlike the most luminous YSOs in the PCYC, it is neither an MSX source nor an IRAS source. Thus we are left with a mystery surrounding the origin of the bright X-ray emission. The X-ray properties indicate a luminous, obscured, compact massive star cluster, but there is no commensurate IR emission.
6.2. Five Prominent YSO Sub-Clusters or Groups
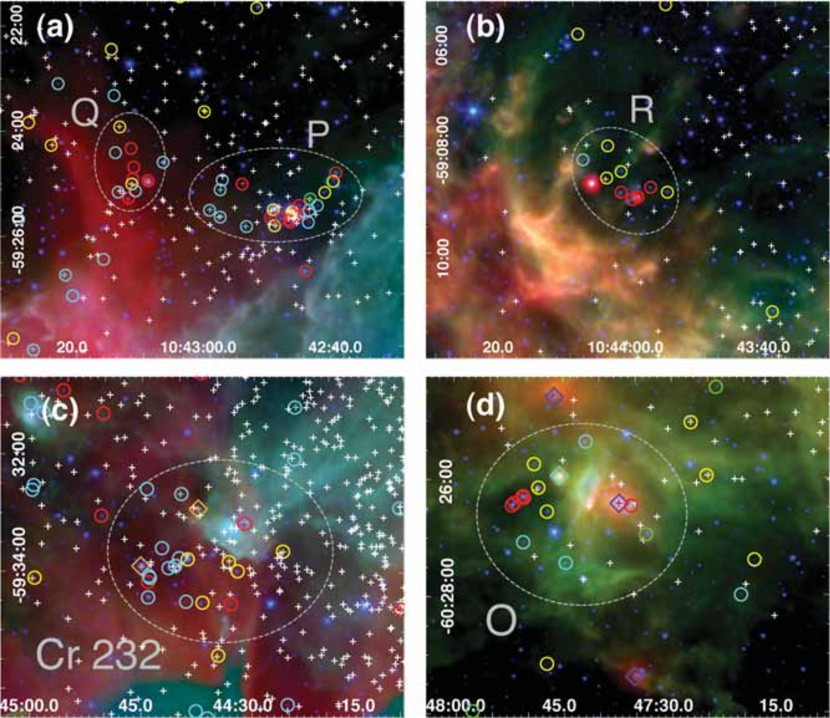
In Figure 10 we present Spitzer multicolor images zoomed in on 5 prominent YSO clusters, 3 of them new discoveries from the combined Spitzer/Vela–Carina and CCCP observations. Extending the nomenclature of the Spitzer clusters identified by SP10, we call the new clusters Spitzer P, Q, and R (Table 3).
Spitzer P and Q: . These two clusters appear in projection to be close neighbors (Figure 10a), located northwest of Tr 14. Both contain a high fraction of unambiguous Stage 0/I YSOs and show no sign of dynamical relaxation, suggesting extreme youth. The location of Spitzer P corresponds to a C18O core (Figure 1), and its dense center contains a concentration of X-ray sources (Group 4; F11). Spitzer Q was not designated an X-ray group by F11, although it also coincides with an enhanced density of X-ray sources (Figure 2). Possibly the most massive X-ray-emitting Stage 0/I YSO in the CCCP field is found in Spitzer Q. PCYC 179 is an extremely red Spitzer source, detected by MSX but not by 2MASS (Table 2), with L☉ and a very high envelope accretion rate, M☉ yr-1 (Table 3). The associated CCCP source is very hard, keV (Table 4). If the intrinsic X-ray emission is the soft spectrum produced by a normal massive stellar wind (Lucy & White, 1980), then it must be very luminous, with the soft counts almost completely absorbed. Alternatively, a more exotic emission mechanism may produce in intrinsically hard X-ray spectrum, or the CCCP source is an unresolved, low-mass companion.
Spitzer R: . In the extreme northern corner of the CCCP field we have discovered another very young, tight grouping of YSOs called Spitzer R (Figure 10b). This cluster is roughly centered on a CO peak that was not detected as a C18O core by Yonekura et al. (2005, and see Figure 1), and it appears to be forming intermediate-mass stars but not massive stars. There is no associated X-ray cluster, but this may simply be a sensitivity effect given that Spitzer R lies close to the edge of the CCCP field and was observed far off-axis by ACIS, where the sensitivity is reduced (Broos et al., 2011a).
Cr 232: . Cr 232 is a well-known young massive cluster to the west of Tr 14, containing an O3.5 V((f)) star, HD 93250, and an O5 V star, HD 303311 (Smith, 2006a, and references therein). Cr 232 is a large X-ray cluster (F11) apparently centered near the end of a broad dust pillar oriented toward Car and Tr 16 (Figure 10c). Cr 232 is undoubtedly richer than the newly-discovered Spitzer YSO clusters. Its location suggests that its formation may have been triggered recently by feedback from the massive stars in Tr 16. Apparently in the middle of the dust pillar associated with Cr 232 we detect a candidate X-ray-emitting, highly-embedded, massive Stage 0/I YSO, PCYC 556 (Table 3), similar to PCYC 179 in Spitzer Q, but the associated X-ray source is fainter by 0.4 dex and has keV, placing it among the soft X-ray group in Table 4. PCYC 556 is among the reddest IRAC sources in the PCYC ( mag, mag; Table 2). This relatively soft X-ray emission apparently originating from an embedded massive star suggests a highly luminous, intrinsically soft X-ray spectrum, perhaps powered by shocks in a strong stellar wind or accretion flow. Alternatively, the CCCP source may actually be a less obscured star that happens to be confused with the bright IRAC source.
Spitzer O: . Identified recently by SP10, Spitzer O, located in the extreme southeast corner of the South Pillars, is a far outpost of massive star formation in the Carina complex (Figure 10d). The cluster is associated with the southern of two C18O cores in the molecular cloud known as the Giant Pillar (Figure 1). Although it is near the edge of the CCCP field, where the ACIS sensitivity is lower, Spitzer O is nevertheless associated with a surface density enhancement in the X-ray sources (Figure 2), which was not listed by F11 on account of its remote location. Spitzer O includes a small IR dark cloud that hosts one of the few examples of an EGO found in the Carina Nebula (SP10). This EGO appears to be associated with 4 Stage 0/I YSOs (Table 3) in a tight, linear grouping. Extending this line westward along the IR dark cloud (to the right in Figure 10d), we find a Stage II YSO and a candidate low-luminosity ultracompact H II region, suggesting a time-sequence of intermediate-mass star formation. Further to the west, Spitzer O also contains at least one massive star inside a compact H II region, identifiable as a small bubble outlined in 8 m emission containing diffuse 24 m emission from dust heated by the central ionizing source, most likely a late O-type star (P11). Two similar but slightly less bright H II regions, complete with their own ionizing stars, are visible to the north and south of cluster O. All 3 candidate OB stars in Figure 10d are detected in X-rays, and none appears to have been previously cataloged (P11).
7. Discussion
7.1. A Recent Star Formation History for the Carina Nebula
In §4.2, we derived a lower limit on the recent, global SFR in the Carina Nebula of M☉ yr-1, averaged over the past 2 Myr, traced by the IR excess sources included in the PCYC. Feedback from massive stellar winds and radiation has been invoked by many authors as the driver of ongoing star formation (e.g., Smith et al., 2000; Smith & Brooks, 2007, SP10). If triggering by massive stars is indeed the dominant mode of continuing star formation in GMCs that host energetic H II regions, we can assess its relative importance by comparing the present-day SFR to the historical SFR that produced the massive star clusters that ionize the Carina Nebula and provide the source of the feedback.
Smith & Brooks (2007) estimated a total stellar population of 5– stars down to the hydrogen-burning limit by extrapolating from the known O-type stars in Carina (Smith, 2006a). The relative rarity of O stars requires an enormous extrapolation over the IMF to reach the low-mass stars that contain the bulk of the mass (Kroupa, 2001). Measurements of the IMF among low-mass stellar populations (from the Galactic field and open clusters) and high-mass stellar populations (from very massive Galactic and extragalactic clusters) have generally found slopes consistent with the Salpeter–Kroupa value, but region-to-region variations do exist (Bastian et al., 2010). Because very massive clusters with a well-populated upper IMF are located at such large distances that individual low-mass stars generally cannot be resolved, there has been no simultaneous, self-consistent measurement of the IMF from solar-mass stars to the most massive stars. Compounding the problem, theoretical calibrations of the masses of O stars encounter a factor of discrepancy between “spectroscopic” masses derived from surface gravity and “evolutionary” masses expected from stellar structure (Martins et al., 2005; Weidner & Vink, 2010). Finally, in the specific case of the Carina Nebula the completeness of the sample of known O stars (Smith, 2006a) may be as low as 50% (P11).
The CCCP X-ray catalog itself offers an independent measure of the total stellar population. The X-ray luminosity function (XLF) has proven to be a reliable tracer of the IMF (Getman et al., 2006) that is most sensitive to low- and intermediate-mass PMS stars. F11 scale the XLF from the Chandra Orion Ultradeep Project (COUP; Feigelson et al., 2005), for which the underlying IMF is well-characterized (Muench et al., 2002), to the XLFs from 4 distinct broad spatial regions within the CCCP and predict a total population of stars above the brown dwarf mass limit. Because X-ray detection efficiencies are lower for YSOs versus diskless PMS stars (Preibisch et al., 2005) and for heavily obscured versus lightly obscured stars (e.g. Figure 3 in Feigelson et al., 2005), the simple XLF scaling analysis implicitly assumes that any differences in the global disk fractions or the distributions of X-ray absorption between COUP and CCCP are negligible.
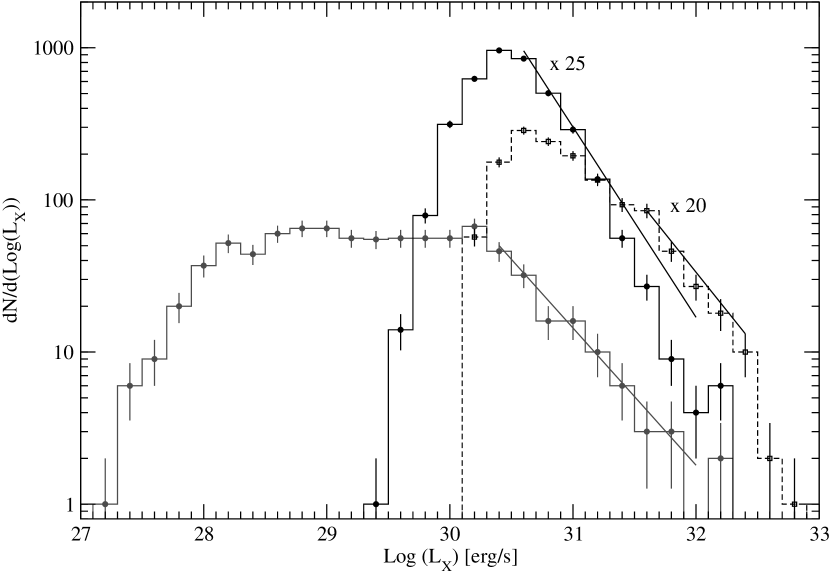
In Figure 11 we present a more detailed analysis of the CCCP XLF. Two XLFs, separated according to median energy into lightly-obscured ( keV) and heavily-obscured ( keV) samples, were constructed using all CCCP sources identified as cluster members that were sufficiently bright to enable the derivation of absorption-corrected luminosities (Getman et al., 2010; Broos et al., 2011b). The 410 CCCP sources matched to YSOs in the PCYC were excluded, as were X-ray detected known or candidate OB stars (P11). The resulting XLFs (Figure 11) are clean samples of diskless PMS stars that can be more directly compared to the 839 lightly obscured stars in the COUP XLF, the vast majority of which lack circumstellar disks (Feigelson et al., 2005). The scale factors between the COUP and CCCP XLFs are 25 and 20, for the lightly and heavily obscured samples, respectively, giving a total of diskless CCCP cluster members with masses M☉. This result is a lower limit due to the assumption that sources for which could not be obtained actually have values below the XLF turnoffs at and 31.6 for the lightly and heavily obscured samples, respectively (Figure 11).
Combining diskless stars traced by the XLF (Figure 11) with disk-bearing YSOs predicted by the YMF (Figure 3) gives young stars for the global Carina Nebula population, in agreement with the estimates of F11 and Smith & Brooks (2007). The total stellar mass is 4.9– M☉ (the upper bound is computed using the XLF scaling analysis from F11). Because the large majority of CCCP sources classified as likely Carina members (Broos et al., 2011b) are associated with the clustered stellar population (F11), we deduce that the age spread represented by the global XLF is similar to the Myr age spreads measured for the major ionizing clusters (Wang et al., 2011; Wolk et al., 2011, and references therein). The time-averaged global SFR has been 0.010–0.017 M☉ yr-1 over the past Myr.
The combined YMF and XLF results above lead straightforwardly to a global mid-IR excess fraction of among the Carina Nebula population. Compared to the commonly-used -excess fraction, this mid-IR excess fraction is much closer to the astrophysical fraction of stars with inner disks. YSOs dominated by circumstellar disks or envelopes do not separate cleanly from reddened, diskless stars in color-color diagrams (Whitney et al., 2003, RW06). Applying the -excess selection criteria of Preibisch et al. (2011) to the PCYC sources detected in 2MASS (Table 2), we find that only 36% of mid-IR selected YSOs exhibit a excess. We thus predict a global excess fraction among the Carina Nebula population of . This result agrees very well with the % global -excess fraction reported by Preibisch et al. (2011) from deep imaging of the CCCP stellar population, considering that the X-ray detection frequency is expected to be lower for YSOs than for diskless PMS stars. We note that the stellar population in the Carina Nebula is far from coeval, hence large variations from the global average mid-IR excess fraction are expected among different sub-populations, for example the relatively old Tr 15 cluster (Feinstein et al., 1980) has a very low disk fraction (see Figure 2 and also Wang et al., 2011) while the very young Treasure Chest cluster may have a disk fraction near (Smith et al., 2005). The disk fraction also decreases as a function of increasing stellar mass (PW10); the global value is dominated by the numerous low-mass stars, while the OB stellar population generally exhibits a low frequency of marginal mid-IR excess emission that likely is not indicative of circumstellar disks (P11).
In the South Pillars region, SP10 observed a general pattern of YSOs distributed spatially in the cavities between the ends of pillars and the ionizing stars and concluded that when star formation is triggered by feedback from massive stars, YSOs are left in the wake of retreating, evaporating pillars and molecular cloud surfaces eroded by advancing ionization fronts. Just over 50% of the YSOs in the PCYC are located in the South Pillars field presented by SP10 (Figures 1 and 2). The wide-field coverage of the Vela–Carina survey allows us to generalize this picture of ongoing, potentially feedback-driven star formation beyond the South Pillars to the entire Carina Nebula. If triggering were indeed the dominant mode for ongoing star formation, then the high present-day SFR in the Carina Nebula would demonstrate that feedback can provide the mechanism for sustaining and propagating star formation throughout a GMC complex.
We caution, however, that while most of the active star formation has migrated outward (Smith & Brooks, 2007), making a clear division between a triggered YSO population and the OB stars that provide the trigger would be an oversimplification. The large concentrations of YSOs associated with the central, massive Tr 16 and Tr 14 clusters (Figures 1 and 2) indicate that these clusters are hotbeds of recent star formation; they are still being built. In contrast, the older Tr 15 and Bochum 11 clusters, both located in the outer regions of the Carina Nebula, have no associated YSO sub-clusters even though both are obvious X-ray star clusters (Figure 2). The Carina Nebula is famous for its evolved super-massive stellar population, Car being the capstone, but the numerous OB stars apparently associated with compact clusters or groups of YSOs (Figure 10, and see also Figure 5 of P11) could be as young as a few yr, especially considering that the intense winds and radiation fields of massive stars likely destroy their natal envelopes over very short timescales compared to the disk lifetimes of lower-mass stars (Hollenbach et al., 1994).
The triggered star formation hypothesis is very difficult to test in a region as complicated as Carina; proof would require additional information beyond the observed correlation between YSOs and ionization fronts to establish a causal relationship that the ongoing star formation could not have occurred in the absence of a triggering mechanism provided by the massive stars. High-resolution interferometric radio or sub-mm detections of dense, massive, molecular cores that lack active star formation and remain protected from external radiation fields within the Carina molecular clouds could provide such evidence.
An alternate hypothesis of turbulence-driven, hierarchical fragmentation and collapse of the Carina GMC complex (Sabbi et al., 2007, and references therein) also appears consistent with currently available data. This idea could explain the cluster-of-clusters morphology of the Carina stellar populations and is supported by our results that a large, approximately coeval YSO population is widely distributed throughout the Carina complex and the present-day SFR is approximately the same as the time-averaged historical SFR. In this scenario, feedback from massive stars need not trigger star formation, but it could regulate star formation by rapidly sweeping the natal molecular cloud fragments away from young embedded clusters, revealing and even unbinding these YSO clusters (as suggested by SP10) over shorter timescales than expected from observations of more pristine molecular cloud environments such as M17 SWex (PW10).
In summary, the global star formation history of the Carina GMC complex is characterized by an approximately constant SFR of 0.010–0.017 M☉ yr-1 over the past Myr, perhaps set in motion by the hierarchical collapse and fragmentation of the GMC into a cluster of clusters. This average SFR has been punctuated by intense bursts of massive star formation. The largest burst produced the super-massive stellar population in Tr 16, including Car, about 3–4 Myr ago (e.g. DeGioia-Eastwood et al., 2001; Wolk et al., 2011), followed by a second burst that formed the very massive stellar population in the core of the Tr 14 cluster, perhaps as recently as 0.5 Myr ago (Sana et al., 2010). Subsequent to the formation of the very massive ionizing clusters, the recent star formation history in the Carina Nebula has been driven or at least regulated by feedback from the massive stars.
7.2. The Production of X-rays by Intermediate-Mass PMS Stars
Our comparative study in §5 between the subpopulations of the PCYC with and without X-ray matches in the CCCP catalog (Broos et al., 2011a) reveals some qualitative trends that provide clues into the origin of X-ray emission in intermediate-mass PMS stars. Across the –10 M☉ mass range sampled by the PCYC (Figure 5), X-ray emission appears to be activated during the protostellar evolutionary phase, and this emission becomes more readily detectable in relatively evolved Stage 0/I objects for which the absorption to the central star is reduced. It is well-established that the X-ray luminosity of low-mass, T Tauri stars increases as they evolve from disk-dominated (Stage/Class II) to diskless (Class III) PMS stars (Stassun et al., 2004; Telleschi et al., 2007; Prisinzano et al., 2008). In stark contrast, we find that intermediate-mass, disk-bearing YSOs continue to produce X-rays as they evolve beyond the Stage 0/I phase, but this emission fades away as the circumstellar disks evolve and the central stars pass through a Herbig Ae/Be phase during their approach to the main sequence.
X-ray detections of intermediate-mass, disk-dominated YSOs in the mass range 1.6–4 M☉ are correlated with higher disk mass only for stars with cool photospheric temperatures (Figure 7). Although these stars will arrive on the main sequence as A and B stars with K and fully radiative envelopes, currently they have K and spectral types later than G2. During their early PMS evolution, intermediate-mass stars can thus be regarded, in terms of their stellar structure and surface temperatures, as more luminous analogs of classical T Tauri stars, complete with convective envelopes. We therefore suggest that X-ray emission from intermediate-mass YSOs originates in a scaled-up version of the mechanism powering X-rays from T Tauri stars; convection-driven magnetic reconnection activity (Stassun et al., 2004; Preibisch et al., 2005). Because intermediate-mass stars reach the main sequence within a few Myr (Siess et al., 2000), this emission mechanism is available for only a short time compared to low-mass PMS stars. The rapid fading of X-ray emission coincides with the rapid dissipation of the circumstellar disk as the temperature of the central star rises.
This rapidly fading dynamo hypothesis can also explain a puzzling feature of the CCCP XLF. The slope of the lightly-obscured CCCP XLF, fitted with a power-law function using the method of Maschberger & Kroupa (2009), is , significantly steeper than the slopes of both the the comparison lightly-obscured COUP XLF () and the heavily-obscured CCCP XLF (; Figure 11). If the lightly-obscured CCCP XLF traces an older stellar population compared to either the COUP or the heavily-obscured CCCP XLFs, then a relatively rapid decay in among the more luminous, intermediate-mass stars would steepen the observed XLF slope, just as mass-dependent circumstellar disk evolution steepens the observed YMF slope (Figure 3). A similar deficit of stars with steepens the observed XLF slope of the Tr 15 cluster (Wang et al., 2011). With an age Myr, Tr 15 represents a significantly older stellar population compared to either the ONC or the other massive clusters in the Carina Nebula.
8. Conclusions
We have used the Spitzer Vela–Carina point-source lists, in combination with complementary IR datasets, to carry out an unbiased search for YSOs with IR excess emission throughout the Carina Nebula. We produce a Pan-Carina YSO Catalog (PCYC) of 1439 highly-reliable candidate YSOs, 410 of which have X-ray counterparts from the CCCP catalog. The PCYC comprises one of the largest samples of intermediate-mass YSOs in a single massive star-forming complex compiled to date, and it is the largest such collection with a complete set of complementary X-ray observations. From our initial analysis of this rich dataset, we can draw the following conclusions:
-
•
The mass function (YMF) of the Carina YSOs exhibits a power-law slope , significantly steeper than the Salpeter–Kroupa IMF. Such a steep slope, first observed for the YSO population of the M17 SWex IR dark cloud, is at least partially the result of an observational selection effect caused by rapid disk evolution among intermediate-mass YSOs (PW10). M17 SWex and Carina are very different environments; the former is a cold, IR dark cloud apparently experiencing its first wave of star formation while the latter is an evolved H II region powered by some of the most massive stars in the Galaxy. While the YMF slopes are similar, the lower critical mass of the PCYC sample, below which the YMF may agree with a normal Salpeter–Kroupa IMF, likely reflects a larger age spread among the YSOs in the Carina Nebula.
-
•
The time-averaged global SFR in the Carina complex has been 0.010–0.017 Msun yr-1 over the past Myr, punctuated by intense bursts of activity that produced the very massive stellar populations in the Tr 16 and Tr 14 clusters. If the present-day Galactic SFR is a few M☉ yr-1, then the star formation activity of the entire Milky Way is equivalent to a few hundred Carina complexes. The cluster-of-clusters pattern of star formation in the Carina Nebula is consistent with hierarchical fragmentation and collapse of a GMC complex (Sabbi et al., 2007).
-
•
The present-day global star formation rate in the Carina Complex is M☉ yr-1. The massive central ionizing clusters Tr 16 and Tr 14 still host intense concentrations of ongoing star formation. Ongoing star formation activity is distributed widely throughout Carina, driven or regulated by feedback from the massive stellar population, which acts to quickly reveal and even unbind young, embedded clusters (SP10).
-
•
The PCYC includes 62 candidate X-ray-emitting Stage 0/I YSOs, a sample large enough to provide statistical evidence that X-ray detections correlate with more evolved protostars. Our results support previous findings that the physical mechanism producing X-rays in PMS stars is activated during the protostellar evolutionary phase, and circumstellar material contributes significantly to the absorption of X-rays from the youngest YSOs (Getman et al., 2007; Prisinzano et al., 2008).
-
•
The apparent X-ray emission from intermediate-mass YSOs is usually consistent with the presence of unresolved, low-mass companions. But we also isolate a class of intermediate-mass Stage II YSOs with cooler photospheres and relatively massive circumstellar disks for which the X-ray emission appears to be intrinsic. We suggest that the progenitors of Herbig Ae/Be stars produce X-rays during their early PMS evolution, perhaps powered by magnetic reconnection activity during a convective atmosphere phase, but this mechanism decays as the stars approach the main sequence. A rapid fading of the stellar dynamo could thus act to steepen observed XLF slopes as a function of increasing cluster age (Wang et al., 2011).
-
•
We identify 3 new very young, tight YSO sub-clusters in the northwestern region of the Carina Nebula, 2 of which are associated with significant concentrations of X-ray sources (F11).
The full PCYC dataset is available in the electronic versions of Tables 2 and 3. We hope that this catalog will serve as a valuable database for future multiwavelength observations and modeling of star formation in the Carina Complex.
References
- Ascenso et al. (2007) Ascenso, J., Alves, J., Vicente, S., & Lago, M. T. V. T. 2007, A&A, 476, 199
- Bastian et al. (2010) Bastian, N., Covey, K. R., & Meyer, M. R. 2010, ARA&A, 48, 339
- Benjamin et al. (2003) Benjamin, R.A. et al. 2003, PASP, 115, 953
- Broos et al. (2011a) Broos, P. S. et al. 2011a, ApJS, in press (CCCP Catalog Paper)
- Broos et al. (2011b) Broos, P. S. et al. 2011b, ApJS, in press (CCCP Classifier Paper)
- Carey et al. (2009) Carey, S. J. et al. 2009, PASP, 121, 76
- Castelli & Kurucz (2004) Castelli, F., & Kurucz, R. L. 2004, arXiv:astro-ph/0405087
- Cyganowski et al. (2008) Cyganowski, C. J. et al. 2008, AJ, 136, 2391
- DeGioia-Eastwood et al. (2001) DeGioia-Eastwood, K., Throop, H., Walker, G., & Cudworth, K. M. 2001, ApJ, 549, 578
- Evans et al. (2011) Evans, N. R. 2011, ApJS, in press (CCCP Tr16 B Stars Paper)
- Fazio et al. (2004) Fazio, G. G. et al. 2004, ApJS, 154, 10
- Flaherty et al. (2007) Flaherty, K. M. et al. 2007, ApJ, 663, 1069
- Feigelson et al. (2005) Feigelson, E. D., et al. 2005, ApJS, 160, 379
- Feigelson et al. (2011) Feigelson, E. D. et al. 2011, ApJS, in press (CCCP clustering paper; F11)
- Feinstein et al. (1980) Feinstein, A., Moffat, A. F. J., & Fitzgerald, M. P. 1980, AJ, 85, 708
- Feldmeier et al. (1997) Feldmeier, A., Puls, J., & Pauldrach, A. W. A. 1997, A&A, 322, 878
- Garmire et al. (2003) Garmire, G. P., Bautz, M. W., Ford, P. G., Nousek, J. A., & Ricker, G. R., Jr. 2003, SPIE, 4851, 28
- Grabelsky et al. (1988) Grabelsky, D. A., Cohen, R. S., Bronfman, L., & Thaddeus, P. 1988, ApJ, 331, 181
- Getman et al. (2006) Getman, K. V., Feigelson, E. D., Townsley, L., Broos, P., Garmire, G., & Tsujimoto, M. 2006, ApJS, 163, 306
- Getman et al. (2007) Getman, K. V., Feigelson, E. D., Garmire, G., Broos, P., & Wang, J. 2007, ApJ, 654, 316
- Getman et al. (2010) Getman, K. V., Feigelson, E. D., Broos, P. S., Townsley, L. K., & Garmire, G. P. 2010, ApJ, 708, 1760
- Haisch et al. (2001) Haisch, K. E., Lada, E. A., & Lada, C. J. 2001, AJ, 121, 2065
- Hernández et al. (2007) Hernández, J. et al. 2007, ApJ, 662, 1067
- Hollenbach et al. (1994) Hollenbach, D., Johnstone, D., Lizano, S., & Shu, F. 1994, ApJ, 428, 654
- Indebetouw et al. (2005) Indebetouw, R. et al. 2005, ApJ, 619, 931
- Indebetouw et al. (2007) Indebetouw, R. et al. 2007, ApJ, 666, 321
- Kang et al. (2009) Kang, M., Bieging, J. H., Povich, M. S., & Lee, Y. 2009, ApJ, 706, 83
- Koenig et al. (2008) Koenig, X. P., Allen, L. E., Gutermuth, R. A., Hora, J. L., Brunt, C. M., & Muzerolle, J. 2008, ApJ, 688, 1142
- Kroupa (2001) Kroupa, P. 2001, MNRAS, 322, 231
- Lucy & White (1980) Lucy, L. B., & White, R. L. 1980, ApJ, 241, 300
- Martins et al. (2005) Martins, F., Schaerer, D., & Hillier, D. J. 2005, A&A, 436, 1049
- Maschberger & Kroupa (2009) Maschberger, T., & Kroupa, P. 2009, MNRAS, 395, 931
- Massey & Johnson (1993) Massey, P. & Johnson, J. 1993, AJ, 105, 980
- McClure (2009) McClure, M. 2009, ApJ, 693, L81
- Megeath et al. (1996) Megeath, S. T., Cox, P., Bronfman, L., & Roelfsema, P. R. 1996, A&A, 305, 296
- Monnier & Millan-Gabet (2002) Monnier, J. D., & Millan-Gabet, R. 2002, ApJ, 579, 694
- Muench et al. (2000) Muench, A. A., Lada, E. A., 2000, ApJ, 533, 358
- Muench et al. (2002) Muench, A. A., Lada, E. A., Lada, C. J. & Alves, J. 2002, ApJ, 573, 366
- Murray & Rahman (2010) Murray, N. & Rahman, M. 2010, ApJ, 709, 424
- Povich et al. (2009) Povich, M. S. et al. 2009, ApJ, 696, 1278
- Povich & Whitney (2010) Povich, M. S. & Whitney, B. A. 2010, ApJ, 714, L285 (PW10)
- Povich et al. (2011) Povich, M. S. et al. 2011, ApJS, in press (CCCP Massive Stars Candidates Paper; P11)
- Preibisch et al. (2005) Preibisch, T. et al. 2005, ApJS, 160, 401
- Preibisch et al. (2011) Preibisch, T. et al. 2011, ApJS, in press (CCCP Hawk-I paper)
- Price et al. (2001) Price, S. D., Egan, M. P., Carey, S. J., Mizuno, D. R., & Kuchar, T. A. 2001, AJ, 121, 2842
- Prisinzano et al. (2008) Prisinzano, L. et al. 2008, ApJ, 677, 401
- Rathborne et al. (2004) Rathborne, J. M., Brooks, K. J., Burton, M. G., Cohen, M., & Bontemps, S. 2004, A&A, 418, 563
- Richer et al. (2000) Richer, J. S., Shepherd, D. S., Cabrit, S., Bachiller, R., & Churchwell, E. 2000, in Protostars and Planets IV, eds. V. Mannings, A. Boss, & S. Russell (Tucson: Univ. Arizona Press), 867
- Rieke et al. (2004) Rieke, G. H. et al. 2004, ApJS, 154, 25
- Robitaille et al. (2006) Robitaille, T. P., Whitney, B. A., Indebetouw, R., Wood, K., & Denzmore, P. 2006, ApJS, 167, 256 (RW06)
- Robitaille et al. (2007) Robitaille, T. P., Whitney, B. A., Indebetouw, R., & Wood, K. 2007, ApJS, 169, 328
- Robitaille et al. (2008) Robitaille, T. P. et al. 2008, AJ, 136, 2413
- Robitaille & Whitney (2010) Robitaille, T. P. & Whitney, B. A. 2010, ApJ, 710, L11
- Rosner et al. (1995) Rosner, R., Musielak, Z. E., Cattaneo, F., Moore, R. L., & Suess, S. T. 1995, ApJ, 442, L25
- Sabbi et al. (2007) Sabbi, E., et al. 2007, AJ, 133, 44
- Sana et al. (2010) Sana, H., Momany, Y., Gieles, M., Carraro, G., Beletsky, Y., Ivanov, V. D., de Silva, G., & James, G. 2010, A&A, 515, 26
- Shepherd et al. (2007) Shepherd, D. S. et al. 2007, ApJ, 669, 464
- Siess et al. (2000) Siess, L., Dufour, E., & Forestini, M. 2000, A&A, 358, 593
- Skrutskie et al. (2006) Skrutskie, M. F. et al. 2006, AJ, 131, 1163
- Smith et al. (2000) Smith, N., Egan, M. P., Carey, S., Price, S. D., Morse, J. A., & Price, Paul A. 2000, ApJ, 532, L145
- Smith et al. (2003) Smith, N., Bally, J., & Morse, J. A. 2003, ApJ, 587, L105
- Smith et al. (2005) Smith, N., Stassun, K. G., & Bally, J. 2005, AJ, 129, 888
- Smith (2006a) Smith, N. 2006a, MNRAS, 367, 763
- Smith (2006b) Smith, N. 2006b, ApJ, 644, 1151
- Smith & Brooks (2007) Smith, N., & Brooks, K. J. 2007, MNRAS, 379, 1279
- Smith & Brooks (2008) Smith, N., & Brooks, K. J. 2008, Handbook of Star Forming Regions, Volume II: The Southern Sky, ed. B. Reipurth, p.138
- Smith et al. (2010a) Smith, N., Bally, J., & Walborn, N. R. 2010a, MNRAS, 405, 1153
- Smith et al. (2010b) Smith, N. et al. 2010b, MNRAS, 406, 952 (SP10)
- Stassun et al. (2004) Stassun, K. G., Ardila, D. R., Barsony, M., Basri, G., & Mathieu, R. D. 2004, AJ, 127, 3537
- Stelzer et al. (2006) Stelzer, B., Huélamo, N., Micela, G., & Hubrig, S. 2006, A&A, 452, 1001
- Stetson (1987) Stetson, P. 1987, PASP, 99, 191
- Telleschi et al. (2007) Telleschi, A., Güdel, M., Briggs, K. R., Audard, M., & Palla, F., 2007, A&A, 468, 425
- Townsley et al. (2011) Townsley, L. K. et al. 2011, ApJS, in press (CCCP Intro Paper)
- Wang et al. (2011) Wang, J. et al. 2011, ApJS, in press (CCCP Tr15 Paper)
- Wolk et al. (2011) Wolk, S. J. et al. ApJS, in press (CCCP Tr16 Paper)
- Weidner & Vink (2010) Weidner, C., & Vink, J. 2010, A&A, in press (arXiv:1010.2204)
- Weingartner & Draine (2001) Weingartner, J. C. & Draine, B. T. 2001, ApJ, 548, 296
- Whitney et al. (2003) Whitney, B. A., Wood, K., Bjorkman, J. E., & Cohen, M. 2003, ApJ, 598, 1079
- Whitney et al. (2008) Whitney, B. A. et al. 2008, AJ, 136, 18
- Yonekura et al. (2005) Yonekura, Y. et al. 2005, ApJ, 634, 476
- Zasowski et al. (2009) Zasowski, G., et al. 2009, ApJ, 707, 510
| (1) | (2) | (3) | (4) | (5) | (6) | (7) | (8) | (9) | (10) | (11) | (12) | (13)–(20) | (21) | |||||||
|---|---|---|---|---|---|---|---|---|---|---|---|---|---|---|---|---|---|---|---|---|
| PCYC | RA | Dec | [3.6] | [4.5] | [5.8] | [8.0] | [24] | Quality | ||||||||||||
| No. | (J2000) | (J2000) | SSTGLMbbSource names are preceded by either a “C” for the highly-reliable Vela–Carina Catalog or an “A” for the more-complete Archive. | (mag) | (mag) | (mag) | (mag) | (mag) | (mag) | (mag) | (mag) | FlagsccQuality flags are defined as follows: 0 = non-detection, 1 = detection, 2 = flux density lower limit (magnitude upper limit), and 3 = flux density upper limit (magnitude lower limit). | MSX? | |||||||
| 117 | 10 42 41.56 | -59 24 43.3 | C G287.2040-00.5300 | 14.5 | 13.2 | 10.7 | 10.0 | 9.3 | 8.8 | 4.3 | 0 | 1 | 1 | 1 | 1 | 1 | 1 | 3 | ||
| 118 | 10 42 41.91 | -59 24 52.7 | C G287.2059-00.5320 | 14.2 | 13.8 | 13.6 | 13.2 | 12.6 | 11.5 | 5.3 | 1 | 1 | 1 | 1 | 1 | 1 | 0 | 1 | ||
| 119 | 10 42 43.34 | -59 25 06.5 | C G287.2104-00.5339 | 14.6 | 13.7 | 12.4 | 11.9 | 11.4 | 10.2 | 6.0 | 0 | 1 | 1 | 1 | 1 | 1 | 1 | 3 | ||
| 122 | 10 42 44.22 | -59 25 20.8 | C G287.2139-00.5365 | 15.9 | 14.5 | 13.8 | 12.8 | 12.4 | 11.6 | 10.5 | 4.6 | 1 | 1 | 1 | 1 | 1 | 1 | 1 | 3 | |
| 124 | 10 42 45.36 | -59 25 25.9 | C G287.2167-00.5366 | 14.3 | 12.7 | 12.2 | 12.0 | 10.6 | 4.6 | 0 | 0 | 1 | 1 | 1 | 1 | 1 | 3 | |||
| 125 | 10 42 45.38 | -59 25 13.7 | C G287.2151-00.5336 | 15.4 | 14.0 | 13.2 | 12.1 | 11.6 | 11.4 | 10.2 | 4.4 | 1 | 1 | 1 | 1 | 1 | 1 | 1 | 3 | |
| 126 | 10 42 45.40 | -59 25 39.2 | C G287.2185-00.5399 | 13.2 | 12.5 | 11.8 | 10.8 | 4.8 | 0 | 0 | 0 | 1 | 1 | 1 | 1 | 3 | ||||
| 129 | 10 42 46.29 | -59 25 31.4 | C G287.2192-00.5370 | 13.7 | 11.7 | 10.8 | 10.3 | 3.0 | 0 | 0 | 0 | 1 | 1 | 1 | 1 | 1 | ||||
| 133 | 10 42 46.95 | -59 25 20.9 | C G287.2190-00.5338 | 15.0 | 13.8 | 12.2 | 11.3 | 2.9 | 0 | 0 | 1 | 1 | 1 | 1 | 0 | 1 | ||||
| 138 | 10 42 48.09 | -59 25 39.4 | C G287.2236-00.5372 | 14.1 | 13.2 | 12.2 | 11.7 | 11.3 | 10.5 | 2.8 | 0 | 1 | 1 | 1 | 1 | 1 | 1 | 1 | ||
| 139 | 10 42 48.14 | -59 25 29.0 | C G287.2223-00.5346 | 12.6 | 11.6 | 10.1 | 7.6 | 6.9 | 6.0 | 5.1 | 1 | 1 | 1 | 1 | 1 | 1 | 1 | 0 | ||
| 141 | 10 42 48.58 | -59 25 38.3 | C G287.2244-00.5364 | 14.4 | 12.1 | 11.3 | 10.6 | 10.0 | 3.0 | 0 | 0 | 1 | 1 | 1 | 1 | 1 | 1 | |||
| 144 | 10 42 49.74 | -59 25 36.5 | C G287.2263-00.5348 | 14.4 | 13.6 | 11.7 | 11.1 | 10.7 | 9.9 | 4.1 | 0 | 1 | 1 | 1 | 1 | 1 | 1 | 3 | ||
| 145 | 10 42 50.47 | -59 25 43.8 | C G287.2286-00.5359 | 15.6 | 13.5 | 11.8 | 9.8 | 9.1 | 8.5 | 7.7 | 4.1 | 1 | 1 | 1 | 1 | 1 | 1 | 1 | 3 | |
| 147 | 10 42 50.62 | -59 25 25.4 | C G287.2265-00.5312 | 14.4 | 11.6 | 9.5 | 7.4 | 6.7 | 6.1 | 5.1 | 2.0 | 1 | 1 | 1 | 1 | 1 | 1 | 1 | 1 | |
| 148 | 10 42 51.30 | -59 25 36.0 | C G287.2291-00.5331 | 15.7 | 14.7 | 14.0 | 13.3 | 12.6 | 11.6 | 10.3 | 4.5 | 1 | 1 | 1 | 1 | 1 | 1 | 1 | 3 | |
| 155 | 10 42 54.93 | -59 25 46.2 | C G287.2372-00.5320 | 15.6 | 14.2 | 13.3 | 12.4 | 12.0 | 11.7 | 10.6 | 5.1 | 1 | 1 | 1 | 1 | 1 | 1 | 1 | 3 | |
| 156 | 10 42 55.41 | -59 24 56.5 | C G287.2316-00.5194 | 16.6 | 15.4 | 14.4 | 12.8 | 12.3 | 11.6 | 10.9 | 4.5 | 1 | 1 | 1 | 1 | 1 | 1 | 1 | 3 | |
| 159 | 10 42 58.43 | -59 24 52.6 | C G287.2367-00.5154 | 14.8 | 13.3 | 12.7 | 12.1 | 12.2 | 11.7 | 11.2 | 4.6 | 1 | 1 | 1 | 1 | 1 | 1 | 1 | 3 | |
| 161 | 10 42 58.67 | -59 25 34.9 | C G287.2427-00.5255 | 13.2 | 12.3 | 11.5 | 10.8 | 4.5 | 0 | 0 | 0 | 1 | 1 | 1 | 1 | 3 | ||||
| 162 | 10 42 58.78 | -59 25 04.1 | C G287.2389-00.5178 | 12.6 | 12.0 | 11.3 | 10.0 | 4.7 | 0 | 0 | 0 | 1 | 1 | 1 | 1 | 3 | ||||
| 164 | 10 43 00.32 | -59 25 27.2 | C G287.2448-00.5220 | 16.0 | 14.7 | 13.7 | 12.2 | 11.8 | 11.5 | 10.7 | 4.4 | 1 | 1 | 1 | 1 | 1 | 1 | 1 | 3 | |
| 177 | 10 43 07.36 | -59 24 33.4 | C G287.2509-00.5017 | 15.8 | 13.9 | 12.5 | 10.8 | 10.3 | 9.9 | 9.4 | 4.8 | 1 | 1 | 1 | 1 | 1 | 1 | 1 | 3 | |
| 179 | 10 43 09.72 | -59 24 55.3 | C G287.2582-00.5047 | 11.3 | 9.0 | 7.0 | 5.9 | 2.2 | 0 | 0 | 0 | 1 | 1 | 1 | 1 | 1 | ✓ | |||
| 183 | 10 43 11.37 | -59 25 06.1 | C G287.2627-00.5057 | 15.7 | 14.3 | 13.8 | 12.7 | 12.4 | 11.8 | 11.2 | 4.9 | 1 | 1 | 1 | 1 | 1 | 1 | 1 | 3 | |
| 184 | 10 43 11.72 | -59 24 39.3 | C G287.2598-00.4988 | 14.8 | 12.9 | 11.8 | 10.9 | 5.5 | 0 | 0 | 0 | 1 | 1 | 1 | 1 | 3 | ||||
| 185 | 10 43 11.91 | -59 24 52.7 | C G287.2619-00.5019 | 13.7 | 12.4 | 11.6 | 11.0 | 4.9 | 0 | 0 | 0 | 1 | 1 | 1 | 1 | 3 | ||||
| 186 | 10 43 12.06 | -59 24 58.8 | C G287.2630-00.5032 | 15.3 | 13.9 | 13.2 | 12.0 | 11.6 | 10.9 | 10.2 | 4.8 | 1 | 1 | 1 | 1 | 1 | 1 | 1 | 3 | |
| 187 | 10 43 12.22 | -59 24 18.1 | C G287.2580-00.4931 | 13.6 | 12.6 | 11.6 | 10.4 | 3.7 | 0 | 0 | 0 | 1 | 1 | 1 | 1 | 3 | ||||
| 189 | 10 43 12.62 | -59 25 15.1 | C G287.2662-00.5067 | 16.1 | 14.7 | 12.6 | 12.1 | 11.8 | 11.3 | 3.6 | 1 | 1 | 0 | 1 | 1 | 1 | 1 | 3 | ||
| 192 | 10 43 14.00 | -59 23 53.8 | C G287.2581-00.4854 | 14.3 | 13.5 | 13.0 | 12.0 | 11.6 | 11.1 | 10.4 | 4.4 | 1 | 1 | 1 | 1 | 1 | 1 | 1 | 3 | |
| 194 | 10 43 14.24 | -59 25 09.0 | C G287.2684-00.5035 | 16.5 | 15.2 | 14.3 | 13.2 | 12.6 | 12.1 | 11.2 | 3.7 | 1 | 1 | 1 | 1 | 1 | 1 | 1 | 3 | |
| 197 | 10 43 14.66 | -59 24 23.4 | C G287.2632-00.4920 | 16.4 | 15.2 | 14.6 | 13.6 | 13.0 | 12.1 | 4.7 | 1 | 1 | 1 | 1 | 1 | 1 | 0 | 3 | ||
| 372 | 10 43 55.75 | -59 08 48.3 | C G287.2180-00.2216 | 13.0 | 12.1 | 11.4 | 10.6 | 6.5 | 0 | 0 | 0 | 1 | 1 | 1 | 1 | 3 | ||||
| 391 | 10 43 58.38 | -59 08 43.3 | C G287.2223-00.2178 | 14.6 | 13.5 | 12.1 | 11.2 | 10.4 | 5.6 | 0 | 0 | 1 | 1 | 1 | 1 | 1 | 3 | |||
| 400 | 10 44 00.23 | -59 08 54.3 | C G287.2272-00.2186 | 12.6 | 10.7 | 9.3 | 8.0 | 3.8 | 0 | 0 | 0 | 1 | 1 | 1 | 1 | 1 | ||||
| 407 | 10 44 00.85 | -59 08 56.3 | C G287.2287-00.2185 | 13.2 | 12.2 | 10.9 | 9.9 | 5.1 | 0 | 0 | 0 | 1 | 1 | 1 | 1 | 1 | ||||
| 416 | 10 44 02.55 | -59 08 24.5 | C G287.2277-00.2090 | 12.8 | 12.3 | 11.3 | 10.5 | 6.8 | 0 | 0 | 0 | 1 | 1 | 1 | 1 | 3 | ||||
| 417 | 10 44 02.77 | -59 08 49.4 | C G287.2314-00.2148 | 13.1 | 11.5 | 10.5 | 9.8 | 5.4 | 0 | 0 | 0 | 1 | 1 | 1 | 1 | 3 | ||||
| 426 | 10 44 04.89 | -59 07 56.5 | C G287.2285-00.1998 | 13.6 | 13.0 | 12.8 | 12.7 | 12.6 | 12.0 | 10.9 | 6.2 | 1 | 1 | 1 | 1 | 1 | 1 | 1 | 3 | |
| 428 | 10 44 04.96 | -59 08 33.3 | C G287.2334-00.2087 | 15.4 | 14.3 | 13.0 | 12.6 | 12.0 | 11.4 | 7.5 | 0 | 1 | 1 | 1 | 1 | 1 | 1 | 3 | ||
| 438 | 10 44 07.04 | -59 08 39.2 | C G287.2381-00.2081 | 14.1 | 12.6 | 10.6 | 9.4 | 7.9 | 6.6 | 2.5 | 0 | 1 | 1 | 1 | 1 | 1 | 1 | 1 | ||
| 442 | 10 44 08.12 | -59 08 11.2 | C G287.2365-00.2001 | 15.4 | 14.4 | 13.3 | 12.8 | 11.8 | 5.8 | 0 | 1 | 1 | 1 | 1 | 1 | 0 | 3 | |||
| 528 | 10 44 25.99 | -59 33 38.8 | C G287.4690-00.5571 | 13.6 | 13.0 | 12.6 | 11.9 | 11.6 | 11.4 | 10.8 | 1 | 1 | 1 | 1 | 1 | 1 | 1 | 0 | ||
| 556 | 10 44 31.11 | -59 33 10.1 | C G287.4748-00.5450 | 8.8 | 7.4 | 6.0 | 5.0 | 0 | 0 | 0 | 1 | 1 | 1 | 1 | 0 | |||||
| 563 | 10 44 32.21 | -59 33 59.6 | C G287.4833-00.5561 | 11.0 | 10.8 | 10.8 | 10.7 | 10.7 | 10.4 | 9.6 | 1 | 1 | 1 | 1 | 1 | 1 | 1 | 0 | ||
| 574 | 10 44 33.07 | -59 34 33.2 | C G287.4893-00.5635 | 13.6 | 13.6 | 11.4 | 10.0 | 0 | 0 | 0 | 1 | 1 | 1 | 1 | 0 | |||||
| 575 | 10 44 33.18 | -59 33 49.1 | C G287.4837-00.5526 | 13.4 | 12.1 | 11.3 | 10.1 | 9.7 | 9.3 | 8.7 | 1 | 1 | 1 | 1 | 1 | 1 | 1 | 0 | ||
| 600 | 10 44 37.01 | -59 34 32.5 | C G287.4965-00.5594 | 12.5 | 12.1 | 11.6 | 10.7 | 10.1 | 9.7 | 8.9 | 1 | 1 | 1 | 1 | 1 | 1 | 1 | 0 | ||
| 612 | 10 44 38.82 | -59 33 47.2 | C G287.4940-00.5465 | 12.0 | 10.9 | 8.1 | 7.6 | 7.2 | 6.5 | 1 | 1 | 0 | 1 | 1 | 1 | 1 | 0 | |||
| 616 | 10 44 39.01 | -59 34 30.6 | C G287.5000-00.5570 | 15.9 | 14.8 | 14.2 | 13.3 | 12.9 | 12.1 | 11.3 | 1 | 1 | 1 | 1 | 1 | 1 | 1 | 0 | ||
| 619 | 10 44 39.79 | -59 32 40.5 | C G287.4871-00.5292 | 14.7 | 13.9 | 13.6 | 12.9 | 12.4 | 11.6 | 10.3 | 1 | 1 | 1 | 1 | 1 | 1 | 1 | 0 | ||
| 621 | 10 44 40.03 | -59 33 46.5 | C G287.4962-00.5451 | 13.9 | 12.8 | 12.3 | 11.6 | 3.2 | 0 | 0 | 1 | 1 | 1 | 1 | 0 | 3 | ||||
| 625 | 10 44 40.56 | -59 33 54.3 | C G287.4982-00.5465 | 12.8 | 12.5 | 12.0 | 11.0 | 2.8 | 0 | 0 | 0 | 1 | 1 | 1 | 1 | 3 | ||||
| 634 | 10 44 41.46 | -59 33 56.4 | C G287.5001-00.5462 | 12.0 | 11.3 | 11.0 | 10.2 | 2.8 | 0 | 0 | 0 | 1 | 1 | 1 | 1 | 3 | ||||
| 642 | 10 44 42.23 | -59 33 35.6 | C G287.4989-00.5403 | 15.2 | 14.2 | 13.3 | 12.0 | 11.4 | 11.0 | 4.0 | 1 | 1 | 1 | 1 | 1 | 1 | 0 | 3 | ||
| 654 | 10 44 44.05 | -59 34 10.4 | C G287.5068-00.5470 | 13.7 | 12.8 | 11.7 | 10.4 | 2.3 | 0 | 0 | 0 | 1 | 1 | 1 | 1 | 3 | ||||
| 655 | 10 44 44.06 | -59 34 26.2 | C G287.5088-00.5509 | 15.1 | 13.1 | 11.7 | 10.2 | 9.3 | 8.4 | 7.4 | 1 | 1 | 1 | 1 | 1 | 1 | 1 | 0 | ||
| 656 | 10 44 44.09 | -59 34 07.2 | C G287.5064-00.5462 | 13.4 | 12.1 | 11.1 | 9.7 | 2.5 | 0 | 0 | 0 | 1 | 1 | 1 | 1 | 3 | ||||
| 657 | 10 44 44.23 | -59 34 05.1 | C G287.5064-00.5456 | 12.6 | 11.5 | 10.5 | 9.6 | 2.6 | 0 | 0 | 0 | 1 | 1 | 1 | 1 | 3 | ||||
| 660 | 10 44 44.41 | -59 32 35.3 | C G287.4951-00.5234 | 15.5 | 14.3 | 13.4 | 12.5 | 12.1 | 11.6 | 2.5 | 1 | 1 | 1 | 1 | 1 | 1 | 0 | 3 | ||
| 699 | 10 44 51.89 | -60 25 11.7 | C G287.9186-01.2913 | 15.0 | 14.0 | 11.9 | 10.9 | 10.1 | 9.1 | 5.3 | 0 | 1 | 1 | 1 | 1 | 1 | 1 | 1 | ||
| 1295 | 10 47 33.40 | -60 26 56.7 | C G288.2265-01.1635 | 11.5 | 11.2 | 11.0 | 10.8 | 10.8 | 10.5 | 10.1 | 4.5 | 1 | 1 | 1 | 1 | 1 | 1 | 1 | 3 | |
| 1297 | 10 47 35.69 | -60 26 28.5 | C G288.2271-01.1544 | 14.5 | 13.4 | 12.6 | 11.3 | 10.7 | 9.9 | 8.8 | 4.1 | 1 | 1 | 1 | 1 | 1 | 1 | 1 | 1 | |
| 1302 | 10 47 42.09 | -60 25 23.1 | C G288.2305-01.1322 | 16.3 | 14.8 | 13.7 | 11.3 | 11.0 | 10.3 | 9.5 | 4.9 | 1 | 1 | 1 | 1 | 1 | 1 | 1 | 3 | |
| 1304 | 10 47 44.89 | -60 27 26.9 | C G288.2514-01.1602 | 13.6 | 12.4 | 11.5 | 9.9 | 6.1 | 0 | 0 | 0 | 1 | 1 | 1 | 1 | 3 | ||||
| 1308 | 10 47 47.19 | -60 26 33.5 | C G288.2488-01.1448 | 14.5 | 12.2 | 11.5 | 10.9 | 9.9 | 5.3 | 0 | 0 | 1 | 1 | 1 | 1 | 1 | 3 | |||
| 1312 | 10 47 48.52 | -60 26 09.5 | C G288.2482-01.1376 | 14.4 | 12.7 | 10.4 | 9.7 | 9.1 | 8.3 | 5.1 | 0 | 1 | 1 | 1 | 1 | 1 | 1 | 1 | ||
| 1313 | 10 47 48.97 | -60 25 44.8 | C G288.2458-01.1311 | 14.2 | 12.7 | 12.2 | 11.4 | 10.3 | 7.4 | 0 | 0 | 1 | 1 | 1 | 1 | 1 | 3 | |||
| 1315 | 10 47 50.24 | -60 26 18.6 | C G288.2525-01.1383 | 13.6 | 12.3 | 11.0 | 9.9 | 9.2 | 4.3 | 0 | 0 | 1 | 1 | 1 | 1 | 1 | 1 | |||
| 1316 | 10 47 50.59 | -60 27 04.7 | C G288.2589-01.1494 | 16.1 | 14.0 | 12.2 | 12.2 | 11.8 | 10.8 | 6.0 | 1 | 1 | 0 | 1 | 1 | 1 | 1 | 3 | ||
| 1317 | 10 47 50.70 | -60 26 18.1 | C G288.2532-01.1377 | 12.8 | 10.8 | 9.5 | 8.6 | 4.5 | 0 | 0 | 0 | 1 | 1 | 1 | 1 | 1 | ||||
| 1319 | 10 47 51.67 | -60 26 23.9 | C G288.2557-01.1383 | 14.0 | 12.7 | 11.8 | 11.3 | 10.6 | 4.7 | 0 | 0 | 1 | 1 | 1 | 1 | 1 | 1 | |||
| 1320 | 10 47 52.07 | -60 26 27.0 | C G288.2569-01.1386 | 12.2 | 10.2 | 9.0 | 8.2 | 4.8 | 0 | 0 | 0 | 1 | 1 | 1 | 1 | 1 | ||||
Note. — This Table is available in its entirety in a machine-readable form in the online journal. A portion is reproduced here for guidance regarding its form and content and to highlight sources of interest. Sources are grouped according to their apparent association with the YSO sub-clusters discussed in §6.
| (1) | (2) | (3) | (4) | (5) | (6) | (7) | (8) | (9) | (10) | (11) | (12) |
|---|---|---|---|---|---|---|---|---|---|---|---|
| PCYC | CCCP Match | MembershipaaThe Membership columns follow F11. | |||||||||
| No. | (L☉) | (L☉) | (M☉) | (M☉) | (M☉ yr-1) | (M☉ yr-1) | Stage | CXOGNC J | Cl/Gr | Reg | NotesbbThe Notes column includes the following: O, P, Q, R, or Cr 232 refer to membership in the groups discussed in §6; 2X or 3X indicates that the Spitzer source was matched to 2 or 3 CCCP X-ray sources; and MSX means that the YSO is also an MSX source. |
| 117 | 1.9 | 0.2 | 3.4 | 1.1 | -4.8 | 1.9 | 0/I | D | P | ||
| 118 | 1.6 | 0.1 | 2.5 | 0.2 | II | D | P | ||||
| 119 | 1.3 | 0.9 | 1.9 | 0.9 | -7.1 | 2.5 | II | D | P | ||
| 122 | 1.2 | 0.9 | 1.3 | 1.1 | -7.3 | 2.2 | A | D | P | ||
| 124 | 1.8 | 0.7 | 2.7 | 1.0 | -6.3 | 2.3 | A | G4 | D | P | |
| 125 | 1.9 | 0.5 | 2.9 | 0.8 | III | 104245.34-592513.3 | D | P, 3X | |||
| 126 | 1.7 | 1.1 | 2.4 | 1.3 | -6.0 | 2.2 | A | G4 | D | P | |
| 129 | 2.6 | 0.2 | 6.4 | 1.0 | -4.0 | 0.8 | 0/I | G4 | D | P | |
| 133 | 2.3 | 0.4 | 4.0 | 1.3 | -4.2 | 1.8 | 0/I | G4 | D | P | |
| 138 | 2.0 | 0.1 | 3.1 | 0.7 | -4.5 | 0.3 | 0/I | 104248.10-592539.3 | G4 | D | P |
| 139 | 2.6 | 0.3 | 4.9 | 1.2 | -8.3 | 1.8 | II | 104248.17-592528.7 | G4 | D | P |
| 141 | 2.0 | 0.1 | 4.5 | 0.6 | -4.4 | 2.0 | 0/I | G4 | D | P | |
| 144 | 1.3 | 0.3 | 1.6 | 0.7 | -5.4 | 2.3 | 0/I | D | P | ||
| 145 | 2.9 | 1.7 | 4.4 | 1.9 | II | 104250.50-592544.2 | D | P | |||
| 147 | 3.1 | 0.1 | 6.5 | 0.4 | II | D | P | ||||
| 148 | 0.7 | 0.5 | 0.6 | 0.5 | -4.8 | 2.2 | 0/I | 104251.41-592535.6 | D | P | |
| 155 | 1.7 | 1.0 | 2.3 | 1.0 | -7.2 | 2.6 | A | 104254.93-592545.4 | D | P | |
| 156 | 0.9 | 0.6 | 1.0 | 0.7 | -5.4 | 2.4 | 0/I | 104255.40-592456.5 | D | P | |
| 159 | 0.9 | 0.4 | 1.6 | 0.9 | -6.5 | 2.6 | A | D | P | ||
| 161 | 1.7 | 1.0 | 2.4 | 1.3 | -5.3 | 2.1 | A | 104258.65-592534.4 | D | P | |
| 162 | 2.0 | 1.2 | 2.6 | 1.5 | A | 104258.78-592503.9 | D | P | |||
| 164 | 1.3 | 0.4 | 1.8 | 0.8 | A | 104300.29-592526.9 | D | P | |||
| 177 | 1.7 | 0.2 | 2.6 | 0.4 | A | 104307.37-592433.6 | D | Q | |||
| 179 | 3.6 | 0.0 | 10.1 | 0.9 | -2.6 | 0.2 | 0/I | 104309.83-592454.2 | D | Q, MSX | |
| 183 | 0.7 | 0.5 | 1.2 | 0.8 | -7.9 | 2.4 | A | D | Q | ||
| 184 | 1.8 | 1.1 | 1.7 | 1.6 | -5.4 | 2.0 | 0/I | D | Q | ||
| 185 | 1.8 | 0.6 | 2.7 | 1.5 | -5.2 | 2.0 | 0/I | D | Q | ||
| 186 | 1.1 | 0.2 | 2.0 | 0.8 | II | 104312.06-592458.5 | D | Q | |||
| 187 | 1.6 | 1.1 | 1.9 | 1.3 | -5.4 | 2.0 | 0/I | D | Q | ||
| 189 | 0.9 | 0.5 | 1.2 | 0.7 | -6.3 | 2.5 | 0/I | 104312.59-592516.2 | D | Q | |
| 192 | 1.2 | 0.3 | 2.1 | 0.5 | II | 104313.98-592353.0 | D | Q | |||
| 194 | 0.8 | 0.6 | 0.8 | 0.9 | -6.1 | 2.4 | A | D | Q | ||
| 197 | 1.0 | 0.7 | 1.0 | 0.9 | -5.9 | 2.3 | A | D | Q | ||
| 372 | 2.0 | 1.2 | 3.2 | 1.0 | II | D | R | ||||
| 391 | 1.0 | 0.1 | 1.1 | 0.4 | -5.1 | 2.4 | 0/I | D | R | ||
| 400 | 2.4 | 1.4 | 3.2 | 1.8 | -4.4 | 1.6 | 0/I | D | R | ||
| 407 | 1.5 | 1.0 | 1.4 | 1.5 | -5.1 | 2.0 | 0/I | D | R | ||
| 416 | 1.3 | 0.8 | 2.1 | 1.0 | II | D | R | ||||
| 417 | 2.2 | 1.3 | 3.3 | 1.4 | -5.9 | 1.8 | 0/I | D | R | ||
| 426 | 1.0 | 0.8 | 1.8 | 0.6 | -8.8 | 2.8 | II | D | R | ||
| 428 | 0.9 | 0.4 | 1.5 | 0.7 | -7.0 | 2.7 | II | 104404.95-590833.6 | D | R | |
| 438 | 2.1 | 0.3 | 2.8 | 1.1 | -3.8 | 1.5 | 0/I | D | R | ||
| 442 | 1.5 | 1.0 | 1.6 | 1.1 | -6.4 | 2.5 | A | D | R | ||
| 528 | 1.1 | 0.7 | 2.0 | 0.6 | -7.2 | 2.8 | II | 104425.97-593339.0 | C5 | A | Cr 232 |
| 556 | 3.6 | 2.0 | 9.0 | 3.2 | -4.0 | 1.5 | 0/I | 104431.23-593311.2 | C5 | A | Cr 232 |
| 563 | 1.7 | 0.0 | 3.7 | 0.2 | -8.0 | 3.0 | II | C5 | A | Cr 232 | |
| 574 | 2.1 | 1.2 | 3.2 | 2.1 | -4.4 | 1.6 | 0/I | C5 | A | Cr 232 | |
| 575 | 1.8 | 0.2 | 3.1 | 0.7 | -7.4 | 2.2 | II | 104433.23-593348.4 | C5 | A | Cr 232 |
| 600 | 1.6 | 0.2 | 2.6 | 0.3 | II | C5 | A | Cr 232 | |||
| 612 | 3.4 | 1.9 | 6.4 | 3.0 | II | C5 | A | Cr 232 | |||
| 616 | 0.9 | 0.7 | 1.1 | 0.9 | -6.6 | 2.1 | A | A | Cr 232 | ||
| 619 | 1.5 | 1.0 | 1.6 | 1.7 | -7.2 | 2.2 | A | 104439.84-593240.2 | C5 | A | Cr 232 |
| 621 | 1.4 | 1.0 | 1.6 | 1.2 | -5.9 | 2.2 | A | C5 | A | Cr 232 | |
| 625 | 1.4 | 0.9 | 1.7 | 1.1 | -6.3 | 2.3 | A | C5 | A | Cr 232 | |
| 634 | 1.8 | 1.5 | 2.5 | 1.2 | -5.6 | 2.2 | A | C5 | A | Cr 232 | |
| 642 | 1.9 | 0.8 | 2.8 | 0.9 | A | C5 | A | Cr 232 | |||
| 654 | 1.8 | 1.1 | 2.2 | 1.5 | -5.2 | 2.0 | 0/I | A | Cr 232 | ||
| 655 | 2.1 | 0.3 | 3.9 | 1.3 | -5.0 | 2.1 | A | A | Cr 232 | ||
| 656 | 2.3 | 1.4 | 3.1 | 1.8 | -5.2 | 1.9 | A | A | Cr 232 | ||
| 657 | 2.2 | 1.3 | 3.3 | 1.6 | -5.3 | 1.9 | A | A | Cr 232 | ||
| 660 | 1.8 | 1.1 | 2.2 | 1.2 | -8.5 | 2.4 | A | C5 | A | Cr 232 | |
| 699 | 1.0 | 0.8 | 0.7 | 1.0 | -4.8 | 2.2 | 0/I | 104451.91-602511.9 | G18 | D | 3X |
| 1295 | 1.7 | 0.1 | 3.4 | 0.2 | III | D | O | ||||
| 1297 | 1.2 | 0.4 | 1.3 | 1.3 | -5.0 | 2.3 | 0/I | D | O | ||
| 1302 | 1.4 | 1.1 | 1.9 | 0.6 | A | D | O | ||||
| 1304 | 2.6 | 1.5 | 4.2 | 1.5 | A | D | O | ||||
| 1308 | 2.0 | 1.2 | 3.1 | 0.9 | II | D | O | ||||
| 1312 | 2.2 | 0.1 | 3.7 | 0.4 | II | 104748.69-602611.1 | D | O | |||
| 1313 | 1.3 | 0.8 | 2.8 | 0.6 | II | D | O | ||||
| 1315 | 1.5 | 0.4 | 2.1 | 1.2 | -5.0 | 1.9 | 0/I | 104750.03-602619.1 | D | O | |
| 1316 | 1.2 | 0.8 | 1.8 | 1.1 | -6.3 | 2.5 | A | D | O | ||
| 1317 | 2.0 | 1.2 | 1.4 | 1.5 | -4.6 | 1.9 | 0/I | D | O | ||
| 1319 | 1.2 | 0.5 | 1.4 | 1.0 | -4.9 | 1.9 | 0/I | D | O | ||
| 1320 | 2.6 | 1.5 | 4.3 | 1.5 | -3.3 | 1.5 | 0/I | D | O | ||
| (1) | (2) | (3) | (4) | (5) | (6) | (7) | (8) | (9) | (10) | (11) | (12) |
|---|---|---|---|---|---|---|---|---|---|---|---|
| Physical Parameters from YSO Models | Observed X-ray PropertiesbbColumns (10)–(12) list the quantities NetCountst, EnergyFluxt, and MedianEnergyt from Table 1 of Broos et al. (2011a). | ||||||||||
| PCYC | Max,aaThe probability distributions of can be strongly skewed, with long tails to high values. This often yields very large values for , hence in cases where we define Max. | CCCP Match | Net | ||||||||
| No. | (M☉) | (M☉) | (K) | (K) | (yr-1) | (mag) | (mag) | CXOGNC J. | Counts | (keV) | (erg/cm2/s) |
| Hard X-ray Counterparts ( keV) | |||||||||||
| 138 | 3.1 | 0.7 | 3.6 | 0.0 | -5.0 | 104248.10-592539.3 | 101.5 | 3.3 | -13.4 | ||
| 140 | 0.8 | 0.9 | 3.5 | 0.1 | -5.8 | 104248.50-594835.5 | 5.2 | 2.3 | -14.9 | ||
| 179 | 10.1 | 0.9 | 3.6 | 0.0 | -3.6 | 104309.83-592454.2 | 44.9 | 4.0 | -13.9 | ||
| 239 | 1.2 | 1.2 | 3.6 | 0.2 | -5.6 | 104326.70-602622.7 | 149.6 | 4.7 | -12.9 | ||
| 282 | 1.9 | 1.5 | 3.7 | 0.2 | -5.6 | 104339.83-593300.9 | 3.6 | 3.0 | -14.9 | ||
| 318 | 2.8 | 1.0 | 3.7 | 0.2 | -5.8 | 104347.79-593304.4 | 5.6 | 2.9 | -14.8 | ||
| 348 | 3.7 | 2.4 | 3.8 | 0.4 | -5.4 | 104351.67-593257.0 | 9.6 | 2.1 | -14.4 | ||
| 353 | 1.9 | 1.1 | 3.7 | 0.1 | -5.8 | 104352.89-593921.8 | 92.9 | 2.4 | -13.6 | ||
| 371 | 4.0 | 1.1 | 3.7 | 0.1 | -5.4 | 104355.73-592417.5 | 55.3 | 2.8 | -13.6 | ||
| 373 | 3.7 | 1.2 | 3.7 | 0.0 | -5.3 | 104355.80-592421.7 | 11.8 | 3.2 | -14.1 | ||
| 387 | 1.5 | 1.7 | 3.6 | 0.2 | -5.4 | 104357.77-592833.3 | 8.5 | 2.2 | -14.6 | ||
| 419 | 2.8 | 1.6 | 3.6 | 0.1 | -4.8 | 104403.08-593748.7 | 19.0 | 2.6 | -14.5 | ||
| 484 | 9.5 | 0.8 | 4.0 | 0.6 | -5.2 | 104417.86-602745.9 | 5.5 | 4.7 | -14.4 | ||
| 598 | 2.2 | 1.6 | 3.7 | 0.3 | -5.3 | 104437.14-595802.4 | 29.1 | 4.0 | -13.9 | ||
| 623 | 3.5 | 1.3 | 3.8 | 0.5 | -4.9 | 104440.31-594339.7 | 2.3 | 5.4 | -14.9 | ||
| 686 | 0.9 | 1.0 | 3.6 | 0.1 | 104449.16-595346.6 | 138.3 | 2.9 | -13.5 | |||
| 699 | 0.7 | 1.0 | 3.5 | 0.1 | -4.7 | 104451.91-602511.9 | 376.8 | 5.2 | -12.3 | ||
| 713 | 1.6 | 0.7 | 3.7 | 0.1 | -6.2 | 104455.40-592634.5 | 35.5 | 4.4 | -14.1 | ||
| 774 | 2.1 | 1.1 | 3.7 | 0.1 | -6.6 | 104507.15-600156.9 | 79.2 | 3.0 | -13.8 | ||
| 897 | 0.6 | 0.5 | 3.6 | 0.1 | -5.3 | 104530.83-595809.5 | 5.3 | 2.2 | -15.0 | ||
| 1005 | 2.4 | 0.9 | 3.7 | 0.1 | -9.0 | 104549.19-601637.3 | 19.4 | 3.0 | -14.3 | ||
| 1073 | 1.7 | 1.0 | 3.6 | 0.0 | -5.7 | 104603.53-595339.3 | 28.6 | 2.2 | -14.3 | ||
| 1185 | 1.0 | 0.9 | 3.7 | 0.2 | -5.8 | 104637.74-594804.4 | 15.9 | 2.2 | -14.6 | ||
| 1236 | 2.7 | 0.4 | 3.6 | 0.0 | -5.0 | 104659.85-602535.0 | 10.3 | 2.3 | -14.4 | ||
| 1315 | 2.1 | 1.2 | 3.6 | 0.0 | -5.3 | 104750.03-602619.1 | 17.2 | 2.7 | -14.0 | ||
| 1367 | 7.6 | 2.5 | 4.0 | 0.2 | -5.4 | 104824.37-600759.5 | 22.0 | 4.2 | -13.9 | ||
| Soft X-ray Counterparts ( keV) | |||||||||||
| 83 | 0.8 | 0.6 | 3.6 | 0.0 | -5.1 | 104216.00-593607.6 | 13.5 | 1.5 | -14.4 | ||
| 148 | 0.6 | 0.5 | 3.6 | 0.1 | -4.5 | 104251.41-592535.6 | 5.5 | 1.5 | -14.9 | ||
| 156 | 1.0 | 0.7 | 3.7 | 0.2 | -5.4 | 104255.40-592456.5 | 3.6 | 1.5 | -14.9 | ||
| 189 | 1.2 | 0.7 | 3.6 | 0.1 | -6.3 | 104312.59-592516.2 | 30.1 | 1.8 | -14.4 | ||
| 288 | 2.6 | 1.0 | 3.6 | 0.0 | -5.1 | 104341.07-594537.2 | 51.1 | 1.5 | -14.4 | ||
| 346 | 2.5 | 0.6 | 3.6 | 0.0 | -4.7 | 104351.59-600525.2 | 17.0 | 1.3 | -14.6 | ||
| 352 | 1.7 | 1.6 | 3.6 | 0.2 | -5.7 | 104352.58-593025.1 | 8.7 | 1.4 | -15.1 | ||
| 355 | 2.0 | 0.9 | 3.7 | 0.1 | -5.3 | 104353.56-593410.1 | 5.6 | 1.5 | -15.0 | ||
| 369 | 2.1 | 1.5 | 3.7 | 0.1 | -6.3 | 104355.20-600519.8 | 11.5 | 1.2 | -14.4 | ||
| 376 | 0.5 | 0.7 | 3.6 | 0.3 | 104355.92-592537.6 | 19.5 | 1.5 | -14.7 | |||
| 424 | 2.8 | 1.1 | 3.7 | 0.2 | -5.5 | 104403.87-593308.3 | 4.7 | 1.0 | -15.4 | ||
| 432 | 2.3 | 0.9 | 3.7 | 0.0 | -5.3 | 104406.04-595510.6 | 11.1 | 1.7 | -14.6 | ||
| 450 | 2.3 | 1.2 | 3.7 | 0.2 | -5.7 | 104409.95-593436.1 | 27.2 | 1.5 | -14.3 | ||
| 459 | 1.3 | 0.7 | 3.6 | 0.1 | -7.2 | 104411.75-592431.1 | 19.5 | 1.6 | -14.5 | ||
| 496 | 1.7 | 1.4 | 3.6 | 0.1 | -5.3 | 104421.14-593000.9 | 4.6 | 1.3 | -15.1 | ||
| 505 | 0.8 | 1.0 | 3.6 | 0.1 | -6.2 | 104423.08-600819.3 | 26.9 | 1.2 | -14.4 | ||
| 508 | 0.7 | 0.9 | 3.6 | 0.2 | -5.8 | 104423.32-592513.5 | 5.5 | 1.6 | -15.1 | ||
| 521 | 1.3 | 1.1 | 3.7 | 0.3 | -8.3 | 104425.68-593923.5 | 55.1 | 1.3 | -14.5 | ||
| 548 | 1.7 | 1.7 | 3.6 | 0.1 | -5.4 | 104429.88-594533.8 | 4.6 | 1.3 | -15.2 | ||
| 556 | 9.0 | 3.2 | 4.0 | 0.6 | -4.9 | 104431.23-593311.2 | 18.2 | 1.9 | -14.3 | ||
| 593 | 1.5 | 1.2 | 3.7 | 0.2 | -7.7 | 104436.06-594258.4 | 12.9 | 1.5 | -14.7 | ||
| 667 | 1.5 | 0.8 | 3.6 | 0.0 | -5.4 | 104446.07-595816.8 | 12.6 | 1.5 | -14.9 | ||
| 694 | 1.5 | 1.5 | 3.6 | 0.2 | -5.5 | 104450.81-594442.9 | 58.2 | 1.6 | -14.2 | ||
| 768 | 2.6 | 1.4 | 3.7 | 0.1 | -5.9 | 104505.75-594405.0 | 16.4 | 1.3 | -14.7 | ||
| 795 | 1.3 | 0.9 | 3.7 | 0.2 | -6.2 | 104511.09-594533.5 | 66.4 | 1.4 | -14.1 | ||
| 890 | 0.7 | 0.9 | 3.6 | 0.2 | -5.8 | 104529.17-601357.0 | 20.7 | 1.4 | -14.5 | ||
| 928 | 1.0 | 0.8 | 3.6 | 0.1 | -6.0 | 104536.94-595611.3 | 9.5 | 2.0 | -14.6 | ||
| 987 | 0.6 | 0.7 | 3.5 | 0.2 | -5.3 | 104546.73-600343.3 | 14.7 | 0.9 | -15.1 | ||
| 1025ccPCYC 1025 is located in the the very crowded center of the Treasure Chest, hence it is very likely a combination of multiple confused sources in the IRAC beam, and the physical association of the CCCP source with the IRAC source is highly questionable. | 4.2 | 0.5 | 3.7 | 0.0 | -5.3 | 104553.71-595703.9 | 78.1 | 1.5 | -13.8 | ||
| 1055 | 3.6 | 2.8 | 4.0 | 0.6 | -5.2 | 104559.44-600517.9 | 352.0 | 1.6 | -13.2 | ||
| 1141 | 2.5 | 0.8 | 3.7 | 0.1 | -5.8 | 104622.54-594523.9 | 14.2 | 1.7 | -14.3 | ||
| 1193 | 0.5 | 0.7 | 3.5 | 0.2 | -5.8 | 104642.52-600826.7 | 7.9 | 1.5 | -14.9 | ||
| 1204 | 1.3 | 0.7 | 3.6 | 0.1 | -5.5 | 104646.68-600932.3 | 4.0 | 1.4 | -14.9 | ||
| 1276 | 0.8 | 0.8 | 3.6 | 0.1 | -8.1 | 104717.42-600906.1 | 61.0 | 1.6 | -13.9 | ||
| 1390 | 0.4 | 0.6 | 3.5 | 0.1 | -5.9 | 104836.21-601408.7 | 7.7 | 1.3 | -14.9 | ||